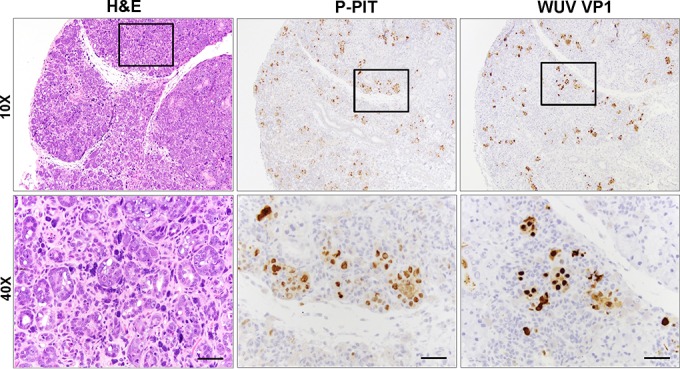
FIG 6 .

Immunohistochemistry analysis of parotid salivary gland tissue samples. H&E staining (left) showed glandular hyperplasia and inclusion bodies. P-PIT (middle) and WUV VP1 (right) staining correlated with H&E findings and revealed RatPyV2 T antigen and VP1 expression in these lesions. Scale bar = 100 μm. Images are shown at 10× and 40× the original magnification.
