

Abstract
The purpose of this work is to evaluate biodegradable drug carriers with defined size, hydrophobicity, and surface charge density for preferential lymphatic uptake and retention for sustained regional drug delivery. PLGA–PMA:PLA-PEG (PP) nanoparticles of defined size and relative hydrophobicity were prepared by nanoprecipitation method. These were compared with PS particles of similar sizes and higher hydrophobicity. PLGA–PMA:PLGA-COOH (PC) particles at 80:20, 50:50, and 20:80 ratios were prepared by nanoprecipitation for the charge study. Particle size and zeta potential were characterized by dynamic light scattering and laser doppler anemometry, respectively. Particles were administered in vivo to rats subcutaneously. Systemic and lymph node uptake was evaluated by marker recovery. Lymphatic uptake and node retention of PP nanoparticles was shown to be inversely related to size. Lymphatic uptake and node retention of PP particles, as compared to PS particles, was shown to be inversely related to hydrophobicity. Lastly, lymphatic uptake and node retention of PC nanoparticles were directly related to the anionic charge on the particles. In vivo lymphatic uptake and retention in a rat model indicates that the 50 nm PP particles are ideal for sustained regional delivery into the lymphatics for prevention/treatment of oligometastases.
Keywords: PLGA, lymphatic transport, nanoparticles, biocompatibility, distribution
INTRODUCTION
The lymphatic system is a uni-directional system closely associated with the circulatory system.1 The three main functions of the lymphatics are maintaining fluid balance, providing immune responses, and a specialized role in absorbing lipids in the gastrointestinal tract.2 While the lymphatics have been shown to be the target organ for disease states like HIV3 and lymphomas no commercial drug delivery systems exist to target this region specifically. The lymphatics can also harbor metastatic cancer cells and is a region where oligometastases or nanometastases develop secondarily to the primary tumor cells.4 These oligometastases, are small numbers of cancerous cells localized to particular area, while nanometastases are small clusters of a few to several hundred tumor cells, which cannot be detected except by immunohistology of excised tissues. Both have the ability, overtime, to metastasize and spread the cancer to distal regions of the body.4,5 In such cases a regional therapeutic agent is required for preventative and therapeutic purposes.
Lymphatic drug delivery has been pursued by several workers.6–14 Key physicochemical parameters have been identified by these works as affecting lymphatic uptake. These parameters include molecular weight, size, charge, and hydrophobicity. Early studies using macromolecules and liposomes identified molecular weight and size as defining parameters for lymphatic uptake. Supersaxo.6 conclusively demonstrated that macromolecules with a molecular weight greater than 16 kDa have preferential lymphatic uptake. This finding was further supported by Takakura et al. in their studies with mitomycin conjugated to different molecular weight dextrans.7 Oussoren et al. demonstrated that subcutaneously (SC) injected small liposomes (~70 nm) had greater uptake into the lymphatics as compared to larger liposomes.8 Another parameter that has been shown to affect lymphatic uptake are the surface properties of the macromolecule or carrier system. Takakura et al. in their studies with mitomycin conjugated to different molecular weight cationic and anionic dextrans demonstrated that cationically charged conjugates were taken up to a lower degree as compared to neutral or anionically charged conjugates.9,10 Mohigimi et al. have shown that surface modification of 60 nm PS particles leads to differential lymphatic uptake patterns and lymph node retention.11 Similarly Hawley et al. have demonstrated sterically stabilized particles of polyethylene glycol coated 85 nm biodegradable polylactic-co-glycolic acid have differential lymphatic uptake and lymph node retention.12 Hydrophobicity, another parameter that can be tied to the surface properties of the particle can impact the uptake and retention of these particles by the lymphatic system.13 Hawley et al. have indirectly shown that as the hydrophobicity of the particle increases lymphatic uptake and lymph node retention decreases due to increased opsonization and phagocytosis of these particles.14
Despite the work done thus far no therapeutic products to treat the lymphatics regionally or in its entirety have emerged. This is probably due to the complexity of the interplay between the bulk properties of a carrier and its interaction with the lymphatic system itself. Additionally even though general trends have emerged from the body of literature in terms of size, charge, and hydrophobicity and lymphatic uptake there seems to be some variability between the different particulate systems. The other matter that must be considered for chronic lymphatic therapy is the long-term effect of the carrier/particulate system on the body. Clearly for any type of chronic therapy for regional or global purpose must include a biodegradable particulate system. A systemic study of properties of biodegradable polymeric drug carriers which can be modulated to successfully target the regional lymphatics is still lacking. Understanding the interplay of the bulk properties of biodegradable particles is crucial to developing a carrier system that can be utilized for chronic therapy. Thus the driving force for our research is to define the bulk properties, such as size, charge, and hydrophobicity, of a polymeric biodegradable drug carrier system which will be preferentially taken up into the lymphatics and then be retained in the local lymph nodes for sustained regional drug delivery.
The purpose of this work is to evaluate the lymphatic uptake and node retention of biodegradable particles of varying sizes, hydrophobicity, and surface charge densities in vivo in rats. PLGA 50/50 was chosen as our polymer scaffold to fabricate the nanoparticles used in the study. The choice of PLGA was dictated by the fact that it can be used to form stable nanoparticles, has already been approved for use in humans by the FDA and is commercially available. PLGA was tracked in vivo by conjugating a marker molecule, PMA to the polymer backbone. This conjugate was coprecipitated with polyethylene glycol-co-polylactic acid (PEG:PLA) at 75:25 ratios to make PP particles of 50, 100, and 200 nm for the size study. The reason for using PEG-PLA as a coprecipitant was to further lower the surface hydrophobicity of the nanoparticles. These particles were then compared with similarly sized, commercially available, non-biodegradable fluorescent PS particles for the hydrophobicity study. PS particles were chosen to compare with PLGA particles for the hydrophobicity study as PS particles are more hydrophobic compared to PLGA particles based on their water contact angle measurements [PLGA 50/50 is 76°15 and PS is 90°16]. It must be, however, kept in mind that there is no direct measure for hydrophobicity of particles and this study will provide only a qualitative comparison between PLGA and PS particles. For the charge study, PLGA–PMA 50 nm particles were prepared with varying charge densities by coprecipitating the conjugate with PLGA terminated with a carboxylic acid group (PC particles).
To evaluate different properties of a drug carrier leading to enhanced lymphatic uptake and regional lymph node retention nanoparticles of different sizes, hydrophobicities, and surface charges were used to ensure that only one of the three properties is being considered at one time in the context of the in vivo study. The effect of particle size was evaluated using PP nanoparticles of 50, 100, and 200 nm. The effect of hydrophobicity on lymphatic uptake and regional lymph node retention was evaluated by comparing the uptake and retention of PS 60, 112, and 200 nm to PP 50, 100, and 200 nm, respectively. Lastly, the effect of surface charge density on lymphatic uptake and regional lymph node retention was evaluated by comparing the uptake and retention of 50 nm PC 80:20, 50:50, and 20:80 to each other and to the 50 nm PP particle.
MATERIALS AND METHODS
Materials
Poly(D,L-lactic-co-glycolic) acid (PLGA-COOH), acid end group 50/50 (inherent viscosity of 0.67) was purchased from Absorbable Polymers International (Pelham, AL). PMA hydrochloride, 95% pure, and diisopropylcarbodiimide (DIC), 99% pure were purchased from Sigma–Aldrich (St. Louis, MO). Poly(ethylene glycol-b-D,L-lactic acid) (PEG-b-PLA) was purchased from Polymer Source, Incorporated (Montreal, Canada). The molecular weights of the PEG and PLA blocks were 700 and 1800 g/mol, respectively. DIEA was acquired from Perspective Biosystems (Warrington, UK). Yellow green fluorescent PS particles of 60, 112, and 200 nm were purchased from Polysciences, Incorporated (Warrington, PA) and were diluted and used as received. Isoflurane (IsoFlo®) was ordered from Abbott labs (Chicago, IL). Blood collection tubes (2 mL), containing 50 mM EDTA, were obtained from Midwest-Vet Supply (Madison, WI). Cellosolve acetate was purchased from Sigma, Inc. (St. Louis, MO). All other reagents were acquired from Fisher Scientific (Hanover Park, IL) and were of ACS grade.
Male wistar albino rats of approximately 300 g body weight were used in all experiments. The rats were obtained from Harlan (Madison, WI) and housed in the in-house animal care facility at School of Pharmacy, Madison, WI. The rats were maintained in a temperature and humidity controlled environment with free access to food and water. All procedures used in the study were approved by the research animal resources center (RARC) at University of Wisconsin, Madison, WI in compliance with the NIH principles of laboratory animal care.
Methods
Conjugation of PMA to PLGA
Conjugation of PMA to PLGA-COOH was done using standard amino acid reaction conditions.12,17–20 Briefly, PLGA-COOH 50:50 (5 g) was dissolved in 40 mL of dichloromethane (DCM). DIC was added in a 1:10 molar excess and the solution was stirred for 15 min to activate the terminal carboxylic group on the PLGA-COOH. A 10 M equivalent of PMA was dissolved in 2 mL of DCM using DIEA to neutralize the salt form. The PMA solution was added drop wise to the polymer solution with stirring and the reaction was allowed to continue overnight protected from light and moisture. Conjugation was confirmed using thin layer chromatography. The PMA bound polymer was recovered by concentrating the reaction mixture and precipitating the polymer bound dye with diethyl ether. This process was repeated five additional times to ensure removal of all unbound dye molecules. Final purification of the PLGA–PMA was performed by washing three times with 0.1 N HCl and care was taken to minimize the time of exposure to the acid. The polymer was freeze-dried and stored under dry conditions, protected from light at −20°C. The separation of unconjugated free-PMA from a mixture of PLGA–PMA conjugate was confirmed by GPC. The polymer conjugate was also further characterized by 1H and 13C NMR.
Nanoparticle Formation
Nanoparticles were prepared by a modified nanoprecipitation method.12 PP (75:25) was dissolved in acetone at a final concentration of 0.1% (w/v). To this equal volume of water was added and the acetone was allowed to evaporate with continuous stirring, protected from light. By varying the rate of addition of the aqueous phase to the polymer solution in acetone it was possible to form nanoparticles of different sizes. The PLGA–PMA:PLGA-COOH (PC) particles were formed identically with the rate of addition fixed to yield 50 nm particles. The ratios at which the PLGA–PMA was coprecipitated with PLGA-COOH are 80:20, 50:50, and 20:80 in order to give particles with varying charge distribution.
Dynamic Light Scattering (DLS)
Hydrodynamic diameters were determined by DLS using the NICOMP ZLS380 particle sizer (particle sizing systems, Santa Barbara, CA). Samples were prepared at a concentration of 0.1% (w/v) in DI water. Data were acquired to have at least 100 K counts in channel 1. The light scattering data were interpreted using Gaussian analysis. All particle sizes are expressed as volume-weighted diameters. The results are expressed as a mean of 25 measurements ±SD.
Laser Doppler Anemometry (LDA)
A Malvern Zetasizer Nano (Malvern, UK) with a PS disposable capillary cell was used for LDA measurements. Samples were freshly prepared in water and sample of 25 μL were run at ambient room temperature. The results are expressed as a mean of three measurements ±SD.
Degradation Study
In vitro degradation of nanoparticles was characterized by simultaneously quantifying the rate of degradation of PLGA and tracking the presence of the dye in the degraded fragments by UV at 338 nm and FL with excitation at 338 nm and emission at 368 nm.21 The experiment was conducted by adding 0.2 mg (2 mL volume) of PP nanoparticles of 50, 100, and 200 nm to a dialysis cassette slide-a-lyzer® with a MWCO of 3500. The samples were incubated under sink conditions at 37°C and at pH 7.4. At specific time intervals over 7 days, 200 μL samples were withdrawn, frozen, freeze dried, and stored for analysis at −80°C. This volume was replaced with an equal amount of DI water. For analysis, samples were dissolved in 0.2 mL of THF and filtered through a 0.2 μm nylon filter. The samples were analyzed by GPC using an Agilent 1100 Series LC system equipped with a Shodex KF-804 column with THF as the mobile phase. A flow rate of 1 mL/min was maintained at 40°C with an injection volume of 50 μL. Polymer fragments were monitored by the RI detector while the PMA was quantified using the UV detector at 338 nm and FL detector (excitation at 338 nm) emission at 368 nm. All measurements were done in triplicate. Molecular weights were calculated using PS standards.
Design of Animal Experiments
Male wister rats of approximately 300 g were used in the study. All procedures used in the study were approved by the RARC at University of Wisconsin, Madison, WI in compliance with the NIH principles of laboratory animal care. The animal study was divided into three groups with each group containing 10 rats per time point. The first group was the size study group which was given PP 50 or 100, or 200 nm particles SC (n = 150). The second group was the hydrophobicity study group which was administered PS 60 or 112, or 200 nm particles SC (n = 150). The last group was the charge study group which was administered 50 nm PC 80:20, 50:50, or 20:80 particles SC (n = 150). All rats were dosed with 100 μL of particles containing 0.1 mg polymer. The injection was administered into the dorsal surface of the rat FP under isoflurane anesthesia (Fig. 1). Following the injection at various time points (3, 6, 12, 24, and 48 h) 1 mL of blood was drawn via the jugular vein and the rats were euthanized. The FP, left popliteal (LPN), inguinal (LIgN), iliac (LIN), and renal (LRN) lymph nodes were excised (Fig. 1) and were washed in phosphate buffered saline and stored at −80°C for further analysis. The blood samples were centrifuged at 5000 rpm for 5 min and the serum was placed in the heparinized tubes and stored at −80°C for further analysis. Total blood volume was estimated at 7.5% body weight.22
Figure 1.
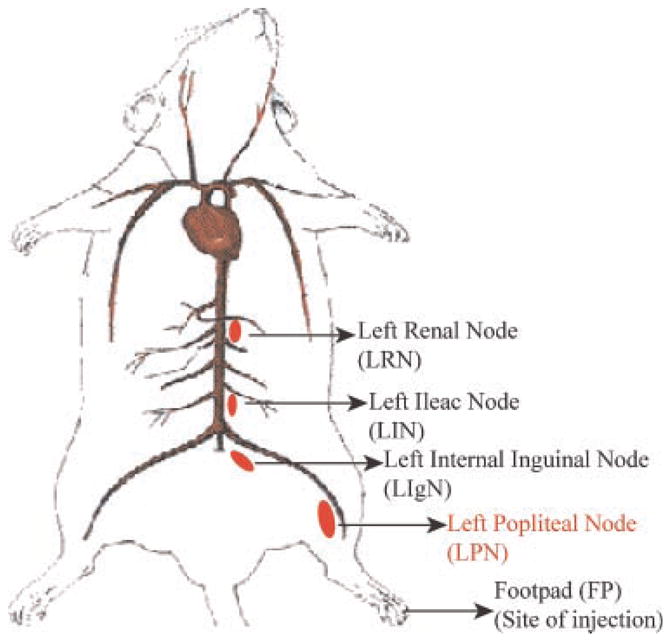
Schematic of the animal model (rat) depicting the site of injection and the nodes of interest.
Extraction of PLGA–PMA from Biological Samples and Analysis of PMA by HPLC
A volume equivalent to 500 μL of serum or each tissue sample was placed in 500 μL of 10 M NaOH or 1 mL of 10 M NaOH, respectively. All samples were sonicated using a Branson sonifier (Branson Ultrasonics Corporation, Danbury, CT) for 20 s at 50% amplitude. They were placed in a sand bath for 2 h to allow tissue and polymer to degrade.23 Samples were vortexed, split into four 1.8 mL centrifuge tubes and washed twice with chloroform. The washings were evaporated overnight in the dark and samples were reconstituted in 500 μL chloroform filtered through a 0.45 μm nylon filter and injected into a Econosil C18 10 μ column 250 mm × 4.6 mm (Alltech Associates, Inc., Deerfield, IL) connected to an Agilent 1100 Series LC system and a Fluorescence Monitor Model 1700 (Bio-Rad Laboratories, Inc., Hercules, CA) FL detector. Samples were simultaneously detected by UV at 338 nm and by FL at 368 nm (excitation at 338 nm). The mobile phase was THF with a flow rate of 1 mL/min and an injection volume of 20 μL with a run time of 8 min. The column temperature was maintained at 40°C. Detection limit for PMA by this method was 3.7 × 10⁻⁶ M with a retention time of 2.75 min. Recovery of marker from serum was ~85% and nodes ~80%.
Extraction of Fluorescent Marker in PS Particles from Biological Samples and Analysis of Marker by HPLC
A volume equivalent to 500 μL of serum or each tissue sample containing 500 μL of DI water were vortexed and sonicated using a Branson sonifier (Branson Ultrasonics Corporation) for 10 s each at 70% amplitude. A volume of 500 μL of cellosolve acetate was added and samples were vortexed and shaken at room temperature at 250 rpm for 1 h to extract marker.24 The samples were then vortexed and centrifuged at 7000 rpm for 5 min to sediment the PS. The supernatant was filtered through a 0.45 μm nylon filter and injected into a Econosil C18 10 μ column 250 mm × 4.6 mm (Alltech Associates, Inc.) connected to an Agilent 1100 Series LC system composed and a Fluorescence Monitor Model 1700 (Bio-Rad Laboratories, Inc.) FL detector. Samples were detected by FL at 480 nm (excitation at 440 nm) with a marker retention time of 5.23 min. The mobile phase was an isocratic mixture of THF/water (60:40) with a flow rate of 1 mL/min and an injection volume of 20 μL with a run time of 7 min. The column temperature was maintained at 40°C. Recovery of marker from both serum and nodes was ~80%. In the case of these nanoparticles, the identity of the marker was not provided by the company and so a blank calibration curve of particles being treated under similar conditions was prepared in order to quantify the amount of particle uptake. Thus, no molar detection limit is available for this method.
Statistical Analysis
The statistical program GraphPad Prism 5 (Windows version 5, 2008, GraphPad Software, Inc. San Diego, California) was used to analyze the data. The in vitro values were compared using one-way ANOVA at 5% significance level with Tukey’s multiple comparison test for postanalysis. Graph-Pad Prism 5 was also used to generate the pharmacokinetic parameter AUC needed in data analysis. Parameters obtained were compared using one-way ANOVA at 5% significance level with Tukey’s multiple comparison test for post-analysis or unpaired t-test at 5% significance level. To determine the number of animals included in the treatment groups, power analysis was performed with β set at 80% and α set at 5% level.
RESULTS AND DISCUSSION
Polymer Synthesis and Characterization
The conjugation of 1-PMA to PLGA 50:50 was confirmed by GPC and NMR. The parent PLGA-COOH 1H and 13C NMR spectra were acquired and the chemical shifts signals corresponded well with previously documented literature values.25–27 The polymer conjugate, PLGA–PMA 1H NMR spectrum showed all the characteristic peaks of the PLGA-COOH and the protons of the phenantherene ring system of the PMA in the range of 7.8–8.4 ppm. Likewise, the 13C NMR spectrum of the PLGA–PMA, revealed signals from both the parent PLGA-COOH and PMA with the carbon atoms of the phenantherene ring system of PMA visible at 122–136 ppm.
Nanoparticle Characterization by DLS and LDA
The results for the nanoparticle characterization are listed in Table 1. Two sets of particle sizes were assessed: PP (75:25) particles for the size study and the PLGA–PMA:PLGA-COOH (at ratios of 80:20, 50:50, and 20:80) (PC) for the charge study The PP particles for the size study were compared against each other using one-way ANOVA with Tukey’s multiple comparison postt-est. All three sizes of PP particles were statistically significantly different from each other indicating that any potential differences in uptake and retention in vivo can be attributed to size variation. Similarly the PC particles from the charge study were compared against the PP 50 nm particle using one-way ANOVA with Tukey’s multiple comparison posttest. The PC particles were compared against the 50 nm PP particle and the results indicate that the sizes were not statistically different. Therefore the potential differences in uptake and retention with these particles in vivo are not likely to be governed by size. The zeta potential values (ζ) for all particles have also been listed in Table 1. In general, the particles used in the charge study have lower ζ values (higher negative surface charge density) compared to the PP particles. The trend in the decreasing ζ values for charge particles follows increasing anionic charge density. Thus the 20: 80 PC particles had the lowest ζ values, followed by the 50:50, and then by the 80:20 PC particles. It is expected that this trend in surface charge differences will lead to differential in vivo uptake.
Table 1.
Size and Zeta Potential of Particles as Assessed by DLS
| Particles | Size Mean ± SD (nm) |
Zeta Potential Mean ± SD (mv) |
|---|---|---|
| PP 50 | 56 ± 16.2* | −36.1 ± 14.6 |
| PP 100 | 109.3 ± 17.4* | −34.2 ± 10.7 |
| PP 200 | 201.8 ± 34.8* | −35.5 ± 12.4 |
| PC 80:20 | 50.0 ± 19.1 | −44.6 ± 11.3 |
| PC 50:50 | 50.2 ± 17.9 | −48.0 ± 16.6 |
| PC 20:80 | 46.9 ± 17.0 | −57.1 ± 11.1 |
n = 25, mean ± SD (size) and n = 3 ± SD (ζ).
Denotes statistical significance at p < 0.05.
In Vitro Degradation of Nanoparticles
The in vitro degradation profiles for the 50, 100, and 200 nm PP particles at pH 7.4 in PBS over 7 days are given in Figure 2. As seen from the graphs, the FL and the UV signals from the PMA overlap the polymer degradation profile as detected by the RI detector. These results indicate that for all particle sizes the PMA remained associated with the bulk of the polymer as it degraded. The degradation profiles themselves are similar for all three particle sizes, with the overall trend for the nanoparticles degradation rate being PP 50 faster than PP 100, which was in turn faster than PP 200 nm.
Figure 2.

In vitro degradation profile of PP 50, 100, and 200 nm particles at pH 7.4, 37°C for 7 days (n = 3, mean ± SD).
The premise for the in vitro degradation study was that the polymer rate of degradation would be faster than the rate of degradation of the amide bond connecting the dye to the polymer. It is therefore hypothesized that the majority of the dye would remain associated with the polymer until significant degradation of the polymer occurred. The in vitro degradation profiles for the 50, 100, and 200 nm PP particles indicate that for all particle sizes the PMA stayed associated with the bulk of the polymer as it degraded (Fig. 2). Therefore, we could make the assumption that in vivo we were detecting the polymer–PMA conjugate and not the free-PMA. The degradation profiles themselves are similar for all three particle sizes, with the overall trend for the nanoparticle degradation being PP 50 faster than PP 100, which was faster than PP 200 nm. This trend is not surprising, as the degradation rate increases with decreasing size due to the higher surface area of the smaller particles. This rapid degradation for smaller particles is especially true in the initial phase of this biphasic degradation profile, which has been documented in literature.28 The initial rapid loss is thought to occur due to the compact structure of the polymer, which limits the diffusion of the degradation products, which in turn can auto catalyze the degradation process.29 The slower, latter, degradation is thought to occur due to the increased porosity of the particles leading to the loss of these degradative products, thus raising the internal pH, which in turn slows down the rate of ester hydrolysis.29
Animal Study
The results of the animal study will be discussed first from the view point of LPN (Fig. 1) accumulation as this is the primary node of interest and is the node being targeted for regional delivery into the lymphatics. Thereafter cumulative lymphatic uptake is discussed as this is the total amount recovered from all four nodes (LPN, LIgN, LIN, and LRN) (Fig. 1). Lastly serum data for these particles will be presented. The marker, PMA alone was administered as a 100 μL dose of a 1 mg/mL solution into the dorsal surface of the rat FP as a negative control. Results indicated non-preferential lymph node uptake with significantly higher serum uptake as expected for a small molecule (data not shown).
Size Study
The results from the size study group treated with one of three PP particles, 50, 100, or 200 nm are listed in Table 2 and Figure 3. Area under the curve (AUC0–48 h) data shows particle drainage from the injection site for all three particles with lymph node accumulation in all cases. Comparison of the three particle sizes of PP indicates a difference in the uptake and retention of these particles in the nodes. The drainage of PP 50 particles from the injection site was statistically significantly different until 6 h compared to PP 100 nm and PP 200 nm (data not shown). The rate of drainage from the injection site for all three particle sizes was statistically significantly different at the 3 h time point (data not shown).
Table 2.
AUC0–48 h of PP Particles from Lymph Nodes Post-SC Injection into the Dorsal Surface of the Rat Footpad
| PP (nm) | AUC0–48 h (mg h)/g
|
LPN Ratioa | Cumulative Ratiob | ||||
|---|---|---|---|---|---|---|---|
| LPN | LIgN | LIN | LRN | Cumulative | |||
| 50 | 177.7 ± 8.69 | 45.86 ± 2.74 | 50.67 ± 3.59 | 11.6 ± 0.86 | 285.86 ± 15.87 | 1.9* | 2.2* |
| 100 | 140.6 ± 6.24 | 31.1 ± 1.86 | 29.53 ± 1.42 | 14.07 ± 1.39 | 215.37 ± 10.90 | 1.5* | 1.6* |
| 200 | 94.54 ± 4.70 | 12.39 ± 1.37 | 16.91 ± 1.80 | 6.84 ± 0.35 | 130.68 ± 8.21 | 1.0* | 1.0* |
n = 10; mean ± SEM.
Denotes statistical significance at p < 0.05.
Ratio of LPN AUC0–48 h of PP 50 and PP 100 to LPN PP 200 particles.
Ratio of cumulative AUC0–48 h of PP 50 and PP 100 to PP 200 particles.
Figure 3.

Comparative left popliteal node uptake (LPN) and retention for PP 50, PP 100, and PP 200 particles from rat footpad; n = 10, mean ± SEM, *indicates statistical significance at a p-value <0.05.
The primary node of interest, LPN showed the greatest accumulation of all particles injected compared to the other nodes. The 50 nm particle has statistically significantly higher levels of the polymer for the first 6 h and at 48 h compared to the 100 and 200 nm particles (Fig. 3). The uptake of the particles into LPN was size dependent with the highest uptake was for the smallest particles PP 50 AUC0–48 h 177.7 ± 8.7 followed by PP 100 AUC0–48 h 140.6 ± 8.7 and the lowest uptake was for the largest particles PP 200 at AUC0–48 h 94.5 ± 4.7 (mg h)/g (Tab. 2). The overall LPN accumulation of the 200 nm particle was significantly lower as compared to the 50 and 100 nm particles (Fig. 3). Comparison of the AUC values obtained from the LPN nodes shows a statistically significant trend in uptake and retention of PP particles in the regional node of interest (Fig. 3). Uptake in LIgN and LIN was similar within all particles groups. LRN had the least uptake of all particles, as it was the most distal site assessed. Comparison of the cumulative nodal AUC shows the same trend and the primary contributor to the cumulative node uptake is the LPN. The order of uptake is PP 50 then PP 100 followed by PP 200 particles.
Serum AUC0–48 h levels for PP 50, 100, and 200 are 6.29 ± 0.03, 5.30 ± 0.33, and 3.30 ± 0.24 (mg h)/mL, respectively (Tab. 4), which are statistically significantly different from each other. Serum levels for all three particle sizes tested indicate that the 50 nm particles have earlier accumulation into the vascular compartment than the 100 or 200 nm particles (Tab. 4). Over time, however, there is no difference in the serum levels for the 50 and 100 nm particles. The 200 nm particles have the lowest serum accumulation and this becomes more pronounced at later time points (data not shown). Interestingly serum levels remain almost constant for the entire concentration time profile (data not shown). This indicates that the particles are probably not only accessing the vascular compartment through the thoracic lymph duct but also possibly through the lymphovenous communications present within the nodes. The serum uptake trend is similar to the node uptake with the order of serum accumulation being PP 50 then PP 100 followed by PP 200 particles.
Table 4.
AUC0–48 h of PS and PP Particles from Serum and Lymph Nodes Post-SC Injection into the Dorsal Surface of the Rat Footpad
| PS
|
PP
|
Ratio of PP/PS Cumulative Node1 AUC0–48 h | ||||
|---|---|---|---|---|---|---|
| Size (nm) | Serum AUC0–48 h (mg h)/mL | Cum. Node AUC0–48 h (mg h)/mL | Size (nm) | Serum AUC0–48 h (mg h)/mL | Cum. Node AUC0–48 h (mg h)/mL | |
| 60 | 0.056 ± 0.04 | 28.6 ± 5.3 | 50 | 6.29 ± 0.03 | 285.9 ± 15.9 | 10.0* |
| 112 | 0.097 ± 0.05 | 23.3 ± 3.1 | 100 | 5.30 ± 0.33 | 215.4 ± 10.9 | 9.2* |
| 200 | 0.00 ± 0.00 | 4.0 ± 1.8 | 200 | 3.30 ± 0.24 | 130.7 ± 8.2 | 32.4* |
n = 10; mean ± SEM.
Ratio of cumulative node uptake AUC0–48 h of PP to PS particles for similarly sized particles.
Denotes statistical significance at p < 0.05.
Thus, the overall trend indicates that PP 50 particles have higher uptake and retention followed by PP 100 and then PP 200 particles. This is especially evident in the primary node levels, LPN, as seen in Table 2 and Figure 3. As the particle size increases, a lower amount of the particles traffic through the lymphatic system leading to lower accumulations in the nodes. When the concentration in the LPN is compared for all three sizes, they are all statistically significantly different from each other. This same trend is observed when looking at the overall nodal accumulation.
The size uptake study confirms previous studies done using liposomes and other carrier systems.30 Oussoren et al. have suggested that liposomal size is the most important factor that determines the extent of liposome absorption. Small, neutral liposomes less than 100 nm in size can be absorbed upto 70% by the lymphatics when administered SC. However, larger liposomes, greater than 100 nm, will remain at the injection site almost exclusively.30 Our results indicate that size is also the primary determinant for lymphatic uptake but for biodegradable nanoparticles some uptake of larger particles (>100 nm) is possible if the hydrophobicity of the particle can be altered.
Hydrophobicity Study
The results for uptake and distribution of the PS 60, 112, and 200 particles are listed in Table 3. AUC0–48 h data shows particle drainage from the injection site for all three particles with lymph node accumulation in all cases (Fig. 4). Comparison of the PS particles used for the hydrophobicity study indicates a difference in the uptake and retention of these particles in the nodes (Tab. 3). The drainage of PS 60 particles from the injection site was not statistically significantly different from that of PS 112 particles (data not shown). This is probably due to the high hydrophobicity of the PS surface which leads to rapid aggregation at the injection site and thereby effectively increases the particle size of the 60 particle and makes it behave like the PS 112 particle. PS 200 nm particles however, having a much larger size are first limited by diffusion and then by the hydrophobicity which probably leads to aggregation at the injection site. This in turns leads to statistically different drainage pattern for PS 200 particles when compared to the PS 60 or PS 112 particles (data not shown).
Table 3.
AUC0–48 h of PS Particles from Lymph Nodes Post-SC Injection into the Dorsal Surface of the Rat Footpad
| PS (nm) | AUC0–48 h (mg h)/g
|
LPN Ratioa | Cumulative Ratiob | ||||
|---|---|---|---|---|---|---|---|
| LPN | LIgN | LIN | LRN | Cumulative | |||
| 60 | 26.99 ± 4.53 | 0.46 ± 0.155 | 1.16 ± 0.34 | — | 28.61 ± 5.33 | 7.4 | 7.1 |
| 112 | 22.26 ± 2.71 | — | 1.00 ± 0.39 | — | 23.26 ± 3.09 | 6.1 | 5.8 |
| 200 | 3.67 ± 1.56 | — | 0.36 ± 0.19 | — | 4.03 ± 1.75 | 1.0* | 1.0* |
n = 10; mean ± SEM.
Denotes statistical significance at p < 0.05.
Ratio of LPN AUC0–48 h of PS 60 and PS 112 to LPN PS 200 particles.
Ratio of cumulative AUC0–48 h of PS 60 and 112 to PS 200 particles.
Figure 4.

Comparative left popliteal node uptake (lpn) and retention for PS 60, PS 112, and PS 200 particles from rat footpad; n = 10, mean ± SEM, *indicates statistical significance at a p-value <0.05.
LPN, the primary node of interest, uptake and retention of PS particles was also different for the three particle sizes tested (Tab. 3 and Fig. 4). LPN showed the greatest accumulation of all particles injected compared to the other nodes. The uptake of the particles into LPN was size dependent with the highest uptake was for the smallest particles PS 60 AUC0–48 h 26.99 ± 4.53 followed by PS 112 AUC0–48 h 22.26 ± 2.71 and the lowest uptake was for the largest particles PS 200 at AUC0–48 h 3.67 ± 1.56 (mg h)/g (Tab. 3). However, the 60 nm particles do not have statistically significantly higher levels of the particles in the LPN as compared to the 112 nm particles. This is probably due to the hydrophobicity of these particles leading to rapid aggregation of the 60 nm particles before they can diffuse away. This makes the 60 nm particles behave like the 112 nm particles. In general, looking at the trend it seems like the 60 nm particles do have a higher accumulation probably due to diffusion but this difference is not statistically significant. PS 200 nm particles had the lowest levels of nodal accumulation and were statistically significant at all time points when compared to the 60 or 112 nm particles (Tab. 3 and Fig. 4). Comparison of the AUC values obtained from the LPN, regional node of interest, shows a decreasing trend in uptake and retention of PS particles in the order of PS 60 then PS 112 and then PS 200 (Tab. 3 and Fig. 4). Uptake into LIgN was only detected for the PS 60 particle. LIN uptake was lower than LPN uptake and no uptake was detected in LRN for all three particle groups. Comparison of the cumulative nodal AUC shows the same trend and the primary contributor to the cumulative node uptake is the LPN. The order of uptake is PS 60 then PS 112 followed by PS 200 particles, however there is no statistically significant difference between the PS 60 and PS 112 nm particles while both of these particles were statistically significantly higher than PS 200 particles.
Serum levels for all three particle sizes tested showed very low accumulation into the vascular compartment. Serum AUC0–48 h levels for PS 60, 112 were 0.056 ± 0.04, 0.097 ± 0.05 (mg h)/mL, respectively, while PS 200 particles were not detected in serum (Tab. 4). In the majority of the rats used for this study, serum levels remained low to undetectable (Tab. 4). PS 60 nm particles were the only particles that seemed to accumulate into the vascular compartment over time. However, the concentrations seen were statistically significant when compared to the 112 or the 200 nm particles (Tab. 4). The serum uptake trend is similar to the node uptake with the order of serum accumulation being PS 60 then PS 112 and then PS 200 particles.
Thus, the overall trend indicates that PS 60 particles have higher uptake and retention followed by PS 112 and then PS 200 nm particles. However, when the AUC for the overall nodal accumulation and specifically the LPN accumulation was compared, there was no statistically significant difference between the 60 and the 112 nm particles (Tab. 3). Both, however, are statistically significantly higher than the 200 nm particles. This is especially evident in the primary node levels (Tab. 3).
The comparative results from the hydrophobicity study of PS 60, PS 112, and PS 200 to PP 50, PP 100, and PP 200, respectively, are listed in Table 4. When the LPN and overall nodal accumulation of PS particles are compared to PP particles (Tab. 4) it is obvious that PP (low hydrophobicity) particles have much higher nodal accumulation than the PS (higher hydrophobicity) particles. These differences in accumulation are statistically significant for all three sizes. This is clearly indicative that hydrophobicity is the governing factor in the uptake of PS particles and not size. Looking at the serum concentration time profiles and comparing the two, it seems more likely that PS particles traffic almost entirely through the length of the lymphatic system and do not seem to traverse through the lymphovenous communications.
Charge Study
The charge density of 50 nm PC particles increases with increasing PLGA-COOH concentration with the 80:20 particles having the least anionic charge followed by the 50:50 and then the 20:80 particles (Tab. 1). The comparative results from the charge study with the PC 80:20, PC 50:50, and PC 20:80 particles are listed in Table 5. AUC0–48 h data shows a differential particle drainage from the injection site for all three particles with lymph node accumulation in all cases. The rate of drainage from the injection site for PC 50:50 and PC 80:20 particles, compared to PC 20:80 particles, remained statistically significantly lower for the first 24 h (data not shown). This is probably due to the higher charge density of the PC 20:80 particles which propels these particles from the interstitial spaces faster than the other two particle types. This differential movement through the interstitium is also seen, to a lesser degree, with PC 80:20 and PC 50:50. Thus, as the anionic charge density on the particle increases, it moves faster through the interstitium. This is because the interstitial matrix, under physiological conditions, carries a slight net negative charge.31 This charge repulsion probably accounts for differences in drainage patterns observed while size plays a minimal role as all the particles are 50 nm.
Table 5.
AUC0–48 h of PC from Lymph Nodes Post-SC Injection into the Dorsal Surface of the Rat Footpad
| PC ratio | AUC0–48 h (mg h)/g
|
LPN Ratioa | Cumulative Ratiob | ||||
|---|---|---|---|---|---|---|---|
| LPN | LIgN | LIN | LRN | Cumulative | |||
| 80:20 | 40.18 ± 5.27 | 20.48 ± 1.96 | 5.62 ± 0.71 | 11.05 ± 0.94 | 77.30 ± 8.88 | 1.0* | 1.0* |
| 50:50 | 96.15 ± 1.72 | 97.85 ± 6.11 | 34.63 ± 5.73 | 56.35 ± 4.75 | 284.98 ± 18.31 | 2.4* | 3.7* |
| 20:80 | 187.00 ± 14.18 | 302.90 ± 25.41 | 72.18 ± 8.81 | 215.60 ± 28.31 | 776.68 ± 76.71 | 4.7* | 10.1* |
n = 10; mean ± SEM.
Denotes statistical significance at p < 0.05.
Ratio of LPN AUC0–48 h of PC 80:20 and PC 50:50 to LPN PC 20:80 particles.
Ratio of cumulative AUC0–48 h of PC 80:20 and PC 50:50 to PC 20:80 particles.
LPN uptake and retention of PC particles was also different for the three particle tested (Tab. 5 and Fig. 5). These differences seen in the nodal uptake levels can be directly attributed to differences in surface charge density since the sizes for all three particles are similar (Tab. 1). The uptake of the particles was charge density dependent into LPN with the highest uptake seen for PC 20:80 (most anionic) with an AUC0–48 h 187.00 ± 14.18 followed by PC 50:50 AUC0–48 h 96.15 ± 1.72 and the lowest uptake was for the least anionic particles PC 80:20 at AUC0–48 h 40.18 ± 5.27 (mg h)/g (Tab. 5). A statistically significant increase and retention in LPN of PC 20:80 particles were observed when compared to PC 50:50 particles and PC 80:20 particles. The accumulation of the PC 80:20 particles in the LPN remained the lowest for the entire duration of the study and is statistically significantly different for the first 24 h. Comparison of the AUC values obtained from the LPN, regional node of interest, shows a increasing trend in uptake and retention of PC particles in the order of PC 80:20, then PC 50:50, and then PC 20:80 (Tab. 5 and Fig. 5). Interestingly, the primary node of interest, LPN did not show the greatest accumulation of all particles injected compared to the other nodes. This is different from the PP and PS particles where size and hydrophobicity both resulted in maximal retention into the first set of regional lymph nodes. This difference might indicate that other uptake processes might be occurring simultaneously along with diffusion alone. We speculate that the anionic charge on these particles might trigger macrophage uptake and drainage into the regional lymph nodes is occurring both by diffusion and by intracellular transport with macrophages.
Figure 5.

Comparative left popliteal node (LPN) uptake and retention for PC 80:20, PC 50:50, and PC 20:80 particles from rat footpad; n = 10, mean ± SEM, *indicates statistical significance at a p-value <0.05.
Uptake in LIgN was detected for all the particles following the same trend as seen with LPN. LIgN AUC0–48 h values for PC 20:80, PC 50:50, and PC 80:20 are 302.90 ± 25.41, 97.85 ± 6.11, and 20.48 ± 1.96, respectively. LIN uptake was lower than LPN and LIgN uptake with the same trend. LIN AUC0–48 h values for PC 20:80, PC 50:50, and PC 80:20 are 72.18 ± 8.81, 34.63 ± 5.73, and 5.62 ± 0.71, respectively. LRN for all three particle groups was higher than LIN uptake, but mixed in comparison to LPN and LIgN uptake with the same trend for charge. LRN AUC0–48 h values for PC 20:80, PC 50:50, and PC 80:20 are 215.60 ± 28.31, 56.35 ± 4.75, and 11.05 ± 0.94, respectively. Comparison of the cumulative nodal AUC shows the same trend and LPN is not the primary contributor to the cumulative node uptake. As the surface charge density of the particles increases so do overall lymphatic uptake and lymph node retention, for any given set of particles, in the order of PC 80:20 <PC 50:50 <PC 20:80 with statistically significant difference between all particles compared.
Serum AUC0–48 h levels for PC 80:20, PC 50:50, and PC 20:80 are 4.37 ± 0.48, 20.73 ± 1.62, and 68.93 ± 0.03 (mg h)/mL, respectively (Tab. 6). Serum accumulations for all PC particles were statistically significantly different from each other. The serum uptake trend is similar to the node uptake with the order of serum accumulation being PC 20:80 then PC 50:50 and then PC 20:80 particles. As the anionic charge increases, an increasing number of the particles make it into the vascular compartment. Given the high concentrations present initially, we can once again consider that these particles are moving into the vascular system through the lymphovenous communications along with draining into the subclavian vein through the thoracic lymph duct. The PC 20:80 particles have significantly higher serum levels as compared to PC 50:50 which in turn are statistically significantly higher than PC 80:20 particles. Another possibility for higher serum levels might be transport of these particles into the vascular compartment by macrophages.
Table 6.
AUC0–48 h of PC and PP Particles from Serum and Lymph Nodes Post-SC Injection into the Dorsal Surface of the Rat Footpad
| Particle | Serum AUC0–48 h (mg h)/mL | LPN AUC0–48 h (mg h)/mL | Ratio of LPN AUC0–48 ha | Cumulative node AUC0–48 h (mg h)/g | Ratio of Cumulative Node AUC0–48 ha |
|---|---|---|---|---|---|
| PC 80:20 | 4.37 ± 0.48 | 40.2 ± 5.3 | 0.22* | 77.3 ± 8.9 | 0.27* |
| PC 50:50 | 20.73 ± 1.62 | 96.2 ± 1.7 | 0.54* | 285.0 ± 18.3 | 1.0 |
| PC 20:80 | 68.93 ± 2.61 | 187.0 ± 14.2 | 1.1 | 7776.7 ± 76.7 | 2.7* |
| PP 50 | 6.29 ± 0.03 | 177.7 ± 8.7 | 1.0 | 285.9 ± 15.9 | 1.0 |
n = 10; mean ± SEM.
Denotes statistical significance at p < 0.05.
Ratio of node uptake AUC0–48 h of PC particles to PP 50 particles.
Thus, the overall trend indicates that for similarly sized particles, as the anionic charge density increases, uptake into the lymphatic system also increases. Specifically, nodes distal to the injection site, and even the central vasculature, see much higher levels of these particles (Tab. 6). The LPN and overall nodal AUC values for the three particles were statistically significantly different from each other. This could be possibly due to faster trafficking of these particles from the injection site along with lower overall capture levels for these particles within the node. This idea is based on the fact that each node has a filtering capacity, which increases with increasing particle concentration until a unknown threshold value is reached, after which it decreases. Beyond this threshold value the particles will pass through the node and will be left to be filtered by subsequent nodes.31 Another possibility is that given these are negatively charged particles, macrophages are more active in transporting them into and through the lymphatic system.32 Thus, as the anionic charge increases so does the macrophage uptake. Unfortunately, due to the process by which these particles were recovered we were unable to determine which of these factors predominates.
Comparison of the PC particles with the PP 50 particles provides insight into the role of having a neutral PEG coated particles versus particles carrying anionic charges. Comparison of the PC particles with the neutral PP 50 particles (Tab. 6) shows a differential pattern in lymphatic uptake and node retention. Only the PC 20:80 particles, the highest anionic charge density particles, have similar LPN retention as the PP 50 particles with AUC0–48 h of 187.0 ± 14.2 and 177.7 ± 8.7, respectively. Further comparison of the cumulative AUC ratios of the PC and PP 50 nm particles shows that the PC 80:20 particles primarily accumulate in the LPN. The other PC particles have statistically significantly lower LPN accumulation. This could be due to the fact that at lower ratios of PC particles the zeta potential for these particles is not much higher than for PP particles. However, the PP particles have an added shielding of a PEG coat which might prevent the aggregation of the PP particles, while the PC particles lacking this shield might aggregate at the injection site. Comparing individual node uptake for all the charge particles and PP 50 particles (Tabs. 2 and 5) indicates that charge particles distribute to a greater extent into the lymphatic system as compared to the neutral PP 50 particles. This difference in distribution might be indicative of decreased retention by the nodes due to the higher number of particles trafficking through them or due to a much higher macrophage involvement. The cumulative lymphatic uptake for PC 80:20 particles was statistically significantly lower than PP 50 particles. The PC 50:50 particle uptake is statistically similar to the PP 50 particle with statistically significantly lower LPN levels. Lastly, the PC 20:80 particles have a statistically significantly higher cumulative lymph node uptake with similar LPN levels as the PP 50 particles (Tab. 6).
The work contained here leads to speculation regarding the role of macrophage uptake. Understanding the degree of macrophage involvement is critical to understanding the ability of the carrier to deliver the drug. Speculation has been made regarding the role of the PEG coating for the particles used in the size study in potentially evading macrophage uptake while the charged particles are expected to have extensive uptake. All of this inherently presupposes that different physicochemical properties of the carrier system will lead to different opsonin coatings,32 which in turn, will lead to differential macrophage uptake. Thus the next step is determining what these opsonin coatings are and if they are different for the different carriers. This is key to understanding how the carrier distributes within the lymphatics once they are taken up.
CONCLUSIONS
The lymphatic system is uniquely involved in several disease states and has been shown to be a site of metastasis for tumors. This work has shown that individual properties of size, hydrophobicity and surface charge density all play a significant role in the uptake of particles into the lymphatics for a biodegradable carrier system. We have been able to show that 50 nm PEG particles can work as a regional delivery system while the most anionically charged PC 20:80 particles might be better suited for systemic delivery with high lymphatic concentrations.
Based on our results, the best scaffold for drug delivery to the regional lymphatics might be through PEGylation of particles to provide some stealth like properties to these carriers, while maintaining a delicate balance between surface hydrophilicity and hydrophobicity. This is the same concept utilized in tethering drugs to macromolecules whilst achieving a delicate balance between size and hydrophobicity. This might allow for the localization of these particles into the regional lymph nodes. The 50 nm PLGA particles with a polyethyleneglycol coat have high primary node accumulation with low systemic levels and lower lymphatic levels past the primary node. This type of a carrier system would be ideal for targeting the regional lymph nodes to prevent/treat oligometastases and nanometastases.
Acknowledgments
The authors would kindly like to acknowledge the contribution of Dr. Thomas Stringfellow for generously proving his expertise with NMR. They would also like to thank the School of Pharmacy, University of Wisconsin, Madison for funding.
Abbreviations
- AUC
area under the curve
- DIEA
diisopropylethylamine
- DMF
dimethylformamide
- FL
fluorescence
- FP
footpad
- GPC
gel permeation chromatography
- HIV
human immunodeficiency virus
- LIgN
left inguinal node
- LIN
left ileac node
- LPN
left popliteal node
- LRN
left renal node
- NMR
nuclear magnetic resonance
- PC
PLGA–PMA:PLGA-COOH nanoparticles at various ratios
- PEG-PLA
poly(ethyleneglycol)-b-poly(lactic acid)
- PLGA
poly(lac-tic-co-glycolic) acid
- PLGA-COOH
PLGA with acid end group
- PMA
1-pyrenemethylamine
- PP
PLGA–PMA:PLA-PEG (75:25) nanoparticles
- PS
polystyrene
- RI
refractive index
- THF
tetrahydrofuran
References
- 1.Charman SA, Segrave AM, Edwards GA, Porter CJH. Systemic availability and lymphatic transport of human growth hormone administered by subcutaneous injection. J Pharm Sci. 2000;89:168–177. doi: 10.1002/(SICI)1520-6017(200002)89:2<168::AID-JPS4>3.0.CO;2-Q. [DOI] [PubMed] [Google Scholar]
- 2.Sallustio G, Giangregorio C, Cannas L, Vricella D, Celi G, Rinaldi P. Lymphatic system: Morphofunctional considerations. RAYS. 2000;25:419–427. [PubMed] [Google Scholar]
- 3.Lekkerkerker AN, van Kooyk Y, Geijtenbeek TBH. Viral piracy: HIV-1 targets dendritic cells for transmission. Curr HIV Res. 2006;4:169–176. doi: 10.2174/157016206776055020. [DOI] [PubMed] [Google Scholar]
- 4.Yin F-F, Das S, Kirkpatrick J, Oldham M, Wang Z, Zhou S-M. Physics and imaging for targeting of oligometastases. Semin Radiat Oncol. 2006;16:85–101. doi: 10.1016/j.semradonc.2005.12.004. [DOI] [PubMed] [Google Scholar]
- 5.Querzoli P, Pedriali M, Rinaldi R, Lombardi AR, Biganzoli E, Boracchi P, Ferretti S, Frasson C, Zanella C, Ghisellini S, Ambrogi F, Antolini L, Piantelli M, Iacobelli S, Marubini E, Alberti S, Nenci I. Axillary lymph node nanometastases are prognostic factors for disease-free survival and metastatic relapse in breast cancer patients. Clin Cancer Res. 2006;12:6696–6701. doi: 10.1158/1078-0432.CCR-06-0569. [DOI] [PubMed] [Google Scholar]
- 6.Supersaxo A, Hein WR, Steffen H. Effect of molecular weight on the lymphatic absorption of water-soluble compounds following subcutaneous administration. Pharm Res. 1990;7:167–169. doi: 10.1023/a:1015880819328. [DOI] [PubMed] [Google Scholar]
- 7.Takakura Y, Matsumoto S, Hashida M, Sezaki H. Enhanced lymphatic delivery of mitomycin C conjugated with dextran. Cancer Res. 1984;44:2505–2510. [PubMed] [Google Scholar]
- 8.Hawley AE, Illum L, Davis SS. Lymph node localization of biodegradable nanospheres surface modified with poloxamer and poloxamine block copolymers. FEBS Lett. 1997;400:319–323. doi: 10.1016/s0014-5793(96)01408-1. [DOI] [PubMed] [Google Scholar]
- 9.Takakura Y, Hashida M, Sezaki H. Lymphatic transport after parenteral drug administration. In: Charman WN, Stella VJ, editors. Lymphatic transport of drugs. CRC Press, Inc; Boca Raton, Florida, FL: 1992. pp. 255–278. [Google Scholar]
- 10.Takakura Y, Atsumi R, Hashida M, Sezaki H. Development of a novel polymeric prodrug of mitomycin C, mitomycin C-dextran conjugate with anionic charge. II. Disposition and pharmacokinetics following intravenous and intramuscular administration. Int J Pharm. 1987;37:145–154. [Google Scholar]
- 11.Moghimi SM. Exploitation of macrophage clearance functions in vivo. In: Starke K, Freiburg I, editors. Handbook of Experimental Pharmacology. Vol. 158. Springer Verlag; Berlin Heidelberg, N.Y: 2003. pp. 41–54. Macrophage as Therapeutic Target. [Google Scholar]
- 12.Hawley AE, Illum L, Davis SS. Preparation of biodegradable, surface engineered PLGA nanospheres with enhanced lymphatic drainage and lymph node uptake. Pharm Res. 1997;14:657–661. doi: 10.1023/a:1012117531448. [DOI] [PubMed] [Google Scholar]
- 13.Oussoren C, Storm G. Lymphatic uptake and biodistribution of liposomes after subcutaneous injection: III. Influence of surface modification with poly(ethyleneglycol) Pharm Res. 1997;14:1479–1484. doi: 10.1023/a:1012145410859. [DOI] [PubMed] [Google Scholar]
- 14.Oussoren C, Zuidema J, Crommelin DJA, Storm G. Lymphatic uptake and biodistribution of liposomes after subcutaneous injection: II. Influence of liposomal size, lipid composition and lipid dose. Biochim Biophys Acta. 1997;1328:261–272. doi: 10.1016/s0005-2736(97)00122-3. [DOI] [PubMed] [Google Scholar]
- 15.Kiss E, Vargha-Butler EI. XPS and wettability characterization of modified poly(lactic acid) and poly(lactic/glycolic acid) films. J Colloid Interface Sci. 2002;245:91–98. doi: 10.1006/jcis.2001.7954. [DOI] [PubMed] [Google Scholar]
- 16.Narrainen AP, Hutchings LR, Ansari IA, Clarke N, Thompson RL. Novel multi end-functionalised polymers. Additives to modify polymer properties at surfaces and interfaces. Soft Matter. 2006;2:126–128. doi: 10.1039/b516439g. [DOI] [PubMed] [Google Scholar]
- 17.Weissenboeck A, Bogner E, Wirth M, Gabor F. Binding and uptake of wheat germ agglutinin-grafted PLGA-nanospheres by caco-2 monolayers. Pharm Res. 2004;21:1917–1923. doi: 10.1023/b:pham.0000045247.09724.26. [DOI] [PubMed] [Google Scholar]
- 18.Oster CG, Wittmar M, Unger F, Barbu-Tudoran L, Schaper AK, Kissel T. Design of amine-modified graft polyesters for effective gene delivery using DNA-loaded nanoparticles. Pharm Res. 2004;21:927–931. doi: 10.1023/b:pham.0000029279.50733.55. [DOI] [PubMed] [Google Scholar]
- 19.Nimura N, Kinoshita T, Yoshida T, Uetake A, Nakai C. 1-Pyrenyldiazomethane as a fluorescent labeling reagent for liquid chromatographic determination of carboxylic acids. Anal Chem. 1988;60:2067–2070. doi: 10.1021/ac00170a017. [DOI] [PubMed] [Google Scholar]
- 20.Horisawa E, Kubota K, Tuboi I, Sato K, Yamamoto H, Takeuchi H, Kawashima Y. Size-dependency of DL-lactide/glycolide copolymer particulates for intra-articular delivery system on phagocytosis in rat synovium. Pharm Res. 2002;19:132–139. doi: 10.1023/a:1014260513728. [DOI] [PubMed] [Google Scholar]
- 21.Bucsiova L, Hrdlovic P, Chmela S. Spectral characteristics of fluorescence probes based on pyrene in solution and in polymer matrix. J Photochem Photobiol A Chem. 2001;143:59–68. [Google Scholar]
- 22.Patel HM, Tuzel NS, Ryman BE. Inhibitory effect of cholesterol on the uptake of liposomes by liver and spleen. Biochim Biophys Acta. 1983;761:142–151. doi: 10.1016/0304-4165(83)90223-4. [DOI] [PubMed] [Google Scholar]
- 23.Wallis KH, Muller RH. Comparative measurements of nanoparticle degradation velocity using an accelerated hydrolysis test. Pharm Ind. 1993;55:168–170. [Google Scholar]
- 24.Van Oosterhout MF, Willigers HM, Reneman RS, Prinzen FW. Fluorescent microspheres to measure organ perfusion: Validation of a simplified sample processing technique. Am J Physiol. 1995;269:H725–H733. doi: 10.1152/ajpheart.1995.269.2.H725. [DOI] [PubMed] [Google Scholar]
- 25.Hausberger AG, DeLuca PP. Characterization of biodegradable poly(D,L-lactide-co-glycolide) polymers and microspheres. J Pharm Biomed Anal. 1995;13:747–760. doi: 10.1016/0731-7085(95)01276-q. [DOI] [PubMed] [Google Scholar]
- 26.Kiremitci-Gumusderelioglu M, Deniz G. Synthesis, characterization and in vitro degradation of poly(dl-lactide)/poly(dl-lactide-co-glycolide) films. Turk J Chem. 1999;23:153–161. [Google Scholar]
- 27.Dong C-M, Qiu K-Y, Gu Z-W, Feng X-D. Synthesis of poly(D,L-lactic acid-alt-glycolic acid) from D,L-3-methylglycolide. J Polym Sci A Polym Chem. 2000;38:4179–4184. [Google Scholar]
- 28.Panyam J, Dali MM, Sahoo SK, Ma W, Chakravarthi SS, Amidon GL, Levy RJ, Labhasetwar V. Polymer degradation and in vitro release of a model protein from poly(d,l-lactide-co-glycolide) nano- and microparticles. J Control Release. 2003;92:173–187. doi: 10.1016/s0168-3659(03)00328-6. [DOI] [PubMed] [Google Scholar]
- 29.Dunne M, Corrigan OI, Ramtoola Z. Influence of particle size and dissolution conditions on the degradation properties of polylactide-co-glycolide particles. Biomaterials. 2000;21:1659–1668. doi: 10.1016/s0142-9612(00)00040-5. [DOI] [PubMed] [Google Scholar]
- 30.Oussoren C, Storm G. Liposomes to target the lymphatics by subcutaneous administration. Adv Drug Deliv Rev. 2001;50:143–156. doi: 10.1016/s0169-409x(01)00154-5. [DOI] [PubMed] [Google Scholar]
- 31.Olszewski W. Peripheral lymph: Formation and immune function. Boca Raton, Florida: CRC Press; 1985. [Google Scholar]
- 32.Cox PH. The kinetics of macromolecule transport in lymph and colloid accumulation in lymph nodes. In: Cox PH, editor. Progress in radiopharmacology. Amsterdam; Elsevier: 1981. pp. 267–292. [Google Scholar]