

With a trans–human skull porcine model, this study demonstrated the feasibility of blood-brain barrier opening with the 230-kHz focused ultrasound system in preparation for a clinical trial.
Abstract
Purpose
To develop and test a protocol in preparation for a clinical trial on opening the blood-brain barrier (BBB) with magnetic resonance (MR) imaging–guided focused ultrasound for the delivery of chemotherapy drugs to brain tumors.
Materials and Methods
The procedures were approved by the institutional animal care committee. A trans–human skull porcine model was designed for the preclinical testing. Wide craniotomies were applied in 11 pigs (weight, approximately 15 kg). A partial human skull was positioned over the animal’s brain. A modified clinical MR imaging–guided focused ultrasound brain system was used with a 3.0-T MR unit. The ultrasound beam was steered during sonications over a 3 × 3 grid at 3-mm spacing. Acoustic power levels of 3–20 W were tested. Bolus injections of microbubbles at 4 μL/kg were tested for each sonication. Levels of BBB opening, hemorrhage, and cavitation signal were measured with MR imaging, histologic examination, and cavitation receivers, respectively. A cavitation safety algorithm was developed on the basis of logistic regression of the measurements and tested to minimize the risk of hemorrhage.
Results
BBB openings of approximately 1 cm3 in volume were visualized with gadolinium-enhanced MR imaging after sonication at an acoustic power of approximately 5 W. Gross examination of histologic specimens helped confirm Evans blue (bound to macromolecule albumin) extravasation, and hematoxylin-eosin staining helped detect only scattered extravasation of red blood cells. In cases where cavitation signals were higher than thresholds, sonications were terminated immediately without causing hemorrhage.
Conclusion
With a trans–human skull porcine model, this study demonstrated BBB opening with a 230-kHz system in preparation for a clinical trial.
© RSNA, 2016
Introduction
Opening of the blood-brain barrier (BBB) with focused ultrasound with microbubbles has been demonstrated in many small-animal models (1–4) and nonhuman primates (5). Therapeutic agents can be delivered to localized targets during a time window of reversible BBB opening lasting a few hours (6–8). Technical aspects of this technique have been investigated in animal models by using an assortment of frequencies (9–11), pulses (12–15), pressure levels (16), and microbubble sizes and/or doses (17–19). The properties of cavitation signals have also been investigated as a means for treatment monitoring and control (20–24). In preparation for a clinical trial, however, ultrasound parameters must be optimized according to properties of the human skull and capabilities of a clinical prototype device. More important, the cavitation level indicative of successful BBB opening must be calibrated as a feedback control for acoustic power levels. In addition, a cavitation threshold–based safety mechanism must be developed and tested in vivo to minimize the risk of hemorrhage. To address these requirements, we performed this study to develop and test a BBB opening protocol in a trans–human skull porcine model.
Materials and Methods
Animal and Experiment Setup
The procedures were approved by the institutional animal care committee and performed between May 2013 and September 2014. Wide craniotomies were performed in 11 porcine subjects (weight, approximately 15 kg) by two neurosurgeons (R.A. and M.L.S, with 9 and 42 years of experience in neurosurgery, respectively). The scalp hair was removed with clippers, followed by chemical depilation. The skin was closed and the surgical site filled with degassed saline. A partial human skull was positioned over the porcine’s brain (Fig 1). The focused ultrasound system (ExAblate 4000, 230 kHz; InSightec, Haifa, Israel) was integrated with a 3.0-T magnetic resonance (MR) imaging unit (Signa MR750; GE Healthcare, Milwaukee, Wis). The hemispheric focused ultrasound array consisted of 1024 individually controllable transducer elements (phase and amplitude of the radiofrequency signal) and was positioned horizontally (facing up) with a customized positioner. The animal was positioned supine, with the head and transducer coupled with degassed water. General anesthesia was induced and maintained with isoflurane (approximately 2%) and medical air (2 L/min). Peripheral cardiac pulses were monitored throughout the experiment with a pulse oximeter integrated with the MR imaging system for adjusting the isoflurane levels.
Figure 1a:

Animal setup. (a) Sagittal MR image shows partial human skull positioned over pig’s brain. Hemispherical focused ultrasound (FUS) array was positioned horizontally and filled with degassed water. (b) Axial MR image shows cavity between animal’s brain and scalp filled with degassed saline. White arrows indicate ends of porcine skull after wide craniotomy.
Figure 1b:

Animal setup. (a) Sagittal MR image shows partial human skull positioned over pig’s brain. Hemispherical focused ultrasound (FUS) array was positioned horizontally and filled with degassed water. (b) Axial MR image shows cavity between animal’s brain and scalp filled with degassed saline. White arrows indicate ends of porcine skull after wide craniotomy.
The pig’s brain was positioned close to the center of the ex vivo human skull. Because the volume of the porcine brain (approximately 5 × 7 × 3 cm3) is much smaller than that of the human brain (approximately 15 × 20 × 10 cm3), the sonicated targets in porcine brain were all close to the center of the human skull (6–7 cm from outer table of the human skull). Two layers of depth were targeted: two to four spots at the layer superior to the ventricle in the cortex and two to four spots inferior to the ventricle. The intention was to fit as many targets as possible in the limited volume of the porcine brain. However, relative to the human skull, these targets were at similar depths (<1 cm difference). Because there was limited spatial freedom to position the human skull over the pig’s head, targeting at substantially different locations relative to the human skull was not tested with this animal model. For targets at substantially different locations in the human brain, the required acoustic power to produce a similar acoustic pressure would be different. The assumption was that by using the received cavitation signals as a feedback of ultrasound-microbubble interactions under a certain acoustic pressure level, power levels could be adjusted accordingly to produce similar pressure levels at any arbitrary target.
Focused Ultrasound Parameters
The sonication sequence was designed within the constraints of the focused ultrasound system hardware. The BBB opening volume with the natural focus of the hemispherical array at 230 kHz is about 3 mm in diameter (5). To enlarge the treatment volume, the ultrasound beam was steered during sonications over a 3 × 3 grid of nine spots at 3.0-mm spacing. The spatial coverage of the nine-spot grid was therefore close to 1 cm in width. For each spot, 2 msec on, 28 msec off pulses were repeated for 300 msec before steering to the next spot. One cycle for nine spots was therefore 2.7 seconds. The overall pulse repetition frequency for each spot was 2 msec/30 msec × 0.3 second/2.7 second = 0.74%. Total sonication time was 50 seconds. Acoustic power levels from 3 to 20 W were tested. A power range of 3–10 W was expected to induce successful BBB opening, whereas higher power levels between 10 and 20 W were intended to exceed the cavitation threshold to test the safety mechanism for preventing significant hemorrhage. On the basis of a previous hydrophone measurement with the ex vivo human skull, the acoustic pressure level at the focus was estimated as 500 kPa at 5 W (the fiberoptic hydrophone was calibrated from 1 to 10 MHz and the data were linearly extrapolated down to 230 kHz). It is important to note that the end point of this study was not to find an optimal power level for BBB opening. The power levels used herein were only based on this specific animal-skull setup. For patient treatments, although the power level is expected to be at the same order of magnitude as in this trans–human skull model, substantial variability is expected owing to differences in location and skull properties. The assumption is that the cavitation signal is relatively consistent at the pressure level for BBB opening and therefore can be used as feedback to adjust the power level for a specific target.
Microbubbles
The maximum dose of the microbubble contrast agent Definity (Lantheus Medical Imaging, North Billerica, Mass) is 20 μL/kg in humans, as recommended by the manufacturer. As multiple sonications with stepwise changes in power are anticipated in human treatments to find the appropriate power level for a specific patient, both one-tenth (2 μL/kg) and one-fifth (4 μL/kg) of the maximum dose were tested for each sonication, which would allow for 10 and five injections, respectively, within the total dose limit. A bolus injection through an intravenous line in the animal’s leg was simultaneously delivered with the initiation of MR thermometry imaging of the sonication. Because two phases of baseline images were acquired before the initiation of the acoustic power, the injection was initiated approximately 7 seconds before the power was on. It was determined in early studies that it took an average of 15 seconds for the microbubble bolus to reach the brain; therefore, the sonications began on average 8 seconds before the first-pass microbubble bolus arrived at the target. Microbubble doses of 2 µL/kg were tested at 14 spots in the first four animals at 3–5 W but showed inconsistent BBB openings and cavitation feedback; therefore, this dose was abandoned. All other sonications were performed with a dose of 4 μL/kg.
Cavitation Monitoring
Cavitation signals were recorded by two receiver elements in the array. The cavitation safety algorithm was a weighted average of the two channels. Data sampling of cavitation signals was synchronized to 2-msec pulses and sampled at 2 MHz (4000 samples). The receivers were calibrated by sonicating degassed water (<1 ppm of dissolved oxygen) at high power levels.
Spectrum integration from 75 to 155 kHz (subharmonic at 115 kHz ± 40) was calculated and two threshold levels of the spectrum integration were defined in the safety algorithm. Initially, on the basis of preliminary in vivo data from earlier animal studies, a lower threshold level of 0.15 (normalized number) was defined for 30 consecutive samples; that is, if 30 consecutive spectrum integrations of 2-msec pulses were all higher than 0.15, the sonication was terminated. A higher threshold level of 0.20 was defined for three consecutive samples; that is, if three consecutive spectrum integrations of 2-msec pulses were all above 0.20, the sonication was terminated. In addition, two corresponding baseline threshold levels (0.03 and 0.04, respectively) were defined for measurements of the baseline noise in the spectrum integration before ultrasound power was turned on. The goal of thresholding was to avoid extravasation of red blood cells (RBCs) beyond 500 µm in accumulated diameter.
MR Imaging
Treatments were performed with a 3.0-T MR unit by a physicist (Y.H., with 16 years of experience in MR imaging). T2-weighted fast spin-echo images (repetition time msec/echo time msec, 3000/70) were acquired in three orthogonal axes and transferred to the focused ultrasound system for targeting. Previously acquired computed tomographic images of the human skull were registered to the T2-weighted MR images for phase corrections. MR thermometry (gradient-echo sequence, 27.6/12.8; temporal resolution, 3.5 seconds) was performed during sonications, although no temperature elevation was expected at these power levels. After sonications, gadolinium-enhanced (Gadovist, 0.1 mL/kg; Bayer, Toronto, Ontario, Canada) fast spin-echo T1-weighted images (500/24) were acquired to verify the BBB opening. T2*-weighted gradient-echo images (echo time, 15 msec) were acquired to detect hemorrhage. Images were acquired with a body coil. To improve image quality for posttreatment assessments, the animals were transferred to a conventional MR imaging table and T1- and T2*-weighted images were repeated with an eight-channel head coil. The interval between imaging with the body coil and imaging with the head coil was about 20 minutes for system setup and animal repositioning.
Histologic Examination
After MR imaging, Evans blue dye (2%, 2 mL/kg) was injected intravenously before transcardial perfusion. The brains were removed and dissected for postmortem histologic examination. Slices (5 µm thick, 1 mm spacing) were stained with hematoxylin-eosin (H-E) for the evaluation of hemorrhage and tissue damage. All sonicated locations were evaluated at histologic examination.
Statistical Analysis
Logistic regression was performed (Matlab; Mathworks, Natick, Mass) by using hemorrhage levels from histologic examination as the dependent variable and cavitation levels of corresponding sonications as the independent variable to establish finer cavitation thresholds for limiting the risk of hemorrhage. If accumulations of extravasated RBCs larger than 500 µm in diameter were discovered at histologic examination, the maximum cavitation level of the corresponding sonication was considered to cause hemorrhage (hemorrhage level = 1). Otherwise the cavitation level was considered to not cause hemorrhage (hemorrhage level = 0). Regressions were performed on cavitation levels on the basis of three, 10, and 30 consecutive cavitation samples. Deviances of the fits were tested with the χ2 test as a measure of evaluating the goodness of the fit. Cavitation levels with 50% probability of hemorrhage in the regressions were chosen as new thresholds. Experiments were repeated after new thresholds were applied to verify the effectiveness of new thresholds for limiting hemorrhage.
Results
In total, 48 sonications at various power levels were applied. Three categories of results were established from this study: the minimum microbubble dose and power level, the cavitation level indicative of successful BBB opening, and the cavitation threshold for preventing hemorrhage.
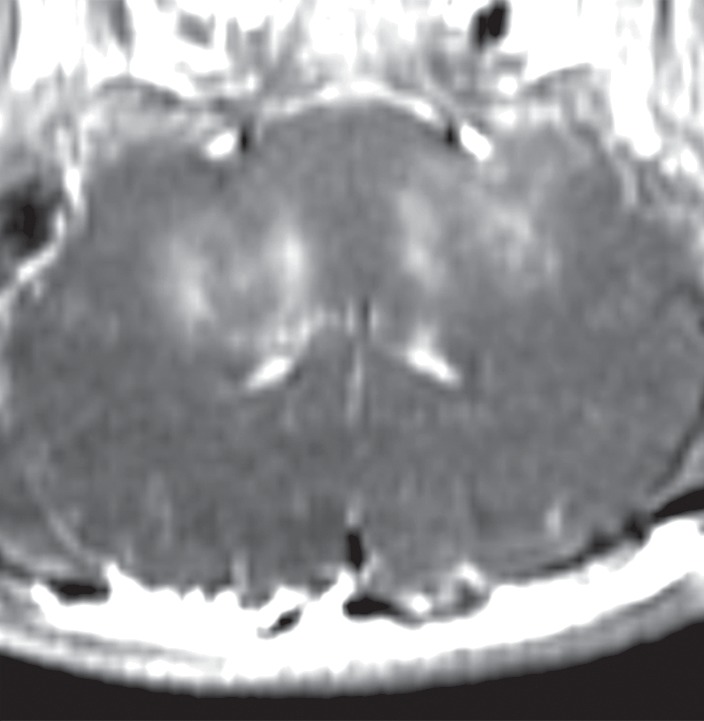
Initial tests showed that 4 μL/kg Definity is the minimum dose for generating consistent BBB openings, whereas the power level showed variability among targets but on average was at 5 W (see Figs E1 and E2 [online] for initial testing results). Sonications at 5 W with 4 µL/kg Definity were then tested at 13 locations in seven animals to examine the reproducibility of BBB openings and the consistency of cavitation signal levels. Successful BBB opening and comparable cavitation signals were observed at all 13 locations. In one animal with four sonications at 5 W, with 4 µL/kg Definity, clear patterns of the 3 × 3 grid were observed at each location on the axial and coronal images (Fig 2a, 2b). No obvious hemorrhage was observed on the T2*-weighted image (Fig 2c). In H-E stained sections, no hemorrhage larger than 500 µm was detected (Fig 2d). In cutting blocks of the brain (Fig E3 [online]), the pattern of Evans blue extravasation (bound to albumin, which is approximately 65 000 Da) was in agreement with that seen on gadolinium-enhanced MR images. Cavitation spectrum integration of the four sonications (Fig 3) was at comparable levels (<0.10). With repeatable results, 5 W and 4 µL/kg microbubbles were considered standard parameters for this BBB opening protocol.
Figure 2a:
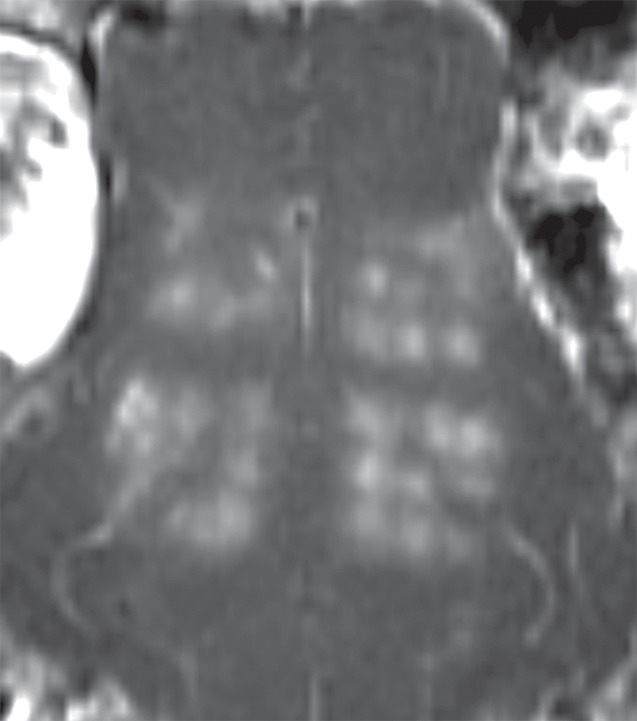
BBB opening at four locations with 5 W with 4 µL /kg microbubbles. (a, b) Gadolinium-enhanced T1-weighted images in coronal (a) and axial (b) views. (c) T2*-weighted image depicts no hemorrhage in sonicated volumes. (d) Photomicrograph (H-E stain) shows no extravasation of RBCs larger than 500 µm.
Figure 2b:
BBB opening at four locations with 5 W with 4 µL /kg microbubbles. (a, b) Gadolinium-enhanced T1-weighted images in coronal (a) and axial (b) views. (c) T2*-weighted image depicts no hemorrhage in sonicated volumes. (d) Photomicrograph (H-E stain) shows no extravasation of RBCs larger than 500 µm.
Figure 2c:
BBB opening at four locations with 5 W with 4 µL /kg microbubbles. (a, b) Gadolinium-enhanced T1-weighted images in coronal (a) and axial (b) views. (c) T2*-weighted image depicts no hemorrhage in sonicated volumes. (d) Photomicrograph (H-E stain) shows no extravasation of RBCs larger than 500 µm.
Figure 2d:
BBB opening at four locations with 5 W with 4 µL /kg microbubbles. (a, b) Gadolinium-enhanced T1-weighted images in coronal (a) and axial (b) views. (c) T2*-weighted image depicts no hemorrhage in sonicated volumes. (d) Photomicrograph (H-E stain) shows no extravasation of RBCs larger than 500 µm.
Figure 3a:

Cavitation spectrum integrations (normalized scores vs time) of four sonications as in Figure 2 were at comparable levels (<0.10, indicated by dotted line). Green and yellow curves are two different weighted averages of the two cavitation receivers.
Figure 3b:

Cavitation spectrum integrations (normalized scores vs time) of four sonications as in Figure 2 were at comparable levels (<0.10, indicated by dotted line). Green and yellow curves are two different weighted averages of the two cavitation receivers.
Figure 3c:

Cavitation spectrum integrations (normalized scores vs time) of four sonications as in Figure 2 were at comparable levels (<0.10, indicated by dotted line). Green and yellow curves are two different weighted averages of the two cavitation receivers.
Figure 3d:

Cavitation spectrum integrations (normalized scores vs time) of four sonications as in Figure 2 were at comparable levels (<0.10, indicated by dotted line). Green and yellow curves are two different weighted averages of the two cavitation receivers.
Acoustic powers were varied from 3 to 20 W with 4 µL/kg microbubbles at 19 locations in five animals to test cavitation safety thresholds according to the levels of extravasation of RBCs at histologic examination. Hemorrhages larger than 500 µm were discovered at seven locations at 4–10 W. Logistic regression (Fig E4 [online]) showed a cavitation level of 0.10 at 50% probability of hemorrhage on the basis of three consecutive samples (P < .005, χ2 test), a cavitation level of 0.08 on the basis of 10 consecutive samples (P < .005), and a cavitation level of 0.06 on the basis of 30 consecutive samples (P > .05). Because the goodness of fit with 10 consecutive samples was significantly better than that with 30 consecutive samples, new thresholds were established as 0.10 on three consecutive samples and 0.08 on 10 consecutive samples. Eight sonications were performed after the implementation of the new thresholds. Two sonications were terminated. At location 1 in Figure 4a, sonication at 5 W was terminated at 12 seconds (Fig 4b), about 6 seconds after microbubbles reached the target based on the cavitation signals. There was slight gadolinium enhancement at this location despite the early termination. At location 2, sonication at 5 W was uninterrupted (Fig 4d) and clear gadolinium enhancement was seen at this location (Fig 4a). No hemorrhage larger than 500 µm was found at any of the eight locations. However, low levels of sporadic RBC extravasations were detected in the sonicated volume (Fig 5). This degree of RBC extravasation (10–200 µm) was considered safe in the periphery of tumors.
Figure 4a:

Two sonications at 5 W and with 4 µL /kg microbubbles with lowered thresholds. (a) Gadolinium-enhanced T1-weighted MR image. Loc = location. (b) Spectrum integration obtained at location 1. Sonication was terminated at 12 seconds. (c) Photomicrograph (H-E stain) shows no obvious extravasation of RBCs larger than 500 µm. (d) Spectrum integration obtained at location 2. Sonication went through uninterrupted.
Figure 4b:

Two sonications at 5 W and with 4 µL /kg microbubbles with lowered thresholds. (a) Gadolinium-enhanced T1-weighted MR image. Loc = location. (b) Spectrum integration obtained at location 1. Sonication was terminated at 12 seconds. (c) Photomicrograph (H-E stain) shows no obvious extravasation of RBCs larger than 500 µm. (d) Spectrum integration obtained at location 2. Sonication went through uninterrupted.
Figure 4d:

Two sonications at 5 W and with 4 µL /kg microbubbles with lowered thresholds. (a) Gadolinium-enhanced T1-weighted MR image. Loc = location. (b) Spectrum integration obtained at location 1. Sonication was terminated at 12 seconds. (c) Photomicrograph (H-E stain) shows no obvious extravasation of RBCs larger than 500 µm. (d) Spectrum integration obtained at location 2. Sonication went through uninterrupted.
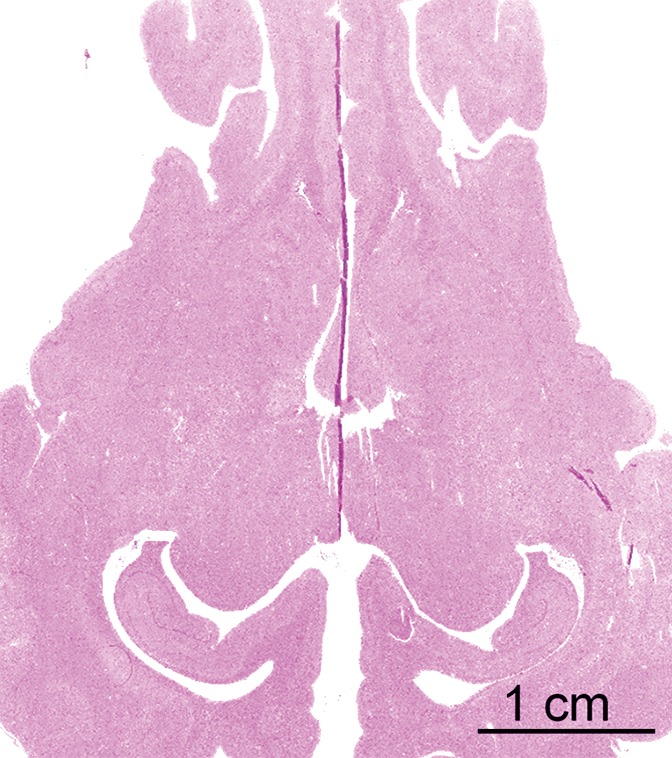
Figure 5a:
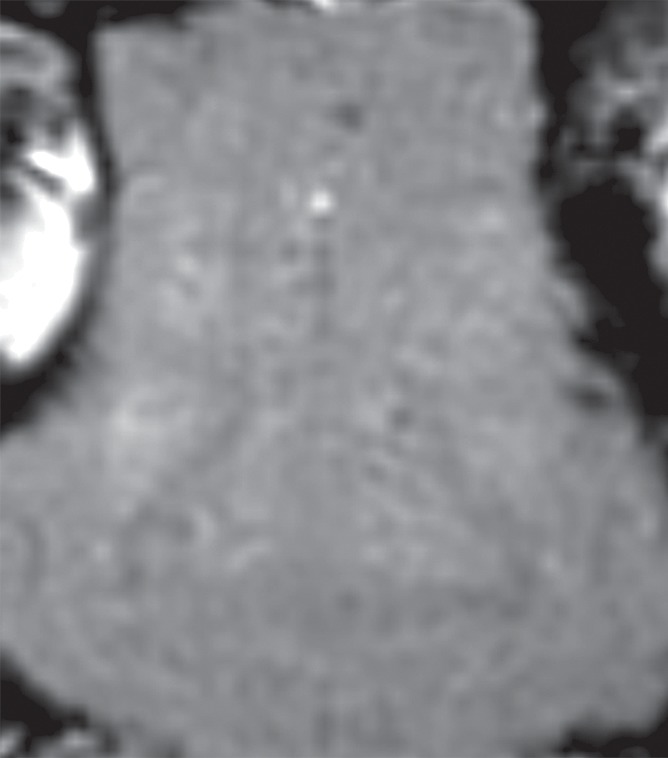
(a) Gadolinium-enhanced T1-weighted MR image and (b) photomicrograph (H-E stain) after successful BBB opening at 5 W and with 4 µL /kg microbubbles. Circles with diameters of 3 mm illustrate the 3 × 3 steering grid of the sonication. Sporadic RBC extravasations were on the scale of 10–200 µm.
Figure 4c:

Two sonications at 5 W and with 4 µL /kg microbubbles with lowered thresholds. (a) Gadolinium-enhanced T1-weighted MR image. Loc = location. (b) Spectrum integration obtained at location 1. Sonication was terminated at 12 seconds. (c) Photomicrograph (H-E stain) shows no obvious extravasation of RBCs larger than 500 µm. (d) Spectrum integration obtained at location 2. Sonication went through uninterrupted.
Figure 5b:
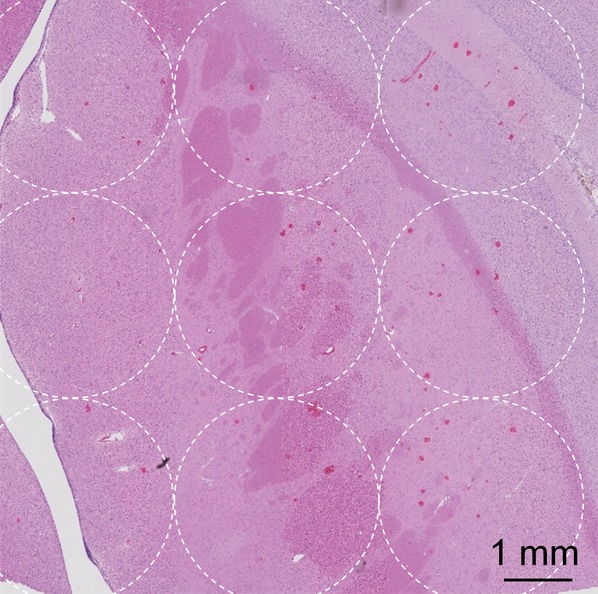
(a) Gadolinium-enhanced T1-weighted MR image and (b) photomicrograph (H-E stain) after successful BBB opening at 5 W and with 4 µL /kg microbubbles. Circles with diameters of 3 mm illustrate the 3 × 3 steering grid of the sonication. Sporadic RBC extravasations were on the scale of 10–200 µm.
Discussion
In this study we showed that, on the basis of a trans–human skull porcine model, the minimum microbubble dose to produce consistent BBB opening and cavitation feedback was 4 μL/kg. With 4 µL/kg, five injections can be performed to find the proper power level for BBB opening within the maximum dose on the Definity label of 20 µL/kg. Without a closed loop feedback to control power levels in real time on the clinical focused ultrasound system, the ability to perform multiple injections at lower doses is crucial to find the proper power level for a specific target. It is not clear if a dose higher than 20 µL/kg can be used in patients with adequate time provided for microbubble clearance. No literature was found for repeated administrations of Definity at a dose higher than 20 µL/kg in humans. However, animal studies of BBB openings have all been performed with repeated boluses at 10–20 µL/kg or higher, each at a minimum of 5-minute intervals, without serious adverse events (1–24). The dose of 20 µL/kg is the limit for diagnostic clinical use, but it may be acceptable to use higher doses of the contrast agent in the treatment of malignant brain tumors. Nonetheless, within the current dose limit of 20 µL/kg, 4 µL/kg provides the flexibility of performing five injections for the initial transition to a clinical study.
The current cavitation algorithm uses a broadband spectrum integration between 75 and 155 kHz, which was designed for the measurement of inertial cavitation signals. The cavitation spectrum fluctuated owing to the perfusion of microbubbles in circulation. The peak of the spectrum signal was often around the half harmonics at 115 kHz but also drifted randomly across the spectrum. Spectrum integrations of various bandwidths, including a narrow band around 115 kHz, were investigated but no significant difference was found in their performance. This demonstrated that, in the current study, cavitation signals were broadband in nature.
MR temperature feedback plays an important role in high-intensity focused ultrasound thermal ablations for brain diseases (25–31). With the temperature feedback from MR thermometry, the power level can be adjusted accordingly to compensate for the variability of skull shape and/or density, tissue perfusion rate, and steering of the ultrasound beam without knowing the exact acoustic intensity at the focal target. The cavitation signal was used here as feedback in a similar way as MR thermometry in thermal ablation, assuming that the cavitation signal reflected microbubble activity under certain pressure levels. The cavitation signal was a spectrum integration around subharmonic from 75 to 155 kHz, which was at a lower frequency that was less affected by the skull.
A limitation of the study was that the location of the two cavitation receivers relative to the targets was similar among all sonications owing to the fixed animal-skull setup. The effect of the distance and/or angle from receivers to targets was not investigated. A recent hardware upgrade has added six more receivers at various geometric locations. However, the cavitation control algorithm has not included the new receivers. This is expected to be implemented in the future.
In conclusion, with a trans–human skull porcine model, this study demonstrated the feasibility of BBB opening with the 230-kHz ExAblate system in preparation for a clinical trial. Acoustic pulses, power levels, and microbubble dose were optimized for effective BBB opening. Cavitation safety thresholds were tested and shown to minimize the level of RBC extravasation and tissue damage. These results indicate that the 230-kHz Exablate 4000 system could be used for the pilot clinical testing of focused ultrasound–induced BBB opening for drug delivery to the brain.
Advances in Knowledge
■ At 230 kHz, a blood-brain barrier (BBB) opening was achieved with transcranial focused ultrasound at approximately 5 W of acoustic power with a bolus injection of microbubbles at 4 μL/kg.
■ With electronic steering of the focused ultrasound beam, the volume of the BBB opening was enlarged to approximately 1 cm3 with a single sonication.
■ Cavitation signals at the subharmonic spectrum (mean, 115 kHz ± 40) were detected transcranially at consistent levels as feedback to adjust power levels; cavitation levels and hemorrhage levels from histologic examination were analyzed by means of logistic regression (P < .005) to establish cavitation thresholds for limiting the risk of hemorrhage.
Implication for Patient Care
■ MR imaging–guided focused ultrasound at 230 kHz could be feasible to induce BBB openings transcranially in patients for delivery of macromolecule drugs to the brain.
SUPPLEMENTAL FIGURES
Acknowledgments
Acknowledgments
The authors thank InSightec for providing the software modifications for the sonication execution and the acoustic emission monitoring, Omer Brokman, MSc, from InSightec for his technical support, and Shawna Rideout, RLAT, RVT, and Alexandra Garces, RVT, for their expertise in animal experiments.
Received September 30, 2015; revision requested December 8; revision received March 3, 2016; accepted March 10; final version accepted May 10.
Supported by National Institutes of Health (grant R01-EB003268) and the Canada Research Chairs Program.
Disclosures of Conflicts of Interest: Y.H. disclosed no relevant relationships. R.A. disclosed no relevant relationships. M.L.S. disclosed no relevant relationships. K.H. Activities related to the present article: disclosed no relevant relationships. Activities not related to the present article: disclosed no relevant relationships. Other relationships: has patents issued.
Abbreviations:
- BBB
- blood-brain barrier
- H-E
- hematoxylin-eosin
- RBC
- red blood cell
References
- 1.Hynynen K, McDannold N, Vykhodtseva N, Jolesz FA. Noninvasive MR imaging–guided focal opening of the blood-brain barrier in rabbits. Radiology 2001;220(3):640–646. [DOI] [PubMed] [Google Scholar]
- 2.McDannold N, Vykhodtseva N, Raymond S, Jolesz FA, Hynynen K. MRI-guided targeted blood-brain barrier disruption with focused ultrasound: histological findings in rabbits. Ultrasound Med Biol 2005;31(11):1527–1537. [DOI] [PubMed] [Google Scholar]
- 3.Choi JJ, Pernot M, Small SA, Konofagou EE. Noninvasive, transcranial and localized opening of the blood-brain barrier using focused ultrasound in mice. Ultrasound Med Biol 2007;33(1):95–104. [DOI] [PubMed] [Google Scholar]
- 4.O’Reilly MA, Huang Y, Hynynen K. The impact of standing wave effects on transcranial focused ultrasound disruption of the blood-brain barrier in a rat model. Phys Med Biol 2010;55(18):5251–5267. [DOI] [PMC free article] [PubMed] [Google Scholar]
- 5.McDannold N, Arvanitis CD, Vykhodtseva N, Livingstone MS. Temporary disruption of the blood-brain barrier by use of ultrasound and microbubbles: safety and efficacy evaluation in rhesus macaques. Cancer Res 2012;72(14):3652–3663. [DOI] [PMC free article] [PubMed] [Google Scholar]
- 6.Kinoshita M, McDannold N, Jolesz FA, Hynynen K. Noninvasive localized delivery of Herceptin to the mouse brain by MRI-guided focused ultrasound-induced blood-brain barrier disruption. Proc Natl Acad Sci U S A 2006;103(31):11719–11723. [DOI] [PMC free article] [PubMed] [Google Scholar]
- 7.Treat LH, McDannold N, Vykhodtseva N, Zhang Y, Tam K, Hynynen K. Targeted delivery of doxorubicin to the rat brain at therapeutic levels using MRI-guided focused ultrasound. Int J Cancer 2007;121(4):901–907. [DOI] [PubMed] [Google Scholar]
- 8.Liu HL, Hua MY, Chen PY, et al. Blood-brain barrier disruption with focused ultrasound enhances delivery of chemotherapeutic drugs for glioblastoma treatment. Radiology 2010;255(2):415–425. [DOI] [PubMed] [Google Scholar]
- 9.Hynynen K, McDannold N, Sheikov NA, Jolesz FA, Vykhodtseva N. Local and reversible blood-brain barrier disruption by noninvasive focused ultrasound at frequencies suitable for trans-skull sonications. Neuroimage 2005;24(1):12–20. [DOI] [PubMed] [Google Scholar]
- 10.Hynynen K, McDannold N, Vykhodtseva N, et al. Focal disruption of the blood-brain barrier due to 260-kHz ultrasound bursts: a method for molecular imaging and targeted drug delivery. J Neurosurg 2006;105(3):445–454. [DOI] [PubMed] [Google Scholar]
- 11.Liu HL, Chen HW, Kuo ZH, Huang WC. Design and experimental evaluations of a low-frequency hemispherical ultrasound phased-array system for transcranial blood-brain barrier disruption. IEEE Trans Biomed Eng 2008;55(10):2407–2416. [DOI] [PubMed] [Google Scholar]
- 12.Hynynen K, McDannold N, Martin H, Jolesz FA, Vykhodtseva N. The threshold for brain damage in rabbits induced by bursts of ultrasound in the presence of an ultrasound contrast agent (Optison). Ultrasound Med Biol 2003;29(3):473–481. [DOI] [PubMed] [Google Scholar]
- 13.Bing KF, Howles GP, Qi Y, Palmeri ML, Nightingale KR. Blood-brain barrier (BBB) disruption using a diagnostic ultrasound scanner and Definity in mice. Ultrasound Med Biol 2009;35(8):1298–1308. [DOI] [PMC free article] [PubMed] [Google Scholar]
- 14.O’Reilly MA, Waspe AC, Ganguly M, Hynynen K. Focused-ultrasound disruption of the blood-brain barrier using closely-timed short pulses: influence of sonication parameters and injection rate. Ultrasound Med Biol 2011;37(4):587–594. [DOI] [PMC free article] [PubMed] [Google Scholar]
- 15.Choi JJ, Selert K, Gao Z, Samiotaki G, Baseri B, Konofagou EE. Noninvasive and localized blood-brain barrier disruption using focused ultrasound can be achieved at short pulse lengths and low pulse repetition frequencies. J Cereb Blood Flow Metab 2011;31(2):725–737. [DOI] [PMC free article] [PubMed] [Google Scholar]
- 16.McDannold N, Vykhodtseva N, Hynynen K. Blood-brain barrier disruption induced by focused ultrasound and circulating preformed microbubbles appears to be characterized by the mechanical index. Ultrasound Med Biol 2008;34(5):834–840. [DOI] [PMC free article] [PubMed] [Google Scholar]
- 17.McDannold N, Vykhodtseva N, Hynynen K. Use of ultrasound pulses combined with Definity for targeted blood-brain barrier disruption: a feasibility study. Ultrasound Med Biol 2007;33(4):584–590. [DOI] [PMC free article] [PubMed] [Google Scholar]
- 18.McDannold N, Vykhodtseva N, Hynynen K. Effects of acoustic parameters and ultrasound contrast agent dose on focused-ultrasound induced blood-brain barrier disruption. Ultrasound Med Biol 2008;34(6):930–937. [DOI] [PMC free article] [PubMed] [Google Scholar]
- 19.Choi JJ, Feshitan JA, Baseri B, et al. Microbubble-size dependence of focused ultrasound-induced blood-brain barrier opening in mice in vivo. IEEE Trans Biomed Eng 2010;57(1):145–154. [DOI] [PMC free article] [PubMed] [Google Scholar]
- 20.McDannold N, Vykhodtseva N, Hynynen K. Targeted disruption of the blood-brain barrier with focused ultrasound: association with cavitation activity. Phys Med Biol 2006;51(4):793–807. [DOI] [PubMed] [Google Scholar]
- 21.Tung YS, Vlachos F, Choi JJ, Deffieux T, Selert K, Konofagou EE. In vivo transcranial cavitation threshold detection during ultrasound-induced blood-brain barrier opening in mice. Phys Med Biol 2010;55(20):6141–6155. [DOI] [PMC free article] [PubMed] [Google Scholar]
- 22.O’Reilly MA, Hynynen K. Blood-brain barrier: real-time feedback-controlled focused ultrasound disruption by using an acoustic emissions-based controller. Radiology 2012;263(1):96–106. [DOI] [PMC free article] [PubMed] [Google Scholar]
- 23.Arvanitis CD, Livingstone MS, Vykhodtseva N, McDannold N. Controlled ultrasound-induced blood-brain barrier disruption using passive acoustic emissions monitoring. PLoS One 2012;7(9):e45783. [DOI] [PMC free article] [PubMed] [Google Scholar]
- 24.Arvanitis CD, Livingstone MS, McDannold N. Combined ultrasound and MR imaging to guide focused ultrasound therapies in the brain. Phys Med Biol 2013;58(14):4749–4761. [DOI] [PMC free article] [PubMed] [Google Scholar]
- 25.Martin E, Jeanmonod D, Morel A, Zadicario E, Werner B. High-intensity focused ultrasound for noninvasive functional neurosurgery. Ann Neurol 2009;66(6):858–861. [DOI] [PubMed] [Google Scholar]
- 26.McDannold N, Clement GT, Black P, Jolesz F, Hynynen K. Transcranial magnetic resonance imaging–guided focused ultrasound surgery of brain tumors: initial findings in 3 patients. Neurosurgery 2010;66(2):323–332; discussion 332. [DOI] [PMC free article] [PubMed] [Google Scholar]
- 27.Coluccia D, Fandino J, Schwyzer L, et al. First noninvasive thermal ablation of a brain tumor with MR-guided focused ultrasound. J Ther Ultrasound 2014;2:17. [DOI] [PMC free article] [PubMed] [Google Scholar]
- 28.Lipsman N, Schwartz ML, Huang Y, et al. MR-guided focused ultrasound thalamotomy for essential tremor: a proof-of-concept study. Lancet Neurol 2013;12(5):462–468. [DOI] [PubMed] [Google Scholar]
- 29.Elias WJ, Huss D, Voss T, et al. A pilot study of focused ultrasound thalamotomy for essential tremor. N Engl J Med 2013;369(7):640–648. [DOI] [PubMed] [Google Scholar]
- 30.Chang WS, Jung HH, Kweon EJ, Zadicario E, Rachmilevitch I, Chang JW. Unilateral magnetic resonance guided focused ultrasound thalamotomy for essential tremor: practices and clinicoradiological outcomes. J Neurol Neurosurg Psychiatry 2015;86(3):257–264. [DOI] [PubMed] [Google Scholar]
- 31.Jung HH, Chang WS, Rachmilevitch I, Tlusty T, Zadicario E, Chang JW. Different magnetic resonance imaging patterns after transcranial magnetic resonance–guided focused ultrasound of the ventral intermediate nucleus of the thalamus and anterior limb of the internal capsule in patients with essential tremor or obsessive-compulsive disorder. J Neurosurg 2015;122(1):162–168. [DOI] [PubMed] [Google Scholar]
Associated Data
This section collects any data citations, data availability statements, or supplementary materials included in this article.