Figure 6.
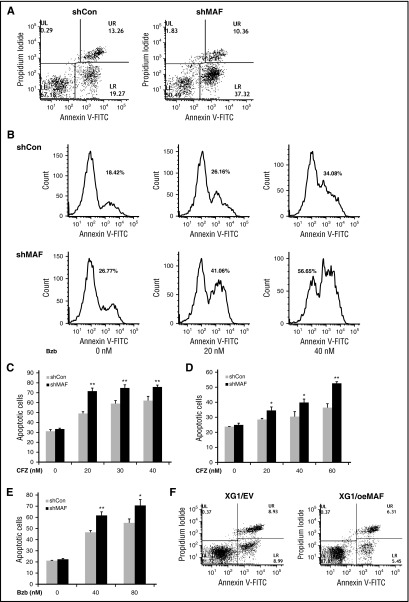
MAF protein prevents MM cells from PI-induced apoptosis. 8226/shCon (left) or 8226/shMAF (right) cells were treated with 30 nM Bzb for 16 hours, and then stained using Annexin V–FITC and propidium iodide and apoptotic cell numbers determined by flow cytometry analysis. The lower right (LR) area represents early apoptotic cells (Annexin V–FITC positive), the upper right (UR) area represents late apoptotic and/or necrotic cells (Annexin V–FITC and propidium iodide positive); the lower left area represents viable cells (unstained) (A). Apoptotic cell numbers in 8226/shCon or 8226 shMAF treated with indicated serial concentrations of Bzb for 16 hours were determined by Annexin V–FITC and propidium iodide staining and flow cytometry analysis. The data are shown by histogram analysis (B). The percentages of apoptotic cells in the presence of increasing concentrations of CFZ were determined by the same methods. Data are representative of 3 separate experiments. **P < .001 shMaF vs shCon. (C). Cells were cocultured with BM stromal cells and treated with indicated concentrations of CFZ (D) or Bzb (E) and apoptotic cells were analyzed as described in the description of panel A. Data are representative of 3 separate experiments. *P < .01 or **P < .001 shMAF vs shCon. XG1EV and XG1OeMAF cells were treated with 20 nM Bzb for 16 hours and apoptotic cells measured by Annexin V–FITC and PI staining, and flow cytometry analysis as described in the description of panel A (F).

