

Abstract
Key performance indicators (KPIs) are important to managing any sustainable business. This tutorial provides audiologists, especially those with little formal business education, with a working definition of KPIs. A major theme of this article is that a relatively small group of about a dozen KPIs are an essential part of managing a successful audiology practice. The most useful KPIs for managing retail-oriented and medically oriented practices will be provided. Best practice benchmarks and how to use them to hire, coach, and train your staff also is covered.
Keywords: Key performance indicators, benchmarks, conversion rate, practice management, office culture, gross margin, net revenue, hearing aid units sold, average selling price, effective management
Learning Outcomes: As a result of this activity, the participant will be able (1) to select a group of KPIs that help improve and sustain an audiology practice; (2) to list the needed KPIs to manage an audiology practice using KPIs and benchmarking data.
Pick up the sports section of the newspaper (or, better yet, open the ESPN app on your smartphone) and check the box score of a baseball game between the Chicago Cubs and Milwaukee Brewers. Even though the Brewers won, you might notice three Cubs had multiple hits in the game and their starting pitcher gave up only two hits over the entire nine-inning game. Upon a closer reading of the box score, however, you see the starting pitcher also had two wild pitches and the shortstop had two errors. What the box score did not tell you was these four miscues occurred in the same inning and directly lead to the Cubs' defeat in the final inning of play. You really needed to be at the game or watching on TV to appreciate the intensity of the action as the game unfolded in that final frame. The magnitude of the human errors that lead to the dramatic downfall of the Cubs simply could not be captured by the box score. This baseball analogy shows the advantages and limitations of using numbers and statistics (in baseball the box score is used to summarize many of these stats) to capture performance. The baseball box score is an example of how key performance indicators (KPIs) can provide valuable insight into activity and results, but when these activities and results are viewed from afar, they do not tell the complete story of the performance of individuals and teams.
You do not have to be a baseball manager or even a fan to appreciate how numbers can be used to evaluate performance. The objective of this article is to show how KPIs can be used to better manage your practice. In simple terms, like a baseball box score or your new car's dashboard, KPIs are nothing more than a set of numbers used to evaluate the activity, behaviors, and performance of individuals working within your practice. After all, no matter how sophisticated your business, when properly utilized, KPIs are a proven approach to providing better patient outcomes, maintaining your best staff, generating more revenue, and being more profitable. Rather than making rash, gut-level decisions about your practice, a targeted set of KPIs allow you to make rational decisions about your practice. Decisions based on facts. The use of KPIs in the decision-making process leads to less chaos and better results. Ultimately, however, success in your business still boils down to the human element—someone, usually a manager, deciding what KPIs to measure and how to use those measurements to guide the day-to-day operations of the practice. From this standpoint, even though a group of numbers (i.e., KPIs) may seem dry and boring to many, they summarize the crucial activity in your practice.
As previously stated, key performance indicators are very similar to the stats you see in the box score the morning after the baseball game. The box score, like the one shown in Fig. 1, provides you with important insights about who played well and who did not. Once you are familiar with what the numbers mean (if you are a baseball fan, you are quite familiar with all the jargon within the box score), you simply glance at them and you quickly surmise what happened in the game you missed. However, as will be discussed in this article, there are important limitations of KPIs that must be considered. People, usually managers of the practice, must chose the set of KPIs that provide them with the most actionable information. Furthermore, managers must be able to quickly evaluate KPI data, trust that it is representative of daily activity, and use it to guide their decision-making. There is a process to establishing and using KPI data that will be covered in this article. This process is often referred to as data-driven decision-making. Most of us would agree that making decisions about your practice, like what model of hearing aids to dispense and what prices to charge are critical to long-term success; the real challenge, however, is choosing a group of KPIs that will help us make those decisions and then effectively coaxing better performance from our staff.
Figure 1.
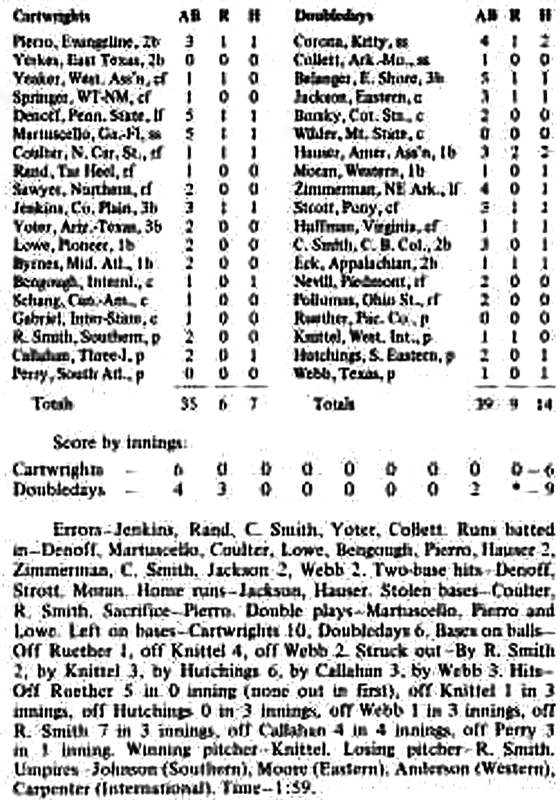
An example of a baseball box score.
In addition to choosing a set of KPIs that will enable you to operate a more efficient practice, managers must be aware of the possibility of overrelying on KPI data. For example, you will find managers who like to spend inordinate amounts of time analyzing their KPIs. (In reality, you are probably more likely to see managers who do not pay any attention to KPIs.) With the advances in low-cost, high-capacity computers, it has never been easier to generate data about the operations of a practice. This can lead to paralysis through analysis, an easy thing to do when there are so many variables to measure. After all, with today's computers, dozens of metrics (KPIs) can be obtained, often in real time. Even though many practices are awash in this sea of data, effective management of people is still critical to long-term success. This article will focus on why the human elements of managing people within a business complements the specific KPIs you decide to measure. In other words, how you use KPIs to manage your staff is more important than the exact KPIs you measure. Yes, KPIs are important, but an effective manager selects the KPIs that provide the most salient information about the goals of the practice and manages the people in the practice to better meet and exceed those KPIs.
Before going any further, let us stop and discuss the importance of efficiency. You may have noticed in the previous paragraph the term operate a more efficient practice. It is important to have clarity about this term. Today, audiologists, especially those in private practice face much competition. Big-box retail stores, large integrated medical centers, and even the Internet are all existing business models that compete head-to-head with private practice audiologists. They are formidable competitors because many of these upstart challengers are more efficient than private practice audiology. In this context, efficiency simply means they get more done with fewer resources. In other words, they can maximize their profit by reducing their costs, relative to a private practitioner. For example, large retail chains and other big corporate entities have more buying power. They can easily use their economies of scale (i.e., dozens, if not hundreds of locations) to command a very low wholesale price for hearing aids that they resell. Other large entities might have a recognizable brand that allows them to greatly reduce the need to rely on costly advertising to bring customers to their stores. Buying power and brand recognition are two variables that allow large players to operate more efficiently.
The question for the private practitioner though is, how can you get more done with less, especially when it is difficult, perhaps even impossible, to compete head-to-head on wholesale price and brand recognition? The answer to this question rests with offering consumers with hearing loss and communication difficulties value. Creating value and doing it efficiently require differentiation of your professional services. For the private practitioner the path to greater profits rests with the ability to do more with fewer resources. KPIs, as this article hopes to demonstrate, are simply the instruments needed to ensure this goal is met. It is the responsibility of the manager to establish the KPIs needed to accomplish the goal of doing more with fewer resources. Some of the dimensions of more and less that could be applied to the private practice are summarized in Table 1. The key to profitability is maximizing the more category, while reducing the less category. You do not need to have a formal degree in business to understand this definition of efficiency, as long as you select and manage the right set of KPIs, you can do more with less.
Table 1. Doing More with Fewer Resources is a Simple Definition of Efficiency. Profit is Maximized when Efficiency is High.
| Do More of this: • Increase patient satisfaction • Optimize revenue per hour per staff person • Improve repeat sales from existing customers • Increase referrals from existing patients • Find the right treatment for each patient at their first visit • Improved patient benefit from their treatment |
| While you do less of this: • Unnecessary follow-up visits with patients • Time conducting unnecessary tests and procedures • Hire and retain ineffective staff that doesn't have a direct impact on patient satisfaction or revenue • Time spent trying to attract unqualified patients who aren't good candidates for services |
Because KPIs help a practice define and measure progress toward their goals, it makes sense to spend some time discussing goals. As most professionals know a goal is a specific, measureable, actionable, realistic, and time-bound statement of what a practice expects to accomplish. Because a practice needs to cultivate satisfied patients and the revenue that comes from them, most goals (and their accompanying KPIs) are focused on two variables: patient satisfaction and revenue. If you want to learn more about developing your own set of goals, there are several sources of information where you would find details on writing goals; just know that goals are the foundation of the KPIs you will measure and manage. KPIs are needed to gauge progress toward your goals. It simply does not make sense to measure KPIs without first establishing some clear goals for your practice.
Perhaps more fundamental than goals is vision. Vision is best defined as the owner's or manager's aspirations for the practice. A simple way to arrive at a vision is to ask yourself, within the next 5 to 10 years, what do you want your practice to be known for? Taking the time to ponder this question and conjure some concrete answers to the question will help you discover a clear, aspirational vision for your practice. Along with having a vision, a healthy culture among your staff is essential. The ability to set goals as well as the ability to develop and manage KPIs effectively does not exist in a vacuum. Practices that have taken the time to foster a culture of trust and accountability are more likely to effectively utilize KPIs. In simple terms, there is a distinct hierarchy of attributes that successful practices seem to have in common. This hierarchy, shown in Fig. 2, is culture, goals, and KPIs. Key performance indicators are simply not very useful if a practice fails to get the vision, culture, and goals aligned with them. Stated differently, KPIs measure the why of your practice, and effective managers and staff provide the how of improving the KPIs.
Figure 2.
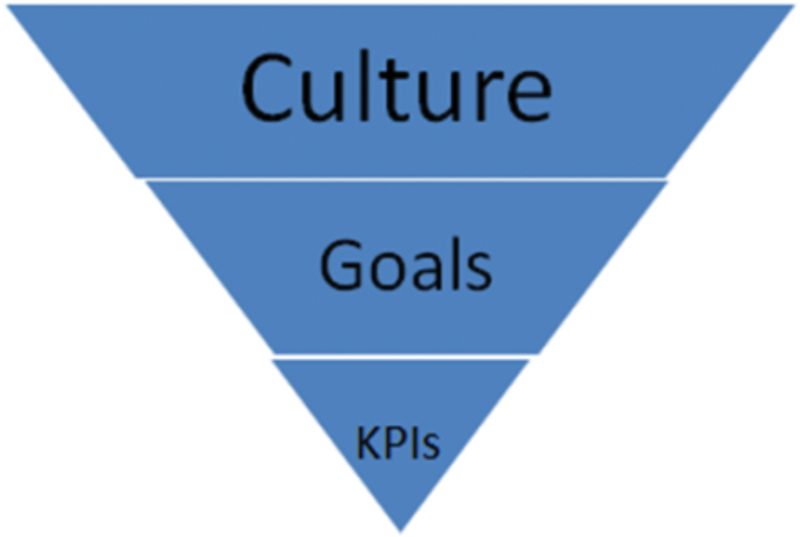
The hierarchy of practice success. Abbreviation: KPIs, key performance indicators.
At some point in your career, you may have worked in an office where people did not get along or the staff talked negatively about the manager. In a culture where a critical member of the staff feels like a bean counter or feels like just another cog in the wheel can be nothing more than drudgery. This problem can be exacerbated by managers who manically focus on KPIs without consideration of the feelings and emotions of the staff. Every office has a culture and without solid interpersonal relationships among the staff, an office culture can be nonproductive, negative, and even downright hostile. The daily work environment in your clinic and the way in which individuals interact and relate to one another in this environment are essential components of any sustainable business. The quality of the work environment and the relationship among the staff are perhaps even more important in health care businesses where staff is expected to interact with patients and talk about personal matters with patients. Personal matters staff must have familiarity and comfort with discussing long-term emotional consequences of hearing loss, emerging cognitive difficulties that make daily living more challenging, or out-of-pocket payment for services. These workaday tasks require a high level of interpersonal communication among staff. Thus, the foundation of effective communication between staff is culture. In straightforward terms, your office culture is defined by the quality of these day-to-day interactions, and it is primarily up to the practice manager and other leaders within the organization to define your culture.
Key Performance Indicators: Garbage IN, Garbage Out
Now that we have taken a deep dive into some of the underlying drivers of KPIs, take a closer look at the ins and outs of creating your own list of key performance indicators. When we talk about performance in an office, what we really mean are the series of behaviors or tasks completed by the staff in their daily work. In other words, behaviors and tasks conducted by the staff equate to performance. Ultimately, that performance equates to results. A KPI is the metric you use to evaluate the most critical elements of that performance.
The KPIs you will focus on stem directly from your goals. For an audiology practice there are two main categories of KPIs. First, the practice needs to set financial or operational goals. Financial goals involve looking at revenue and profitability over a specific period of time. Without revenue and profit a practice cannot hope to sustain itself over time, thus financial goals are critical. Most financial KPIs are a yardstick for measuring some derivative of revenue and profitability. Because the provision of hearing aids is such an integral part of revenue generation in most practices, it is common that many KPIs involve them. For example, the most common KPIs usually include some variation of average selling price (ASP), units sold, and opportunities to dispense products. Other KPIs consider patients (appointment per day or revenue per patient visit) as a number and could be considered financial or operational in nature.
Patients, as all of us know, are certainly more than a number, thus other KPIs are needed. A second set of goals and their accompanying KPIs can be created by measuring the patient's experience in your practice. These are sometimes known as quality KPIs. Given the importance of word-of-mouth referrals being driven by highly satisfied patients, it is critical for a practice to set a few goals and create some KPIs around overall patient satisfaction, patient benefit from your treatment, and the patient's willingness to refer other patients to your practice. Because revenue and profit are the foundation of maintaining a business, this tutorial will focus on financial KPIs, but many of the principles can be applied to quality KPIs.
There are two other categories of KPIs. One set of KPIs can be used to measure your internal business processes. For example, the average wait time for patients, when (and how much) you get reimbursed by third-party payers, and return for credit rates are business process KPIs. For example, if your practice generates even modest amounts of revenue from insurance billing, you will want to have at least one KPI that measures the time it takes to get reimbursed after you have submitted a claim to the insurance company for payment. Finally, another set of KPIs can be devised to measure employee attitude and behavior. Think back to the earlier discussion of office culture. Key performance indicators such as staff turnover and employee satisfaction are useful, especially in larger practices with more than a dozen employees.
Whatever KPIs you decide to measure, it is imperative that the data you are evaluating is accurate. This starts with having a computer-based office management system that can store the data you enter into it. There are several computer-based office management systems (e.g., Sycle.net, San Francisco, CA and Blueprint Solutions, Eden Prarie, MN) that are relatively inexpensive because they use cloud computing. Further, a computerized office management system allows you to easily run KPI reports in various formats, such as dashboards, bar charts, and line graphs. Dashboards, like the ones shown in Figs. 3A and 3B, are useful for observing several KPIs in a snapshot format. For example, you could have six to eight financial, operational, and patient quality KPIs on one screen that you observe each day. Bar charts and line graphs, which comprise much of a dashboard, on the other hand, are helpful for evaluating trends in the KPI data over time. Month-to-month or year-over-year data can be quickly analyzed when viewed in this format. Regardless of the specific office management system you use or the type of KPI reporting format that works best for you, the integrity of the data—how it is collected and entered into the office management system is of paramount importance. If you are relying on data to make decisions about the daily operation of your practice, it is incumbent upon staff to establish a replicable routine for collecting and entering it. Before you become overwhelmed with creating dashboards and their accompanying charts and graphs, remember that the creators of these computerized systems, along with business consultants will help you set up your own dashboard.
Figure 3.
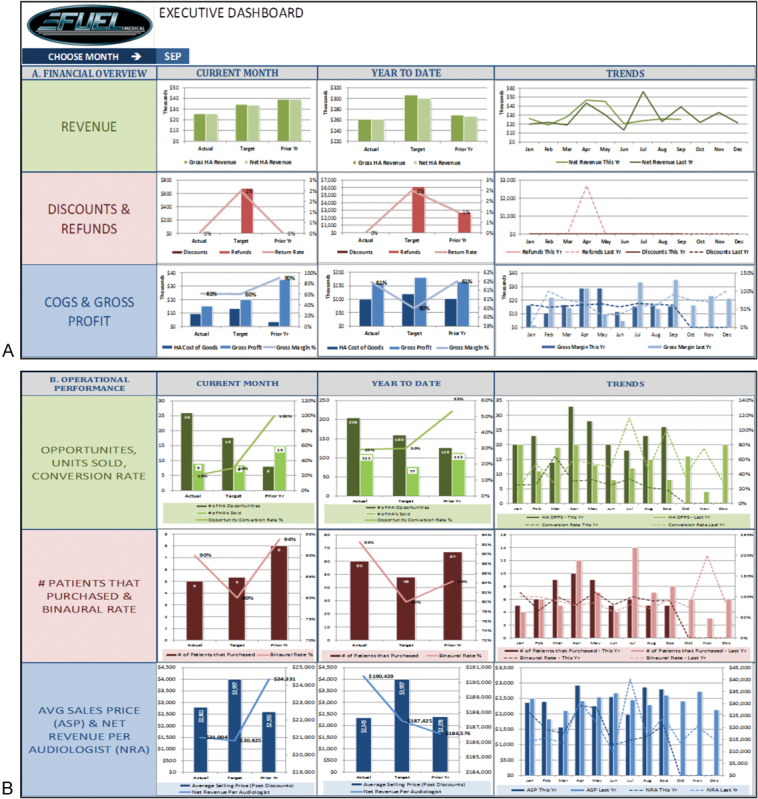
(A) Financial key performance indicators (KPIs) summarized in an executive dashboard. Reprinted with permission of Fuel Medical Group (Camas, Washington) (B) Operational hearing aid KPIs summarized in an executive dashboard. Reprinted with permission of Fuel Medical Group, Camas, Washington.
Another important consideration is the use of leading and lagging KPIs. An effective manager will utilize both. Most KPIs measured in an audiology practice are lagging KPIs. They tell us about what has already happened in a practice. When a sale has been booked—that is, a patient has paid for a pair of hearing aids—all of the financial KPIs generated from that sale are lagging KPIs. Leading KPIs, on the other hand, are an indicator of future activity. Many marketing KPIs are leading indicators because they give you some advance knowledge of future sales. Say that your marketing KPIs, such as number of new appointments booked are very low one month, this is a leading indicator that revenue will be low the following month or two. Leading KPIs help us predict future results. Another leading KPI is conversion rate, which is number of sales relative to hearing aid opportunities. A low number here is a leading indicator that sales the following month will be low. The lesson is that managers need to vigilantly watch leading KPIs. By taking action to improve them quickly, lagging financial KPIs, which tell us what actually happened to profits and revenue, can be improved.
General Rules About Productivity
No matter what type of practice you manage, where it is located, or the type of patients you see, there are three general rules of productivity that will help you develop and manage your own KPIs. At the end of the day, no matter how many KPIs you decide to measure, there are just three ways to improve the amount of revenue generated in a practice. The first is to bring more patients into the practice. Increasing the number of opportunities—seeing more patients—will lead to more revenue. This driver of productivity is largely a function of marketing and networking. The second is to sell more hearing aids. Every patient you evaluate that is ready to use amplification and does not have an existing medical problem needs to purchase hearing aids from you. This is directly related to how well clinical staff can navigate the consultative selling process. Finally, the third variable contributing directly to increasing revenue is dispensing more hearing aids at higher selling prices. Of course, it is important that patients experience the value of higher priced models; no one is suggesting selling products to patients who do not want or need them, but as a general rule, revenue will increase when more premium hearing aids are sold. As a corollary to hearing aid ASP, productivity also can be improved by focusing on the wholesale cost or gross margin of each unit. We will address the relationship between average retail price, gross margin, and product mix later in this article. The bottom line is that when you focus on each of the three drivers of productivity and use KPIs to measure them you will be more successful.
The Executive Dashboard
Do not feel alone if all this discussion of business metrics is overwhelming and maybe even a little boring. Most audiologists did not invest thousands of dollars into their education to then turn around and spend a lot of time examining business metrics. That is okay because there are many computerized tools and consultants available to make it quick and easy. Many practices do not have the time or tools to manually track, analyze, and interpret the key drivers of their business. Computers make it very efficient to capture a lot of information. Figs. 3A and 3B show a relatively simple executive dashboard with data gathered from a clinic's office management system and converted into a meaningful set of metrics for comparison against current targets, historical performance, and best practice benchmarks. Notice in Fig. 3A that critical financial information (revenue, discounts and refunds, and cost-of-goods and gross profits) is measured. Those monthly numbers are compared with a target and also compared with the same time for the prior year. In addition, the all-important trend line allows you to quickly compare this year's data to the same period last year. Many experienced managers will tell you that watching a falling trend line is a strong indicator that aggressive action needs to be taken. For example, if revenue is down more than 10% from last year at this time, the practice needs to execute a plan that will result in more immediate revenue generating opportunities. The KPIs alert us to the need for immediate action, but it is managers and staff who must execute the plan.
Fig. 3B from the executive dashboard looks more closely at KPIs directly related to hearing aid sales. Conversation rate, binaural rate, revenue per audiologist, and average sales price are shown in one graph with current results compared to a target (benchmark) and the previous year. Again, a quick glance at the trend line indicates when more immediate action is needed. Managers must get into a rhythm of evaluating the executive dashboard on at least a weekly basis.
The Critical Key Performance Indicators
Once a practice manager has established a routine for collecting and entering data into an office management system, it is imperative to identify a handful of KPIs that can be evaluated on a daily or weekly basis. The specific KPIs that you measure and evaluate depend not only on your goals, but also on the type of practice that you manage. In simple terms there are two general types of audiology practices: retail oriented and medically oriented. At the risk of oversimplifying, retail oriented practices rely more heavily on the bulk of their revenue being generated through the sale of hearing aids, whereas the medically oriented (e.g., ear, nose, and throat [ENT]) practice typically generates more revenue through billing for testing. As a general rule, a medically oriented practice will generate ∼70% of their revenue from the sale of hearing aids and a retail oriented practice will generate ∼90% of their revenue with hearing aid sales.
For both retail and medical practices, hearing aid sales (and the services connected with them) are a significant portion of overall revenue. Therefore, there are three overarching KPIs that need to be routinely measured: hearing aid revenue, hearing aid volume, and hearing aid gross profit. For each of the three hearing aid KPIs, there are several derivatives of each and they are listed below. Although there is a lot of chatter about personal sound amplification products (PSAPs) and other types of direct-to-consumer amplification products, the traditional hearing aid remains the standard bearer of revenue generation for audiologists. Thus, it needs to have its own set of KPIs. Below is a list of critical hearing aid KPIs, including several derivatives of the three major ones.
-
Hearing aid revenue
Average sale price: the average retail price per hearing aid sold before discounts (gross hearing aid revenue divided by total units)
Revenue by provider
Revenue by department
Binaural rate
-
Hearing aid volume: the number of hearing aid units sold over a finite time period
Units by provider
Units by practice
Conversion rate (number of devices sold relative to opportunities, expressed as a ratio or percentage)
Unit return percentage
-
Hearing aid gross profit: the percentage of gross revenue from hearing aids dispensed
Gross profit percentage
Gross profit per unit
Cost of goods percentage
Cost per unit
Gross profit by provider
When creating your list of KPIs, it is important to understand the relationship between each of the three broad hearing aid KPI categories: gross profit, volume, and revenue. For example, say gross profit and revenue is at 100% of target while volume lags behind at 70% of target. This constellation of numbers is likely going to require the practice to focus on boosting consultative selling skills to capitalize on converting more opportunities into hearing aid wearers. On the other hand, if volume is at 100% and gross profit and revenue are below target, this set of numbers suggests that the practice's price strategy needs to be carefully evaluated. Perhaps the practice needs to negotiate a better cost of goods with their vendors or examine their retail pricing structure. Without these three KPIs it would be difficult to know what to target. Fig. 4 shows several important KPIs from one practice and how they compare with benchmark data. The pattern on the spidergram pinpoints areas in need of improvement.
Figure 4.
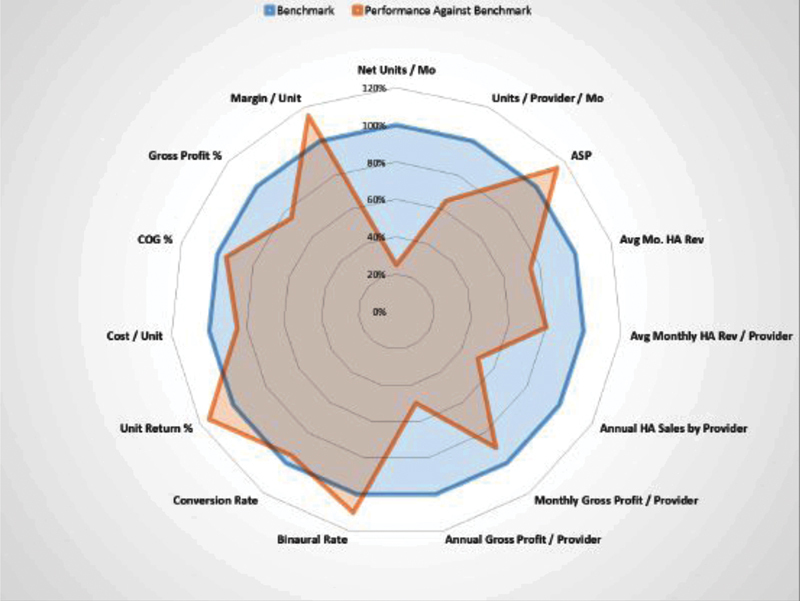
A spidergram comparing benchmark to actual performance data. Abbreviations: ASP, average selling price; COG, cost of goods; HA, hearing aid.
Five Important Financial and Operational Key Performance Indicators
Let us take a deeper dive into benchmarking five universally important KPIs. You do not have to have an MBA or even to have taken a business course in college to appreciate the power of data-driven decision-making using KPIs. It is, however, important to know how a few KPIs are defined and what a reasonable target (benchmark) would be. Here are five critical financial and operational KPIs that you need to know, no matter what type of audiology practice you operate. Note that the benchmarking numbers used below are for a medically oriented audiology practice and were derived from consultants at the Fuel Medical Group.
-
Gross hearing aid revenue as a percentage of gross revenue
Definition: the percentage of gross revenue that hearing aid revenue comprises in a practice.
Industry average benchmark: 90% when audiology diagnostics are billed outside the hearing center. This number can be reduced to 70% if you are in a practice that does a lot of billing for diagnostics.
Best practice benchmark: 70% or 90% depending on diagnostic billing policies.
Why it is measured: hearing aid revenue has much higher revenue per clinical hour than follow-up service and ancillary product sales. If the non–hearing aid revenue percentage is more than 10% of total revenue less diagnostic revenue, it could indicate an opportunity to convert some of the service and ancillary revenue into hearing instrument revenue.
If metric is above 90%: this could indicate you are missing some battery, assistive listening device (ALD), and extended service plan revenue. If the office has a mix of dispensing and ancillary service revenues, evaluate what brings the most profitability and focus on maximizing those activities.
If metric is below 70%: this possibly suggests that the business is focusing too much of its time on low revenue generating activities, like repairs, battery sales, and ALD sales. Staff also may be too busy with diagnostics to allow sufficient time for hearing aid dispensing. Blocking specific slots in the schedule for hearing device consultations and front office staff training on sales opportunity identification also should be considered.
-
Gross margin percentage of net hearing aid revenue
Definition: the percentage of profit (i.e., margin) made on the sale of a hearing aid (a. Net hearing aid sales less hearing aid cost of goods = gross margin. b. gross margin ÷ net hearing aid sales = gross margin percentage).
Industry average benchmark: 59%.
Best practice benchmark: 65%.
Why it is measured: most likely a low ASP will translate into a low gross profit percentage. Remember that all of the daily operational expenses from personnel to rent to office supplies are funded from what is left over in gross margin. If this metric is less than 59%, chances are good after all of the expenses are paid, the business may be operating at a loss. As this metric approaches 60 to 65%, as long as there are strong cost control protocols in place and overall volume is strong, the business should be very profitable.
If metric is above 65%: as long as volume is acceptable, no action is needed. If hearing aid volume is too low (less than 15 to 20 units per month, per full-time audiologist), it could be an indication that pricing is too high.
If metric is below 59%: this could be an indication of a low-end product mix, low retail pricing, discounting, and high cost of goods or a combination of all four.
-
Average patient net revenue
Definition: the overall average net revenue per patient that the office captures.
Industry average benchmark: $2,960.
Best practice benchmark: $4,240.
Why it is measured: this metric reinforces the fiscal value each potential patient represents. This metric is also an indication of the practice's ASP and binaural rates, as each of those metrics directly impact the average net revenue per patient.
If metric is below $2,960: Try to improve both binaural rate and ASP. Most likely one or both of these metrics are low. Implement tools to increase those metrics and average patient net revenue will increase.
-
Conversion rate percentage
Definition: an audiologist's ability to gain an agreement from a patient to purchase hearing aids.
Industry average benchmark: 51%.
Best practice benchmark: 67%.
Why it is measured: this is a great measurement for forecasting sales in the practice. In other words, this is a leading KPI. It tells you how many opportunities are needed to generate a specific amount of hearing aid sales. It also can be a good measure of the provider's dispensing and counseling skills. It is very important to have a consistent description of what defines an opportunity. If you define an opportunity as a hearing aid evaluation appointment, the benchmark needs to be closer to 60%. If you use hearing tests as opportunities then the optimal conversion rate is going to be ∼50%. Regardless of the actual conversion rate, it is a great tool to forecast and compare audiologists who are in similar dispensing roles.
If metric is above 67%: find out which providers have a consistently high conversion rate and discover how they are successfully converting opportunities to sales. Allow the successful clinicians to coach those clinicians who struggle with the sales process.
If metric is below 50%: provide in-depth coaching on improving their consultative selling skills.
-
Net profit percentage of net hearing aid revenue
Definition: net profit (or bottom line) as a percentage of net revenue. For any business, this is the most crucial metric as it determines whether the business is making money or not.
Industry average benchmark: 12%.
Best practice benchmark: 20%.
Why it is measured: this is the ultimate measuring stick for any practice and a good starting point for assessing the overall health of the business.
If metric is below 12%: if the percentage is low (or negative), immediately pay attention to all of the other metrics previously discussed starting with gross margin percentage. Most likely, it is a combination of several different things, so having a strong familiarity with all of the other metrics will help diagnose a series of potential issues to address.
Quality Key Performance Indicators
Earlier we discussed the need to establish metrics that go beyond financial KPIs. Quality KPIs are intended to measure some aspect of the patient's experience in your practice and the benefit they might be deriving from your treatment recommendation. Audiologists are familiar with outcome measures. There are a plethora of outcome measures that have been developed and some of them are popular. For example, the Client Oriented Scale of Improvement (COSI) is a popular outcome measure that evaluates a patient's perception of relative improvement in listening situations they have targeted for improvement with amplification. Because the COSI is an open-ended outcome measure in which patients select and individualize areas to target for improvement with amplification, it would be hard to systematize the results and use it as a KPI in your practice.
Fortunately, there are several close-ended outcome measures that could be used as quality KPIs. One of the best, because it measures several dimensions of patient outcome is the International Outcome Inventory for Hearing Aids (IOI-HA).1 The IOI-HA is short (seven questions) and normative scores have been established, which can be used as benchmarks for the responses you collect from patients in your practice. Table 2 illustrates the seven questions listed on the IOI-HA. Recall that for each question there are five possible responses, ranging from a poor outcome to an excellent outcome. The five possible choices can be weighted on a 5-point scale with 1 being a poor outcome and 5 being the highest outcome for each question. Therefore, a perfect score on the IOI-HA would be 35. Normative research suggests a score of 25 or higher would be an indication of significant benefit from the patient.1
Table 2. The Seven Questions on the International Outcome Inventory for Hearing Aids1 .
| Q1. Think about how much you used your present hearing aid(s) over the past 2 weeks. On an average day, how many hours did you use the hearing aid(s)? |
| Q2. Think about the situation where you most wanted to hear better, before you got your present hearing aid(s). Over the past 2 weeks, how much has the hearing aid helped in that situation? |
| Q3. Think again about the situation where you most wanted to hear better. When you use your present hearing aid(s), how much difficulty do you still have in that situation? |
| Q4. Considering everything, do you think your present hearing aid(s) is worth the trouble? |
| Q5. Over the past 2 weeks, with your present hearing aid(s), how much have your hearing difficulties affected the things you can do? |
| Q6. Over the past 2 weeks, with your present hearing aid(s), how much do you think other people were bothered by your hearing difficulties? |
| Q7. Considering everything, how much has your present hearing aid(s) changed your enjoyment of life? |
The IOI-HA can be administered to patients 30 to 60 days following the hearing aid fitting. Results on the IOI-HA's 1 to 5 scale can be entered in your office management system or an Excel spreadsheet. A line graph, like the one shown in Fig. 5, can be used to analyze the data and identify trends. For example, in a practice with several audiologists, you may find that one audiologist's patients have consistently lower IOI-HA scores than the others. This would be data suggesting this audiologist needs additional training to boost patient outcomes. The IOI-HA scores, when cross-referenced to the products dispensed in your practice, can shed light on specific models or technology providing the highest outcomes. Additionally, reports can be run breaking down patient responses to the IOI-HA questionnaire to identify which of the seven questions have consistently lower than expected results. For example, you may find that of the previous 100 patients fitted with hearing aids in your practice, a large number of patients scored lower on question 3 than any of the other six questions. This may be an indication that your practice needs to focus their counseling efforts on helping patients better understand results from their hearing aids in challenging situations. This is an opportunity to provide targeted training around offering a better technological solution in noise or improved counseling to boost the listening-in-noise skills of patients. The bottom line is when a traditional outcome measure is turned into a KPI, more targeted training of the staff occurs. This targeted training is likely to result in improved patient outcomes.
Figure 5.
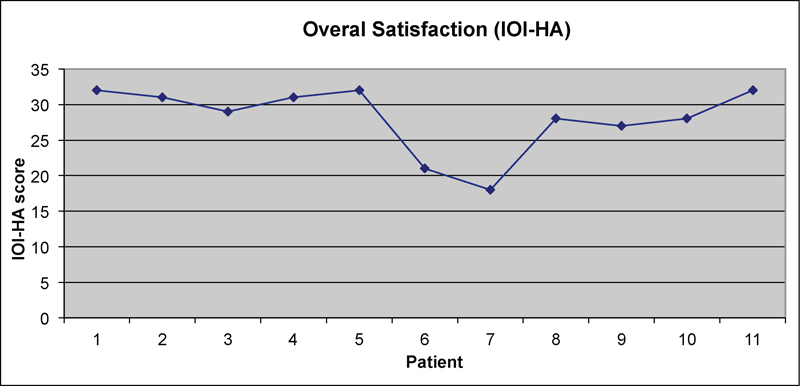
A line graph of International Outcome Inventory for Hearing Aids (IOI-HA) results for 11 patients. Notice how patients 6 and 7 have scores below the published norms of the IOI-HA.
The Importance of Benchmarking
KPIs without a benchmark are meaningless. A benchmark is a standard of performance against which the performance in your practice can be measured or judged. It is important to choose KPIs that are representative of your practice. For example, if you are in an ENT practice with four full time audiologists, the benchmarks with which you judge your practice should be derived from practices of a similar size. By the same token, if you own a private practice and you are the sole audiologist, you will need to establish benchmarks that reflect your operation. There are several sources of benchmarking information. Recently Sonova (Stafa, Switzerland) has sponsored a benchmarking survey, which has been published in the Hearing Review and Audiology Practices.2 In addition, Gleitman has authored an article on industry benchmarks.3 There are other good sources for industry benchmark data, including buying groups, office management system vendors, and all of the major hearing aid manufacturers. The most important consideration is matching the benchmark to the goals and type of practice.
Although there are no shortages of benchmarks, care must be taken to choose those most representative of your practice's mission and goals over the next 2 to 3 years. Once a solid group of benchmarks are in place, the challenge becomes devising a plan to narrow any gap between actual performance and the benchmark. Let us examine some specific strategies for narrowing those gaps.
Strategies for Moving the Needle
KPIs are essential to managing the performance of staff over time: it is all about managing the gap between expected performance (the KPI) and actual performance (the result or measure). Once you have identified a gap between a benchmark and the actual performance in your practice, it is vital to put a specific plan in place to close the gap. It makes no sense to establish a benchmark and measure performance against it if you do not take action with the information you are gathering. One of the most common gaps in an ENT practice's audiology business revolves around retail pricing.
Say, for example, that your audiology clinic's ASP and average margin per unit are remarkably low compared to the benchmark for a practice of similar size and location. The first step to shoring up this pricing gap would be to gain better insight and awareness of the market. This process would include comparing your practice's performance in these areas to others of similar geographic location and demographic variables (e.g., age and income). Other dimensions that need to be carefully evaluated when trying to move the needle on a gap related to a low average retail price include looking at the existing product mix of the practice and a need to keep price points simple for patients to understand. All possible causes of this ASP shortcoming should be evaluated with the staff, using principles we discussed earlier. After deliberation and guidance, this practice implemented a plan in which more time was taken with patients to carefully explain the benefits of mid- and upper-end technology. Using more of a comprehensive counseling-based approach to the hearing aid selection process, implemented over time with thoughtful coaching and feedback, resulted in a marked improvement in the ASP per unit in this practice. These results are shown in Fig. 6. Notice that the total hearing aid volume was unchanged, but ASP increased substantially. Clinicians in this practice were able to equate improved technology with the communication needs associated with more active lifestyles in their counseling approach with patients.
Figure 6.
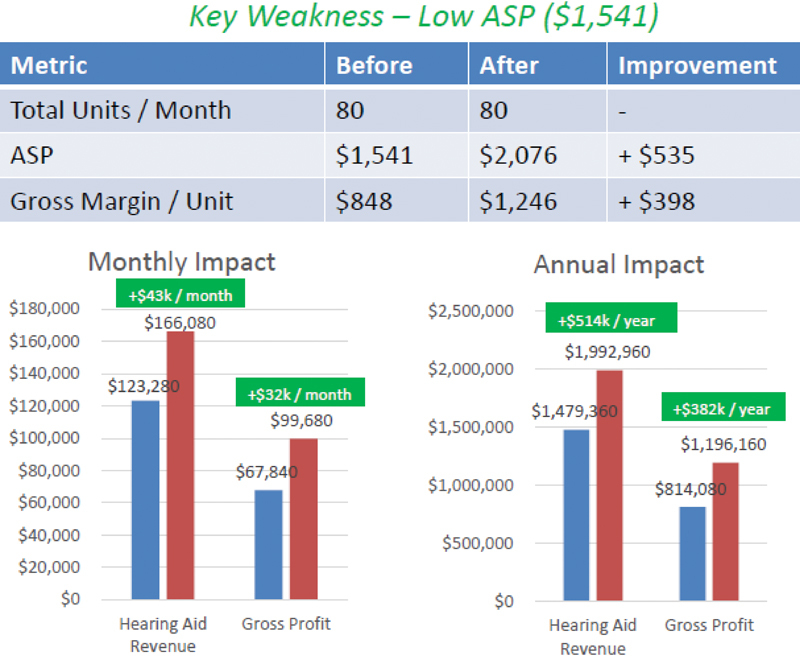
A comparison of average selling price (ASP) before and after coaching staff in one audiology/ear, nose, and throat (ENT) practice.
The Role of Effectiveness Managers: Doing More with Less
According to management expert Mark Horstman, there are four critical behaviors managers engage in every day: get to know their staff, communicate to their staff about performance, ask for more from their staff, and push work down to them whenever possible.4 KPIs when placed in the context of effective management are nothing more than a roadmap for doing a better job in these four areas. Ultimately, they will improve results of the business, which is usually year-over-year sustainable profitability. Using KPIs allows you to communicate more precisely about performance with your staff and to find areas where each member of the staff can improve specific skills.
Take the fourth critical behavior: push work down. This means allowing staff with less formal training and education to participate in revenue generating activities. For example, you discover from your KPIs that the activity resulting in the most revenue generation per hour is the process of selecting and fitting hearing aids. This activity collectively takes 2.5 hours. Other activities, like follow-up visits, routine hearing screenings, and troubleshooting hearing aids on a per hour basis, do not generate as much revenue. Once a manager recognizes that time equates to money, the routine tasks that do not generate as much revenue per hour can be pushed down to staff that have less formal education and get paid less. In a busy practice, the tasks that generate the most revenue per hour are done by the person with the most specialization (the audiologist) because activities that generate less revenue are pushed down to qualified assistants. In essence, this is doing more with less. The most efficient offices know what activities generate the most revenue. It is the path to a sustainable business and it starts by managing a group of no more than ∼12 KPIs.
It does not matter what analogy you use—the baseball box score, automobile dashboard, or airplane instruments—the judicious use of KPIs allow you to run a more efficient business and free you up to do what you love: to see more patients or work fewer hours. At the end of the day, no matter how sophisticated the technology or how elegant the KPI, it is all about people. Good people get results!
References
- 1.Cox R M, Alexander G C, Beyer C M. Norms for the international outcome inventory for hearing aids. J Am Acad Audiol. 2003;14(8):403–413. [PubMed] [Google Scholar]
- 2.Rawn K. US Hearing Industry Benchmark Survey: how do top performers drive growth? Audiol Pract. 2013;5(3):5–19. [Google Scholar]
- 3.Gleitman R. Your business and practice benchmarking. Hear Rev. 2015;22(8):18–21. [Google Scholar]
- 4.Horstman M. Hoboken, NJ: John Wiley & Sons, Inc.; 2016. The Effective Manager. [Google Scholar]