

Abstract
Chromatin structure, determined in part by DNA methylation, is established during differentiation and prevents expression of genes unnecessary for the function of a given cell type. We reported that DNA methylation and chromatin structure contributes to lymphoid-specific ITGAL (CD11a) and PRF1 (perforin) expression. We used bisulfite sequencing to compare methylation patterns in the ITGAL promoter and 5' flanking region of T cells and fibroblasts, and in the PRF1 promoter and upstream enhancer of CD4+ and CD8+ T cells with fibroblasts. The effects of methylation on promoter function were tested using regional methylation of reporter constructs, and confirmed by DNA methyltransferase inhibition. The relationship between DNA methylation and chromatin structure was analyzed by DNaseI hypersensitivity. Herein we described the methods and results in greater detail.
Keywords: DNA methylation, T-lymphocytes, Gene expression regulation
Introduction
DNA methylation in vertebrates refers to the methylation of deoxycytosine (dC) bases in CG pairs, and is associated with gene silencing. DNA methylation is essential for mammalian development (1), and contributes to gene silencing in differentiation, genomic imprinting, X chromosome inactivation, and suppression of parasitic DNA (2). Acquired changes in DNA methylation patterns have been implicated in the changes in gene expression that contribute to carcinogenesis, autoimmunity and aging (3). The importance of DNA methylation in normal and pathologic cellular processes has stimulated a growing interest in how DNA methylation suppresses gene expression, and in examining how changes in methylation patterns affect gene expression.
DNA methylation can inhibit gene expression by several mechanisms. The methylation of promoter sequences inhibits the binding of some transcription factors. Members of the methylcytosine binding protein family, such as methyl-CpG-binding protein 2 (MeCP2), specifically bind methylated DNA, blocking access of other factors required for gene transcription. More importantly, though, the binding of methylcytosine binding proteins to methylated DNA recruits chromatin inactivation complexes containing co-repressors and histone deacetylases, leading to a change in the chromatin structure from an open, transcriptionally permissive form to a more compact, inactive form, inaccessible to the transcription machinery (1). In general, methylation of sequences in or near regulatory elements have suppressive effects on gene expression, while methylation of coding sequences has little to no effect (4).
Several strategies have been devised for the quantitative assessment of total genomic deoxycytosine (dC) and deoxymethylcytosine content, as well as the methylation status of specific sequences. These are the subject of a recent review (5). At present, the most precise and generally applicable techniques for sequence-specific methylation analysis rely on bisulfite modification of DNA. Treating DNA with bisulfite deaminates cytosine bases to form uracil, but does not affect methylcytosine. Thus, PCR amplification and sequencing of bisulfite treated DNA allows precise quantitation of the methylation status of any desired CG pair (6). This approach, coupled with regional methylation of dC bases in promoter reporter constructs and DNaseI hypersensitivity analysis of chromatin structure in the region, provides information regarding both the presence and functional significance of the methylation patterns. Further confirmation may be obtained by demethylating DNA with the irreversible DNA methyltransferase inhibitor 5-azacytidine (5-azaC), then comparing effects on gene expression and methylation patterns.
In this report we describe the methods utilized to compare the methylation patterns of the ITGAL (CD11a) promoter in T cells and fibroblasts, and of the PRF1 (perforin) promoters in T cells, an NK cell line and in fibroblasts, and how cassette or "patch" methylation may be used to test the effects of regional methylation on ITGAL and PRF1 promoter function. We also describe the use of DNaseI hypersensitivity assays to probe the chromatin structure around the same genes in representative cells with differential CD11a and perforin expression, and the use of DNA methyltransferase inhibition to confirm transcriptionally relevant changes in DNA methylation patterns.
Materials and Methods
Cell and cell lines
T cells were isolated from the peripheral venous blood of healthy donors by density gradient centrifugation followed by e-rosetting. CD4+ and CD8+ subsets were isolated using Miltenyi beads and protocols provided by the manufacturer (Miltenyi, Auburn, CA). Purity was checked by flow cytometry and was typically > 94% CD4+ or CD8+. Where indicated the T cells were stimulated for 24 hours with 1 mg/ml phytohemagglutinin (PHA), then treated with 5-azaC or 2-deoxy-5-azaC (Sigma, St. Louis MO) for an additional 72 hours as described (7, 8). Dermal fibroblasts from a healthy donor were donated by Dr Samir Hanash, and synovial fibroblasts from a patient with osteoarthritis were provided by Dr C. William Castor. YT cells, a perforin-expressing NK cell line, were provided by Dr. Y. Tagaya (National Cancer Institute, Bethesda, MD) and cultured as described (7). Jurkat cells (E6-1), a generous gift from Dr. Arthur Weiss, were cultured as previously described (9). SAM-19 cells were donated by Dr. Mathias Lichtenheld and cultured as described (7).
Bisulfite genomic sequencing
1-5 mg of purified DNA was treated with sodium bisulfite (10), then the desired sequences were amplified in sequential fragments using nested PCR. The primers were designed to account for the conversion of dC to dU by the bisulfite and avoid CG pairs, and EcoRI sites were added to the forward primers, and XbaI to the reverse, to facilitate cloning.
The primers used for perforin were:
Distal 1st: Forward: 5'-AGTGAATTCTGAAGTTGGGATTAGAATTTGTTTAGATTTTGT-3'
Reverse: 5'-TAATCTAGAACCTAACCCTTCTTAAATATCAAAACCTATAA-3'
Distal 2nd: Forward: 5'-TTTGAATTCAGATATTTTGTAGGATTTTTATGTTTTTTAAAT-3'
Reverse: 5'-TCTTCTAGACCACTTCCTACTCAACCTACATCCCACCCTAA-3'
Proximal 1st: Forward: 5'-ATTGAATTCTAATTTTTAGGGTTTATATGATTTATAATTTT-3'
Reverse: 5'-TCCTCTAGAAATAACATCAACCCCCCAAACAACCCACTATAA-3'
Proximal 2nd: Forward: 5'-AAGGAATTCAGGTATAGTGAGGTTGAAGAATTTTATTAGTTT-3'
Reverse: 5'-TCCTCTAGACAACCACCACTCACATCACTTCTACTTCCTA-3'
The primers used for CD11a were:
Distal 1st: Forward: 5'-GAAGAATTCGTAGGTTGGTTTGAGTGTAGTGGTGTTTAAAAT-3'
Reverse: 5'-CTCTCTAGAACTAAAACCACAAATACATACCACCATACCTAA-3'
Distal 2nd: Forward: 5'-AAGGAATTCTTTTGTTTTAGTTTTTTAAGTAGTTGGGATTAT-3'
Reverse: 5'-CCCTCTAGAATCTTAAACTCCTATACTCAAATAATCCTCCTA-3'
Middle 1st: Forward: 5'-TAGGAATTCTATTTGAGTATAGGAGTTTAAGATTAGTTTGGGT-3'
Reverse: 5'-AAATCTAGAATACAAACTCACTAACTATAATTCCAACCCTTTT-3'
Middle 2nd: Forward: 5'-AGGGAATTCGGTATGTATTTGTGGTTTTAGTTATTTAGAGT-3'
Reverse: 5'-ATATCTAGATCTCTTAAAACCAAAAATCAAAACCAACCTAAA-3'
Proximal 1st: Forward: 5'-ATATCTAGACCCTTTAACCTCTTACAATAATACTTTCTCACAA-3'
Reverse: 5'-TTAGAATTCAAATGGGTTAAATATATTGTTTTGTTTTGTAATTTGT-3'
Proximal 2nd: Forward: 5'-TTTGAATTCATTTTTTAAGGTTTAGAGAAAGTTTTTATTTTT-3'
Reverse: 5'-CAATCTAGATTTCTCACAAAAACAACAAACTAATAACACTAA-3'
PCR conditions were as follows: 94°C for 2 min, and 5 cycles of 94°C for 1 min, 60°C for 2 min, 72°C for 3 min, then 25 cycles of 94°C for 30 sec, 60°C 2 min, 72°C 1 min 30 sec and finally 6 min at 72°C. The PCR mixture contained thermophilic DNA polymerase 1x buffer, magnesium free with 1.25 units of Taq DNA polymerase (Taq DNA polymerase in storage buffer B, Promega, Madison WI), 3.4 mM MgCl2, 0.5 μm of each primer, and 0.24 mM dNTPs in a total volume of 25 ml. The second round of PCR was performed with 0.5 mm of nested primers, and the PCR conditions were the same as the first except that the total volume was 50 ml. The amplified fragments were cloned into PBS+ (Stratagene, La Jolla, CA), and 5 independent clones for each of the amplified fragments were sequenced by the University of Michigan Sequencing Core.
Patch methylation and transient transfections
A 1.9kb XhoI fragment containing the human ITGAL promoter and 5' flanking region or a 1459-bp fragment encoding the perforin promoter and proximal enhancer were cloned into the luciferase-containing reporter vector pGL3-Basic (Promega). Appropriate restriction sites were engineered into the fragments to permit excision of the relevant regions using the QuikChange site-directed mutagenesis kit (Stratagene) and effects on promoter function excluded by transient transfection (7, 10). The regions of interest were then excised using the appropriate restriction endonucleases, gel purified, and methylated with SssI and S-adenosylmethionine (both from New England Biolabs, Beverly, MA) using instructions provided by the manufacturer. The methylated fragments were then ligated back into the expression constructs and methylation confirmed by digestion with appropriate methylation sensitive restriction endonucleases. Controls included mock methylated constructs similarly generated but omitting the SssI (7, 10). The methylated or mock methylated pGL3-ITGAL constructs were then transfected into Jurkat cells, and the pGL3-PRF1 constructs were transfected into SAM-19 cells, using electroporation and previously described protocols (7, 10). β-galactosidase or Renilla luciferase expression constructs (pRL-CMV; Promega) were used as transfection controls. Twenty-four hours later the cells were washed twice with PBS, suspended in 400 μl reporter lysis buffer (Promega), and lysed by freeze/thaw. Insoluble material was removed by centrifugation and luciferase or β-galactosidase measured. Briefly, β-galactosidase determinations were performed using the Galacto-Light system as per the manufacturer's protocol (Tropix, Bedford MA) while luciferase assays were performed using the Dual-Luciferase Reporter Assay Kit (Promega) and instructions provided by the manufacturer, measuring fluorescence with a Turner Designs (Sunnyvale, CA) luminometer.
DNase1 hypersensitivity
DNase1 hypersensitivity assays were performed as described (7, 11). Briefly, isolated nuclei were treated with 0, 40, 80, or 160 U/ml DNaseI (Worthington, Lakewood, NJ) at room temperature for 3 minutes, then the reaction was stopped with 20 mM EGTA/1% SDS and DNA isolated, digested with EcoRI for PRF1 or SacI for ITGAL, fragments fractionated by agarose gel electrophoresis, then transferred to nylon filters. The filters were hybridized with a 32P-labelled 277 bp fragment excised with EcoRI and XbaI (-1410 to -1133 relative to the transcription start site) from a 1459 bp fragment encoding the perforin gene promoter and 5' flanking region, or with a fragment spanning bp +1060 to +1264 (relative to the transcription start site) of the ITGAL gene, amplified by PCR (7, 11).
Results
Methylation status of the ITGAL and PRF1 promoters and 5' flanking regions in expressing and nonexpressing cells
ITGAL promoter methylation patterns were compared in fibroblasts and T lymphocytes as representative nonpermissive and permissive cell types. Figure 1A shows the ITGAL promoter numbered relative to the transcription start site (12). There are 22 potentially methylatable CG pairs between the 5' end of the fragment and the transcription start site, and 5 following. For reference, a region containing Alu elements and the transcriptionally relevant PU.1 and Sp1 sites are also shown (12). DNA was isolated from synovial or dermal fibroblasts, treated with bisulfite, then the ITGAL promoter and 5' flanking region were amplified, cloned, and 5 fragments sequenced from each region. Figure 1B shows the methylation status of each CG pair averaged over the 10 fragments from the 2 fibroblast types. Nearly all CG pairs are relatively heavily methylated (> 50%) in the DNA from both lines. Figure 1C shows the methylation pattern from the same region in T lymphocytes isolated from 4 to 6 healthy donors. The transcribed region is completely demethylated in all fragments from the 4 healthy subjects examined, while most of the sequence 5' to the transcription start site was partially methylated in all controls. Of note is the region containing Alu elements, identified by the bar, which is more heavily methylated in all subjects, consistent with reports that repetitive DNA sequences are usually heavily methylated (13).
Fig. 1. ITGAL promoter methylation.
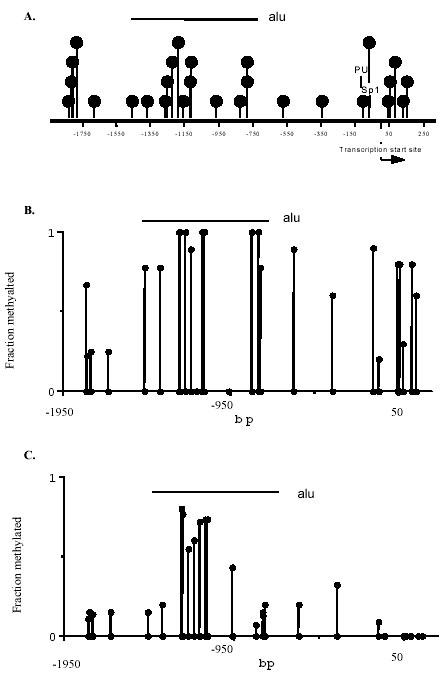
A. ITGAL promoter structure. The ITGAL promoter is shown, numbered relative to the transcription start site. Deoxycytosine residues in CG pairs are represented by the filled circles, the transcription start site by an arrow, and the PU.1 and Sp1 binding sites by lines. The horizontal line indicates a region containing Alu elements. B. ITGAL promoter methylation in fibroblasts. DNA was isolated from two fibroblast cell lines, treated with bisulfite, then the ITGAL promoter amplified in 3 regions. For each amplified region, 5 fragments were cloned and sequenced. The filled circles on the X axis represent each potentially methylatable dC residue, and the higher filled circles represent the average methylation for each site of the 5 sequenced fragments from both fibroblast lines. Again, the horizontal line indicates a region containing Alu elements. C. ITGAL promoter methylation in T cells. T cell DNA was similarly isolated, treated with bisulfite, amplified, and sequenced. The region from -1261 to -68 represents the average methylation of 5 fragments from each of 6 donors, while the remainder of the sequence represents the average methylation of 5 fragments from each of 4 normal donors. Again, the horizontal line indicates a region containing Alu elements. Modified from original published in Blood, 2002.
Perforin promoter methylation in T cells, NK cells and fibroblasts
A similar approach was used to compare PRF1 methylation patterns in YT cells, a human NK cell line that constitutively expresses perforin, and fibroblasts, which do not. Key elements of the human PRF1 promoter and 5' flanking region are shown in Figure 2A. The first 1300 bp 5' to the transcription initiation site contains 29 potentially methylatable CG pairs. The first 55 bp 5' to the start site contains a core promoter with a GC box. A series of repetitive elements is located between -396 and -83, and a region containing enhancer elements is located between -1136 and -983 (14, 15). Relevant transcription factor binding sites are also shown. The methylation pattern of this region was then compared in YT cells and fibroblasts using the same techniques applied to the ITGAL promoter. Figure 2B shows the average of the 10 determinations for each CG pair in the PRF1 promoter of the two fibroblast lines, and Figure 2C shows the methylation status of each CG pair in four to five fragments from the YT cells. The region is largely methylated in fibroblasts. In contrast, only a single methylated dC base was detected in perforin-expressing YT cells.
Fig. 2. PRF1 promoter methylation.
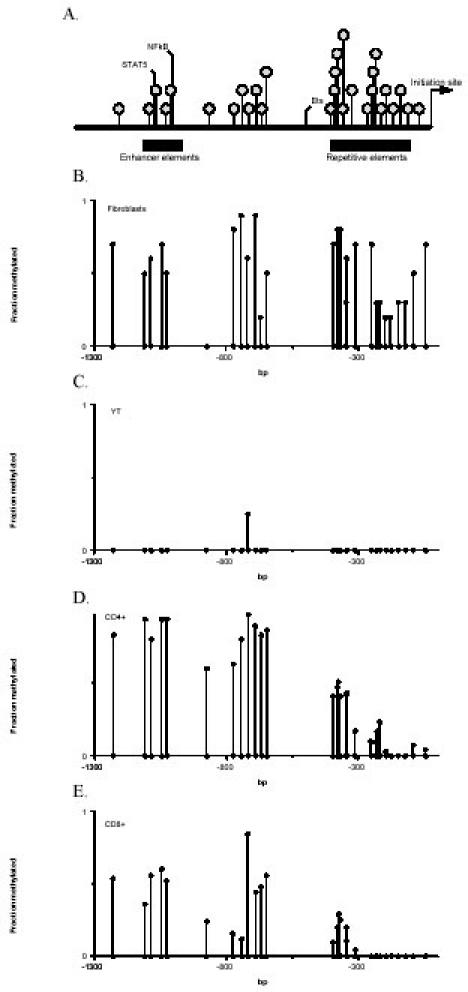
A. PRF1 promoter structure. The positions of the transcription initiation site, transcription factor binding sites, repetitive elements, and enhancer elements are identified. Each shaded circle identifies a potentially methylatable CG pair. B. PRF1 promoter methylation in fibroblasts. DNA was isolated from two fibroblast lines and bisulfite treated. Then the region shown in A was amplified in two fragments (-1326 to -599 and -457 to -4). For each amplified fragment, five fragments from each line were cloned and sequenced. Results are presented as in Figure 1, and each point represents the mean fraction methylated of each CpG pair using 10 sequenced fragments from the two lines. C. PRF1 promoter methylation in YT cells. DNA was isolated from YT cells, and the mean methylation of each CG pair was determined as in B. D. PRF1 promoter methylation in CD4+ T cells. DNA was isolated from primary CD4+ T cells and the average methylation for each methylatable dC determined as in panel B. Results represent the mean methylation of 35 fragments from 7 donors (-1326 to -599) or 30 fragments from 6 donors (-457 to -4). E. PRF1 promoter methylation in CD8+ T cells. DNA from primary CD8+ T cells was analyzed as in panel D. Results represent the mean methylation of 30 fragments from 6 donors (-1326 to -599) or 25 fragments from 5 donors (-457 to -4). Copyright 2003 - Journal of Immunology, reproduced with permission.
These results were then confirmed in primary CD4+ and CD8+ T cells. In cytotoxic CD8+ T cells, perforin expression is regulated by signals from the IL-2 receptor activating STAT5, which then binds the enhancer region shown in Figure 2A (15). However, primary CD4+ T cells do not normally express the gene (7). Figure 2D shows the methylation pattern of the same region in CD4+ T cells from 6-7 normal individuals. The region from -1326 through-650 is relatively heavily methylated, while the more proximal CG pairs become progressively less methylated the closer they are to the transcription start site, with most of the methylated residues in the proximal sequences located in the region containing repetitive elements (Fig. 2A). Figure 2E shows the average methylation status of the same region in CD8+ T cells isolated from 4-5 healthy subjects. Overall, the entire region tends to be less methylated in CD8+ T cells compared to CD4+ cells (mean fraction methylated 0.23 vs 0.48, CD8 vs CD4, p < 0.001 by paired t-test). The region from -1326 to -1000 is less methylated than the corresponding region in the CD4+ T cells (0.89 vs 0.52 for the analyzed region, CD4 vs CD8, p = 0.003). The region from -1000 to -599, flanking the enhancer elements (Fig. 3A), is also significantly (p = 0.001) less methylated in CD8+ T cells relative to CD4+ T cells (mean fraction methylated 0.41 vs 0.71), although there is one exception at -720. The region from -457 to the transcription start site was also less methylated in the CD8+ T cells (0.21 vs 0.07, CD4 vs CD8, p < 0.001).
Fig. 3. Methylation suppresses ITGAL and PRF1 promoter function.

A. Effect of methylation on ITGAL promoter function. The regions from -1818 to -362 and -362 to +79 were excised, methylated with SssI in vitro, ligated back into a luciferase reporter construct, and transfected into Jurkat cells, using cotransfection with β-galactosidase as a control. Controls consisted of similar preparations but without the addition of SssI. The results are presented as the ratio of luciferase/β-galactosidase expression in arbitrary units standardized to the mock-methylated controls and represent the mean ± SEM of 5 experiments for the region from -1818 to- 362 and 4 experiments for the region from -362 to +79. B. Effect of methylation on perforin gene promoter function. A 1459-bp perforin gene promoter fragment was cloned into a reporter construct containing a firefly luciferase reporter gene. The indicated regions, numbered as in Figure 2A, were excised, methylated in vitro, religated into the reporter construct, and then transfected into SAM-19 cells. The solid bars represent the methylated construct; and the open bars the mock methylated constructs. Results are expressed relative to β-galactosidase or Renilla luciferase reporter constructs and are standardized to the mock methylated control. Results represent the mean ± SEM of four independent experiments for the first two data sets, and the mean ± SEM of two independent experiments for the second two data sets. Figure 3A: Copyright 2002 - Blood, reproduced with permission. Figure 3B: Copyright 2003 – Journal of Immunology, reproduced with permission.
Effects of methylation on ITGAL and PRF1 promoter and enhancer function
The relative importance of sequence specific methylation can be determined using regional or “patch” methylation. The approach used by our group is to excise the region of interest from a reporter construct, methylate the fragment in vitro with SssI and S-adenosylmethionine, ligate the methylated fragment back into the construct, and compare expression of the methylated construct and controls in transfected cells (7, 10).
The effect of methylation of the ITGAL promoter 5' flanking region was determined by first inserting an NdeI site into the ITGAL promoter at bp -382. The regions from -1818 to -382 or from -382 to +79 were then excised, methylated in vitro, ligated back into the construct, and transfected into Jurkat cells. Figure 3A shows that methylation of the region from the 5' end of the cloned promoter fragment to -382 partially suppresses promoter activity relative to controls, consistent with reports that methylation can suppress promoter function from a distance (1). Methylation of the region containing the active promoter (-362 to +79) suppressed to a greater degree. These studies suggest that ITGAL promoter activity is methylation sensitive.
Similar studies examined the functional effects of methylation on the PRF1 gene. These studies used a previously described 1459-bp fragment containing the perforin promoter and upstream enhancer driving a firefly luciferase reporter gene (15). An NdeI site was inserted at -290, and a StuI site at -14. The region from -1410 to -290 was then excised with EcoRI and NdeI, and the region from -1410 to -14 with EcoRI and StuI. The fragments were purified, similarly methylated with Sss1 and S-adenosylmethionine, ligated back into their respective reporter constructs, purified, and transfected into SAM-19 cells. Methylation of both regions inhibited promoter function, with methylation of -1410 to -14 giving slightly greater suppression (Fig. 3B). This suggests that hypomethylation of the core promoter is insufficient to permit gene expression when the more 5' sequences are methylated. Figure 3B also shows that methylation of the promoter 5' flanking sequence (-979 to -527) decreased promoter function by ~70%. In contrast, methylating the distal 5' region (-1410 to -979) only decreased function by ~10%. This suggests that the methylation status of the region linking the promoter and enhancer, hypomethylated in CD8+ relative to CD4+ T cells, is important in PRF1 gene expression.
DNA demethylation and gene activation with DNA methylation inhibitors
The effects of DNA methylation on gene expression can be confirmed using the irreversible DNA methyltransferase inhibitor 5-azaC. 5-azaC is a cytosine analog that is incorporated into newly synthesized DNA, where it covalently binds DNA methyltransferases as they methylate the purine ring. This depletes cellular DNA methyltransferase pools and results in hypomethylation of the newly synthesized DNA strand. The cell retains a fully methylated parent strand. Following a second round of cell division, half the daughter cells will have symmetrically hypomethylated DNA, while the other half will have fully methylated DNA (16). Thus, at most half the cells will be affected by one treatment, and effects are usually not seen until after 2 rounds of cell division (16). Increased expression will be seen in those genes for which the cells express the necessary transcription factors, but which were suppressed by DNA methylation.
The effects of DNA methylation on PRF1 expression were confirmed by treating PHA stimulated CD4+ and CD8+ T cells with 5-azaC. Perforin expression increased in both cell types at the mRNA and protein levels (7). Figures 4A and 4B show the methylation patterns of the distal 12 CG pairs in untreated and 5-azaC treated CD4+ T cells. The distal region is nearly completely methylated in the PHA stimulated CD4+ T cells, similar to that observed in unstimulated cells (Fig. 2). 5-azaC demethylates the region between -600 and -900. Figures 4C and 4D show similar studies in untreated and 5-azaC treated CD8+ T cells. Again, there is a preferential demethylation of the region between -600 and -900. This is the same region differentially methylated between CD4+ and CD8+ T cells, and which when methylated suppresses promoter function. These results lend further support to the contention that methylation of this region suppresses perforin expression in T cells.
Fig. 4. Effect of 5-azaC on PRF1 promoter methylation.
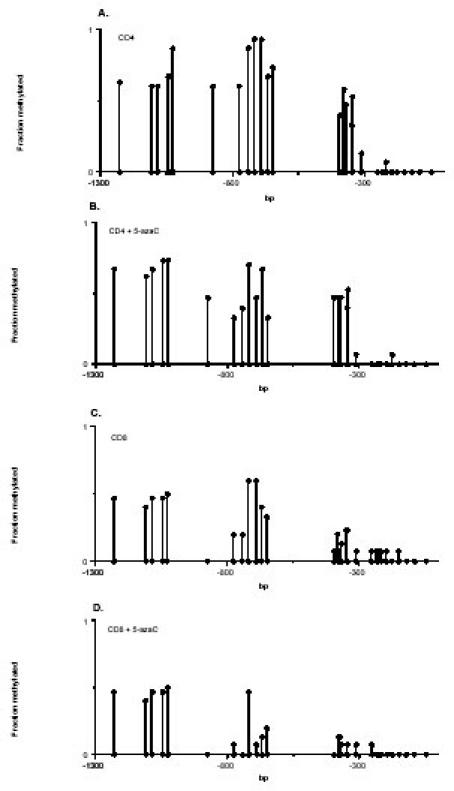
A. DNA was isolated from 3 PHA stimulated CD4+ T cell lines and methylation patterns determined as in Figure 2, sequencing 5 cloned fragments from each of the 3 lines. Results represent the mean fraction methylated of the 15 determinations. B. The 3 CD4+ T cell lines shown in panel A were treated with 5-azaC, then DNA was isolated and methylation patterns were determined as in panel A. C. Methylation patterns were determined in 3 PHA stimulated CD8+ T cell lines, using the approach described in panel A. D. Methylation patterns were determined in the 3 PHA stimulated, 5-azaC treated CD8+ T cell lines using the approach described in panel B. Copyright 2003 – Journal of Immunology, reproduced with permission.
Comparison of the chromatin structure near the ITGAL and PRF1 promoter in expressing and nonexpressing cells with DNaseI digestion
Chromatin structure around the ITGAL gene was also compared in T cells and fibroblasts using DNaseI hypersensitivity. Transcriptionally inactive chromatin is typically characterized by a condensed, nonpermissive configuration, inaccessible to transcription factors. Initiation of transcription requires first a remodeling of the chromatin, such that promoter sequences become accessible to transcription factors. The open, permissive configuration also becomes accessible to the endonuclease DNaseI. Limited digestion of intact chromatin with DNaseI results in cleavage at these sites, typically in transcriptionally relevant regions. The sites may be mapped by secondary digestion with appropriate restriction endonucleases and traditional Southern blotting, using probes to the ends of restriction fragments (17).
DNaseI hypersensitivity assays were used to determine if DNA hypomethylation correlated with a transcriptionally permissive chromatin configuration in the ITGAL gene. Nuclei were isolated from normal human T cells and fibroblasts then digested with increasing amount of DNaseI. DNA was then isolated, digested with SacI, and the fragments analyzed by southern blotting using a probe corresponding to bp +1060 to +1264 relative to the transcription start site. Figure 5A shows an approximately 3.2 kb fragment resulting from SacI digestion in both T cells and fibroblasts. Digestion with low concentrations of DNaseI causes the appearance of a prominent 1.4 kb band in T cells but not fibroblasts, while the highest concentration tested appears to cause some nonspecific digestion in both cell types. The cleavage site maps to the region just 5' to the transcription start site in T cells, and hypomethylated in T cells relative to fibroblasts (Fig. 5B). This indicates that this hypomethylated region has a structure making the DNA more accessible to the enzyme in T cells, consistent with active chromatin.
Fig. 5. ITGAL promoter chromatin structure in fibroblasts and T cells.
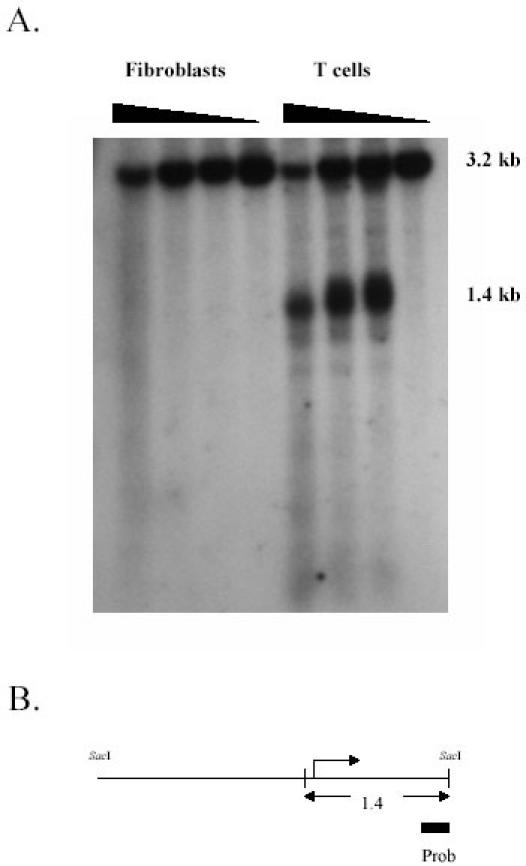
A. Fibroblasts and freshly isolated T cells were homogenized in PBS then treated with 0, 40, 80 or 160 U/ml DNaseI. DNA was then isolated, digested with SacI, fractionated by agarose gel electrophoresis, transferred to nylon filters, hybridized with a 32P-labeled cDNA probe amplified from bp 1060-1264 of the ITGAL gene, and developed using a PhosphoImager. Fragment size is shown in the right column. B. Schematic diagram showing the 3.2 kb SacI - SacI fragment, the relative size and location of the probe, and the approximate location of the 1.4 kb fragment. The broken arrow represents the transcription start site. Copyright 2002 – Blood, reproduced with permission.
Similarly, chromatin structure near the PRF1 promoter was compared in YT cells and fibroblasts, using limited DNaseI digestion. Nuclei were isolated and briefly digested with increasing amounts of DNaseI. DNA was then isolated, digested with EcoRI, and the fragments analyzed by Southern blotting, shown schematically in Figure 6A. A 2.65-kb EcoRI-EcoRI fragment is seen in both cells (Fig. 6B). DNaseI digestion of YT cells releases 1.2-, 0.6-, 0.5-, and 0.4-kb fragments. In contrast, fibroblast DNA is resistant to DNaseI in this region. The DNaseI studies indicate that the perforin gene promoter/enhancer fragment was inaccessible to the enzyme in fibroblasts, but not in YT cells. Similar studies comparing DNaseI hypersensitive sites in primary CD4+ and CD8+ T cells demonstrated the same 1.2 kb fragment, mapping to the minimal promoter, in both cell types (Fig. 6C). However, CD8+ cells also demonstrate a DNaseI hypersensitive site at 0.6 kb, indicating an open configuration near the enhancer region. This is just 5' to the region differentially methylated between CD4+ and CD8+ T cells (Fig. 3D), where promoter function was suppressed by methylation of this region (Fig. 4B). This is also adjacent to the STAT5 binding site regulating perforin expression (14). Together this suggests that methylation of this region may contribute to a transcriptionally inactive configuration in CD4+ T cells.
Fig. 6. PRF1 promoter chromatin structure in fibroblasts, NK cells, and CD4+ and CD8+ T cells.
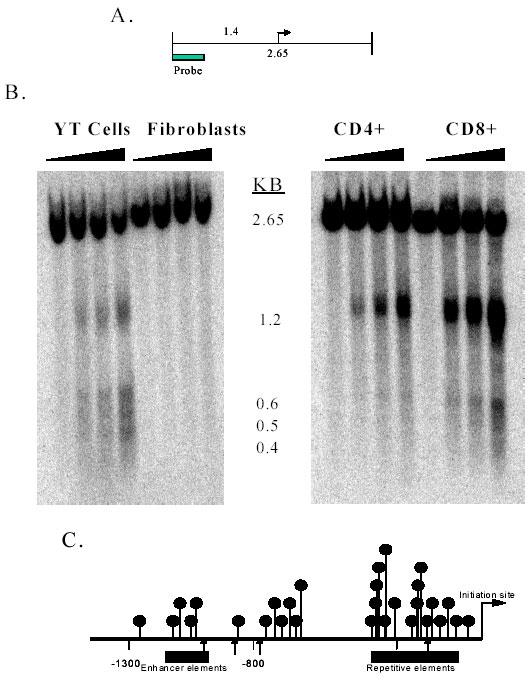
A. Map of the region analyzed, indicating the 2.65 kb EcoR1 - EcoR1 fragment, the transcription start site (arrow), and the location of the fragment used to probe the blot. The distance from the 5' EcoRI site to the transcription start site is 1.4 kb. B. Nuclei were isolated from YT cells or fibroblasts (left panel), or CD4+ and CD8+ T cells (right panel). The chromatin was digested with 0, 40, 80, or 160 U/ml DNaseI, then Southern analysis performed as described in Materials and Methods. Fragment size in kb is shown in the middle of the figure. C. The arrows identify cleavage sites producing the 1.2, 0.6, 0.5 and 0.4 kb fragments shown in panel B. The balloons again identify CG pairs. Copyright 2003 – Journal of Immunology, reproduced with permission.
Discussion
In this report we describe the use of bisulfite sequencing, regional methylation of promoters in reporter constructs, treatment of S-phase cells with 5-azaC to determine effects of DNA methylation on ITGAL and PRF1 gene expression, and the use of DNaseI hypersensitivity assays to correlate the methylation status of the regulatory regions with chromatin structure. Bisulfite sequencing revealed that the ITGAL promoter is heavily methylated in fibroblasts but not T cells, and that methylation of the core promoter suppressed promoter function. Further, hypomethylation of the ITGAL promoter and 5' flanking region correlated with the presence of a DNaseI hypersensitive site adjacent to the core promoter. These results indicate that ITGAL promoter methylation contributes to CD11a suppression in fibroblasts. The observation that hypomethylation correlates with a DNaseI hypersensitive site near the core promoter is consistent with evidence that DNA methylation contributes to gene silencing by attracting chromatin inactivation complexes promoting chromatin condensation into an inactive configuration (2, 4).
Bisulfite sequencing of the PRF1 core promoter similarly demonstrated relatively complete methylation in fibroblasts but hypomethylation in CD4+ and CD8+ T cells. Again, hypomethylation of the minimal promoter correlated with the presence of a DNaseI hypersensitive site. However, in contrast to ITGAL, core promoter hypomethylation alone was insufficient to cause gene expression in CD4+ T cells. Hypomethylation of a region linking the core promoter with an upstream enhancer correlated with gene expression in CD8+ T cells, and demethylation of this region with 5-azaC induced perforin expression in CD4+ T cells as well as increasing expression in CD8+ T cells. Selective methylation of this region in reporter constructs suppressed promoter function, indicating transcriptional relevance. Finally, hypomethylation of the region linking the enhancer with the promoter coincided with the presence of a DNaseI hypersensitive site, again linking DNA hypomethylation with a permissive chromatin configuration. We have since used hypersensitivity analyses to identify a downstream enhancer demethylated and activated by 5-azaC to induce expression of the IgE FcRg1 molecule, characteristic of effector T cells (unpublished results).
However, DNA hypomethylation does not always correlate with DNaseI hypersensitivity. Bisulfite sequencing of the PRF1 promoter and upstream enhancer region in YT cells, a transformed NK line, demonstrated nearly complete demethylation of the entire region. This is consistent with other reports that the DNA of transformed lines is generally hypomethylated, with the exception of certain CpG islands (18). However, despite the overall hypomethylation, the DNaseI hypersensitive sites were nearly identical in YT cells and the relatively more methylated CD8+ T cells. Similarly, the ITGAL 5' flanking region was largely demethylated in T cells, but the only DNaseI hypersensitive site detected was adjacent to the core promoter. It is likely that other determinants of chromatin structure, such as histone acetylation and/or methylation, also contribute to the formation of the hypersensitive sites. These may be identified using chromatin immunoprecipitation approaches (19).
One of the strengths of bisulfite sequencing is its general applicability to nearly any desired sequence. Further, methylation patterns can vary on a clonal basis (7). By cloning and sequencing 5 or more fragment from each amplified region studied, an index of clonal variability can be obtained. Alternatively, the PCR products may be directly sequenced, giving a average of the methylation status of each CG pair. One limitation of bisulfite sequencing is that the technique requires PCR amplification, and GC rich sequences may be difficult to amplify. The use of improved Taq polymerases, such as Platinum Taq PCRx DNA polymerase from Invitrogen (Carlsbad, CA) may help in this situation. Further, it is important to assure that the bisulfite conversion process is complete. The strategies described in the Protocols section help address this concern. Finally, once the importance of specific methylation changes is established, the more rapid and technically less demanding methylation specific PCR assays may be used to quickly assess methylation status of the region for high throughput studies (5). This approach relies on amplifying bisulfite treated DNA with primers specific for sequences that would correspond to bisulfite modified or unmodified dC bases, depending on their methylation status, and determining the relative abundance of both amplified fragments.
Regional or cassette methylation provides valuable supportive evidence for the relevance of methylation changes to gene expression. DNA methylation can suppress gene expression from a distance of up to 500-1000 bp (1), and it is important to determine if methylation changes some distance from a promoter are affecting promoter function. An example is shown in Figure 3B, where methylation of the most 5' sequences of the PRF1 promoter had minimal effect on promoter function, although changes in methylation of this region were detected in 5-azaC treated T cells. Others have reported that strong promoters with only a few CG pairs may also be resistant to suppression by methylation (20), and cassette methylation may be used to verify the significance of methylation changes in similar situations. The limitations of this approach include the concern that while methylation can promote condensation of intact chromatin, the plasmids used in transient transfections may not necessarily assume the same configuration when methylated.
The relative strengths and weaknesses of 5-azaC as a probe for methylation sensitive genes are well summarized in the literature (16, 21). 5-azaC has effects on a number of cellular processes including RNA and protein synthesis, while 2-deoxy-5-azaC is more potent and relatively more specific for DNA methylation, but is also more toxic to cells. Both also have a relatively narrow window between concentrations inhibiting DNA methylation and concentrations inhibiting DNA synthesis. Since the treated cells need to go through 2 rounds of cell division before changes in methylation sensitive genes occur (16), it is often necessary to test a range of concentrations to optimize changes in gene expression. It can also be useful to include treatment with hydroxyurea as control, as this agent will also inhibit DNA synthesis, but does not inhibit DNA methylation (22). Changes in gene expression similarly affected by 5-azaC and hydroxyurea are likely to be due to DNA synthesis inhibition.
Overall, the relatively newer techniques of bisulfite sequencing and cassette methylation greatly augment the utility of the older techniques of 5-azaC treatment and DNaseI hypersensitivity analyses. The combination of these techniques now permits detailed analyses of how DNA methylation changes relate to changes in gene expression. This has utility in normal cellular processes such as differentiation, but also to pathologic states such as aging, autoimmunity and cancer (3).
Acknowledgments
The authors thank Ms. Cindy Bourke for her excellent secretarial assistance, and Ms. Ailing Wu for her expert technical help. The authors have no conflicts of interest to declare related to this publication. This work was supported by PHS grants AG014783, AR42525, and AI42753 and a Merit grant from the Dept. of Veterans Affairs.
Abbreviations
- PHA
phytohemagglutinin
- 5-azaC
5-azacytidine
- dC
deoxycytosine
- SAM
S-adenosylmethionine
- MeCP2
methyl-CpG-binding protein 2
Appendix
Protocols
Protocol I: Bisulfite Genomic Sequencing
A. Equipment and kits
Wizard DNA Clean-Up System (Promega)
Thermocycler
Agarose gel electrophoresis apparatus
Water baths
Microcentrifuge
1.5 ml microcentrifuge tubes
Vacuum centrifuge
QIAquick gel extraction kit (Qiagen, Valencia CA)
B. Reagents
2 M NaHSO3: 3.8 gm in 10 ml ddH2O, mix by gentle shaking
0.2 M Hydroquinone: 0.220 gm in 10 ml dH2O, mix by gentle shaking
3.5 M NaOH
3.0 M NaOH
6M NH4oAc pH 7.0
Glycogen 5 mg/ml in dH2O
DNA: 0.05-0.50 g/μl in dH2O
Mineral oil
pBS vector + (Stratagene)
Phenol/chloroform
Tris-EDTA (TE: 10 mM Tris-HCl, pH 7.5, 0.1 mM EDTA.
Appropriate restriction endonucleases
C. Methods
Bisulfite treatment
Mix 45 μl DNA (~2-20 μg) with 5 μl NaOH in 1.5 ml microcentrifuge tubes, incubate at 37°C x 20 minutes in water bath.
Add 517 μl NaHSO3 and 30 μl hydroquinone, vortex, concentrate liquid in tip by centrifugation, overlay with 150 μl mineral oil, incubate at 55°C x 18 h in water bath.
Desalting
Use the Wizard DNA Clean-Up System. Add 1 ml of the resin to 300 ml of the NaHSO3-treated DNA.
Apply slurry to column, using vacuum to draw sample into the column.
Wash column x3 with 1 ml 80% ethanol.
Remove ethanol by centrifugation over an eppendorf tube at 10,000 X 2 min in microfuge.
Elute DNA with 45 μl ddH2O, centrifuge at 14,000 X 5 min, then transfer to new 1.5 ml tubes.
Add 5 μl 3M NaOH to each sample ([NaOH]final = 0.3 M), incubate 37°C x 15 minutes.
Add 50 μl 6M NH4oAc ([NH4oAc]final = 3M) and mix.
Precipitate DNA by adding 1 μl glycogen + 250 μl 95% ETOH, incubate at -80°C x 2-18 hrs.
Centrifuge to collect precipitate, wash with 70% EtOH, dry in speedvac, redissolve in 50 μl ddH2O.
PCR amplification, purification and digestion
In designing primers avoid CG pairs and replace all dC bases with dT. For the final amplification include 5' EcoRI and 3' XbaI linkers at the ends of the primers for ease in cloning.
Use nested PCR for optimal results. Protocols need to be established for each DNA fragment studied.
Following PCR transfer 45 μl of PCR product to 1.5 ml Eppendorf tube, bring up volume to 200 μl with 155 μl Tris-EDTA (TE).
Extract once with 200 μl phenol/chloroform and once with 200 μl chloroform.
Precipitate with 500 μl 100% ethanol, 20 μl 5M NaCl, 1 μl glycogen. Vortex mixture then incubate at -80°C, 2-18 hrs.
Centrifuge 14,000 rpm/5min, wash precipitate with 70% ethanol, resuspend pellets in 15 μl TE.
Digest PCR product with a suitable restriction enzyme to remove bisulfite unconverted DNA, i.e. the enzyme should recognize a sequence with at least one dC which would be converted to dT by bisulfite treatment, conferring resistance to digestion.
Fractionate the digest using a 1% agarose gel, elute DNA in 20 μl ddH2O using Qiagen gel extraction kit.
Ligate the PCR product into to the pBS+ (Stratagene) vector, clone and sequence using standard protocols.
Protocol II: Cassette methylation
Reagents and equipment
A. Equipment and kits
Qiagen Plasmid Maxi kit (Qiagen)
QIAquick gel extraction kit (Qiagen)
Amaxa Nucleofector apparatus and solutions or other electroporation apparatus
Turner Designs or other luminometer
Dual-Luciferase Reporter Assay Kit (Promega)
Agarose gel electrophoresis apparatus
Water baths
B. Reagents
Appropriate restriction endonucleases to excise fragment
SssI methylase 4U/μl (New England Biolabs)
200x S-adenosylmethionine (SAM) (New England Biolabs)
NE buffer 2 (New England Biolabs)
PGL3-Basic (Promega) or EGFP-C1 (Promega)
T4 DNA ligase, 10-20 U/μl (Promega)
10X T4 DNA ligase buffer (Promega)
EtOH/NaoAc
Glycogen
Phenol/chloroform
pRL-CMV (Promega)
C. Methods
Obtain cloned or PCR amplified promoter fragment. If amplified by PCR, be sure to confirm sequence to exclude Taq error.
Clone the promoter into the Luciferase-containing reporter vector PGL3-Basic (Promega) or the eGFP containing report vector EGFP-C1 (Promega).
Prepare plasmid DNA using the Qiagen Plasmid Maxi kit.
Excise the regions of interest from 50 μg of DNA using the appropriate restriction endonucleases. If necessary restriction sites can be generated using the Quickchange site-directed mutagenesis kit (Stratagene), taking care to exclude the possibility that the mutations affect promoter function with appropriate transfection assays.
Fractionate the digest by agarose gel electrophoresis and elute DNA using the Qiagen QIAquick gel extraction kit, saving both the vector and the excised fragment. Dissolve the DNA in 80 μl ddH2O.
Methylation of excised fragment with Sss1 and SAM. Controls include a mock methylated fragment, prepared by omitting the Sss1. Mix the reagents as described in the table below.
Table 1.
Mixing Reagents Table
| CpG methylation | Mock methylation |
| 40 μl DNA | 40 μl DNA |
| 16 μl 10 x NE Buffer 2 | 16 μl 10 x NE Buffer 2 |
| 8 μl 20 x SAM (200x stock diluted 1:10 in ddH20) | 8 μl 20 x SAM (200x stock diluted 1:10 in ddH20) |
| 8 μl Sss1 | |
| 88 μl ddH2O | 96 μl ddH2O |
| Total volume: 160 μl | Total volume: 160 μl |
Incubate the mixtures 37°C 18 hrs, then add another 4 μl Sss1 and 4 μl 20 X SAM into the CpG methylation sample, or SAM alone into control. Incubate mixture 37°C another 4 hours, then inactive Sss1 methylase by heating at 65°C for 20 min. Extract both the methylated and mock methylated fragment with phenol/chloroform, precipitate DNA with EtOH/oAc and glycogen, then resuspend in 20 μl ddH2O. Use 4 μl of the DNA solution to confirm methylation by digestion with the appropriate methylation sensitive enzyme and agarose gel electrophoresis.
Religate fragment back into the promoter-reporter construct. Mix 16 μl methylated or unmethylated fragment, 4 μl of linear vector lacking the fragment, 4 μl 10X T4 DNA ligase buffer, 2 μl T4 DNA ligase, 14 μl ddH2O and incubate at 14°C 18-24 hrs. Extract with phenol/chloroform, precipitate with EtOH/oAc/glycogen, resuspend in 20 μl ddH2O, then check ligation by digestion of 5 μl with appropriate restriction endonucleases followed by agarose gel electrophoresis.
Transfect the methylated or mock methylated constructs into appropriate cells by electroporation using Amaxa Nucleofection apparatus and the manufacturer's protocols. Use Renilla luciferase expression construct (pRL-CMV, Promega) as transfection control in same tube.
Culture cells for 48 hours, wash twice with 1 x PBS, suspend in 400 μl reporter lysis buffer (Promega), and lyse by freeze-thaw in dry ice/acetone. Insoluble material is removed by centrifugation and luciferase assay performed using Dual-Luciferase Reporter Assay Kit (Promega) and instructions provided by the manufacturer, and measuring fluorescence with the luminometer.
Protocol III: DNaseI Hypersensitivity Assays
A. Equipment and kits
1 ml Dounce homogenizer
Centrifuge
Centrifuge tubes
Microcentrifuge
Microcentrifuge tubes
Water baths
Agarose gel electrophoresis apparatus
B. Reagents
PBS: 8 g/L NaCl, 0.2 g/L KCl, 1.44 g/L Na2HPO4, 0.24 g/L KH2PO , pH 7.4
Trypsin-EDTA: 0.5 g/L trypsin, 0.2 g/L EDTA (Invitrogen)
DNaseI (molecular biology grade, Worthington)
DNaseI I buffer:
Table 2.
DNaseI I buffer
| Component | Stock | Final | Amount for 50 ml |
| HEPES pH 8.0 | 1 M | 10 mM | 500 μl |
| KCl | 3 M | 50 mM | 833 μl |
| MgCl2 | 500 mM | 5 mM | 500 μl |
| CaCl2 | 1 M | 3 mM | 150 μl |
| NP40 | 100% | 0.1% | 50 μl |
| Glycerol | 100% | 8% | 4 ml |
| *DTT | 1 M | 1 mM | 50 μl |
*Add DTT just prior to use.
DNaseI digestion stop buffer:
Table 3.
DNaseI digestion stop buffer
| Component | Stock | Final | Amount for 15 ml |
| EGTA | 50 mM | 20 mM | 6 ml |
| SDS | 10% | 1% | 1.5 ml |
| DNase-free H2O | 7.5 ml |
DNase-free ribonuclease A (10 mg/ml, Invitrogen).
Proteinase K (10 mg/ml, Invitrogen).
3M sodium acetate.
Phenol/chloroform/isoamyl alcohol (25:24:1).
Isopropanol.
Ethanol, 70%.
TE: 10 mM Tris-HCl, pH 7.5, 0.1 mM EDTA.
Gene-appropriate restriction enzyme with suitable 10x reaction buffer.
1x TAE: 20 mM Tris-acetate, pH 8.0, 1 mM EDTA
Agarose, electrophoresis grade.
10x Loading buffer: 65% (w/v) sucrose, 10 mM Tris-HCl pH 7.5, 10 mM EDTA, 0.3% (w/v) bromphenol blue.
1kb ladder (Invitrogen).
[α32P] dCTP (PerkinElmer, Boston MA).
Random primer DNA labeling system (Invitrogen).
PhosphorImager storage plates (Molecular Dynamics of Amersham, Piscataway, NJ), or X-ray film.
C. Methods
Isolation of nuclei
Adherent cells: For each 100x20 mm dish (1.5-2.0 x 10⁷ cells), remove culture medium, rinse plate twice with PBS, add 1 ml Trypsin-EDTA and incubate at 37°C for 3-5 min. Dislodge the cells with gentle shaking, then immediately add back serum containing culture medium to quench the trypsinization. Transfer the cells to a centrifugation tube and collect by sedimenting at 200 x g for 5 min at 4°C, then wash twice with cold PBS.
Suspension cells: Harvest the cells (approximately 2x10⁷) from the flask by sedimenting at 200 x g for 5 min at 4°C, then wash twice with cold PBS.
Resuspend the cell pellet in 1.2 ml ice-cold DNase I buffer, and then disrupt cells on ice using a Dounce homogenizer (approximately 10 strokes). Make 4 aliquots (280 μl each), keeping the aliquots at 4°C on ice.
DNaseI treatment of nuclei
Reconstitute vial with DNaseI buffer and glycerol according to the manufacturer's instructions, mix by gentle inversion, gently centrifuge to remove the liquid from the lid, and store aliquots (5 U/μl) at -80°C.
For DNaseI digestions, it is often necessary to first establish the optimal amount of DNaseI, since the appropriate concentration can vary for different cell types. For T lymphocytes we incubate the four 280 μl aliquots with 0 40, 80, and 160 U/ml of DNaseI (0, 2.2, 4.4 and 9.0 μl, respectively) at 25°C in a controlled temperature water bath for 3 min, then add 300 μl DNaseI stop buffer to stop the reaction.
DNA purification, digestion and Southern blotting
Add 5.8 μl DNase-free ribonuclease A (10 mg/ml) to each sample, incubate the mixture at 37°C for 2 hours, and then add 11.6 μl proteinase K (10 mg/ml) and incubate the mixture overnight at 55°C.
Purify the DNA by adding 60 μl 3M sodium acetate pH 5.4 to each sample, extracting twice with 1 volume of phenol/chloroform/isoamyl alcohol, then centrifuge at 20,800 x g at room temperature in a microfuge for 5 min.
Transfer the aqueous phase to fresh tubes, precipitate the DNA with 0.7 volumes of isopropanol, mix by inverting the tubes at least twice, incubate at -20°C for 1-2 h or overnight, then sediment the DNA by centrifugation at 20,800 x g 4°C for 10 min and rinse with ice cold 70% ethanol.
Resuspend the DNA pellets in 31 μl TE. To check the size distribution of the cleavage products electrophorese 1 μl of sample through a 1% agarose gel in 1x TAE with 0.5 μg/ml ethidium bromide.
Digest the DNA with an appropriate amount of the desired restriction endonuclease as follows. Using 1.5 ml microcentrifuge tubes, add 5 μl of the appropriate 10x restriction enzyme buffer, 30 μl of the purified DNA and DNase free H2O to a final volume of 50 μl. Add an appropriate amount of the restriction enzyme and incubate at 37°C overnight.
Fractionate the digested DNA by electrophoresis through a 25 cm 1.2-1.5% agarose/TAE gel, using 2.0 v/cm (40 v) until the bromphenol blue tracking dye has migrated across ~ 80% of the gel using standard protocols.
Transfer the DNA to a nylon filter, then hybridize to an α32P-labelled fragment from one end of the region of interest, labeled by random priming, and visualize bands using a PhosphorImager or X-ray film and standard Southern blotting methods.
Protocol IV: Treating cells with 5-azacytidine
A. Equipment
Analytical balance
0.2 micron sterilization filters and syringes
Culture vessels
Incubator
B. Reagents
5-azaC or 2'-deoxy-5-azaC (Aldrich)
Cultured cell lines in log phase growth
C. Methods
Dissolve 5-azaC or 2'-deoxy-5-azaC in PBS or tissue culture media. Typical concentrations for 5-azaC are 0.25-8.0 μM, with 1 μM most often being effective. 2'-deoxy-5-azaC is more specific for DNA methylation inhibition and is also more potent, so lower concentrations may be used. The solutions are typically made up 10-100X the desired concentrations. Both are unstable in aqueous media and must be prepared just before use.
Filter sterilize the stock solution.
Add sterilized solution to cultures of cells in S-phase. Since concentrations of both compounds that inhibit DNA methylation are only slightly lower than concentrations inhibiting DNA synthesis, a range of concentrations are typically tested. Further, the purchased chemicals have some variability in potency, so the optimal concentration for each lot should be determined.
Changes in gene expression are typically detected after 1-2 cycles of cell division, so initial studies should also include kinetic analyses. Significant cell death is also often seen.
References
- Bird AP, Wolffe AP. Methylation-induced repression-belts, braces, and chromatin. Cell. 1999;99:451–454. doi: 10.1016/S0092-8674(00)81532-9. [DOI] [PubMed] [Google Scholar]
- Attwood JT, Yung RL, Richardson BC. DNA methylation and the regulation of gene transcription. Cell Mol Life Sci. 2002;59:241–257. doi: 10.1007/s00018-002-8420-z. [DOI] [PMC free article] [PubMed] [Google Scholar]
- Richardson BC, Gold JR. Role of DNA methylation in the regulation of cell function: autoimmunity, aging and cancer. J Nutr. 2002;132(8 Suppl):2401S–2405S. doi: 10.1093/jn/132.8.2401S. [DOI] [PubMed] [Google Scholar]
- Nguyen CT, Gonzales FA, Jones PA. Altered chromatin structure associated with methylation-induced gene silencing in cancer cells: correlation of accessibility, methylation, MeCP2 binding and acetylation. Nucleic Acids Res. 2001;29:4598–4606. doi: 10.1093/nar/29.22.4598. [DOI] [PMC free article] [PubMed] [Google Scholar]
- Fraga MF, Esteller M. DNA methylation: a profile of methods and applications. Biotechniques. 2002;33(3):632, 634, 636–649. doi: 10.2144/02333rv01. [DOI] [PubMed] [Google Scholar]
- Clark SJ, Harrison J, Paul CL, Frommer M. High sensitivity mapping of methylated cytosines. Nucleic Acids Res. 1994;22:2990–2997. doi: 10.1093/nar/22.15.2990. [DOI] [PMC free article] [PubMed] [Google Scholar]
- Lu Q, Wu A, Ray D, Deng C, Attwood J, Hanash S, Pipkin M, Lichtenheld M, Richardson B. DNA methylation and chromatin structure regulate T cell perforin gene expression. J Immunol. 2003;170:5124–5132. doi: 10.4049/jimmunol.170.10.5124. [DOI] [PubMed] [Google Scholar]
- Oelke K, Lu Q, Richardson D, Wu A, Deng C, Hanash S, Richardson B. [DOI] [PubMed]
- Cornacchia E, Golbus J, Maybaum J, Strahler J, Hanash S, Richardson B. Hydralazine and procainamide inhibit T cell DNA methylation and induce autoreactivity. J Immunol. 1998;140:2197–2200. [PubMed] [Google Scholar]
- Lu Q, Kaplan M, Ray D, Zacharek S, Gutsch D, Richardson B. Demethylation of ITGAL (CD11a) regulatory sequences in systemic lupus erythematosus. Arthritis Rheum. 2002;46:1282–1291. doi: 10.1002/art.10234. [DOI] [PubMed] [Google Scholar]
- Lu Q, Ray D, Gutsch D, Richardson B. Effect of DNA methylation and chromatin structure on ITGAL expression. Blood. 2002;99:4503–4508. doi: 10.1182/blood.V99.12.4503. [DOI] [PubMed] [Google Scholar]
- Cornwell RD, Gollahon KA, Hickstein DD. Description of the leukocyte function-associated antigen 1 (LFA-1 or CD11a) promoter. Proc Natl Acad Sci USA. 1993;90:4221–4225. doi: 10.1073/pnas.90.9.4221. [DOI] [PMC free article] [PubMed] [Google Scholar]
- Yoder JA, Walsh CP, Bestor TH. Cytosine methylation and the ecology of intragenomic parasites. Trends Genet. 1997;13:355–340. doi: 10.1016/S0168-9525(97)01181-5. [DOI] [PubMed] [Google Scholar]
- Lichtenheld MG, Podack ER. Structure of the human perforin gene. A simple gene organization with interesting potential regulatory sequences. J Immunol. 1989;143:4267–4274. [PubMed] [Google Scholar]
- Zhang J, Scordi I, Smyth MJ, Lichtenheld MG. Interleukin 2 receptor signaling regulates the perforin gene through signal transducer and activator of transcription (Stat)5 activation of two enhancers. J Exp Med. 1999;190:1297–1308. doi: 10.1084/jem.190.9.1297. [DOI] [PMC free article] [PubMed] [Google Scholar]
- Jones PA. Gene activation by 5-azacytidine. In: Razin A, Cedar H, Riggs A, editors. DNA Methylation. Biochemistry and Biological Significance. New York: Springer-Verlag; 1984. p 165-187.
- Lu Q, Richardson B. DNaseI hypersensitivity analysis of chromatin structure. In: T T, editor. Methods in Molecular Biology. Volume 287. Totowa NJ: Humana Press; 2004. p 77-86. [DOI] [PubMed]
- Macnab JC, Adams RL, Rinaldi A, Orr A, Clark L. Hypomethylation of host cell DNA synthesized after infection or transformation of cells by herpes simplex virus. Mol Cell Biol. 1988;22:1443–1448. doi: 10.1128/mcb.8.4.1443. [DOI] [PMC free article] [PubMed] [Google Scholar]
- Javed A, Zaidi SK, Gutierrez SE, Lengner CJ, Harrington KS, Hovhannisyan H, Cho BC, Pratap J, Pockwinse SM, Montecino M et al. Chromatin immunoprecipitation. Methods Mol Biol. 2004;285:41–44. doi: 10.1385/1-59259-822-6:041. [DOI] [PubMed] [Google Scholar]
- Bird A. The essentials of DNA methylation. Cell. 1992;70:5–8. doi: 10.1016/0092-8674(92)90526-i. [DOI] [PubMed] [Google Scholar]
- Cihak A. Biological effects of 5-azacytidine in eukaryotes. Oncology. 1974;30:405–422. doi: 10.1159/000224981. [DOI] [PubMed] [Google Scholar]
- Nyce J, Liu L, Jones PA. Variable effects of DNA-synthesis inhibitors upon DNA methylation in mammalian cells. Nucleic Acids Res. 1986;14:4353–4367. doi: 10.1093/nar/14.10.4353. [DOI] [PMC free article] [PubMed] [Google Scholar]