Abstract
Prader–Willi syndrome (PWS) is a genetic disorder characterized by a variety of physiological and behavioral dysregulations, including hyperphagia, a condition that can lead to life-threatening obesity. Feeding behavior is a highly complex process with multiple feedback loops that involve both peripheral and central systems. The arcuate nucleus of the hypothalamus (ARH) is critical for the regulation of homeostatic processes including feeding, and this nucleus develops during neonatal life under of the influence of both environmental and genetic factors. Although much attention has focused on the metabolic and behavioral outcomes of PWS, an understanding of its effects on the development of hypothalamic circuits remains elusive. Here, we show that mice lacking Magel2, one of the genes responsible for the etiology of PWS, display an abnormal development of ARH axonal projections. Notably, the density of anorexigenic α-melanocyte-stimulating hormone axons was reduced in adult Magel2-null mice, while the density of orexigenic agouti-related peptide fibers in the mutant mice appeared identical to that in control mice. On the basis of previous findings showing a pivotal role for metabolic hormones in hypothalamic development, we also measured leptin and ghrelin levels in Magel2-null and control neonates and found that mutant mice have normal leptin and ghrelin levels. In vitro experiments show that Magel2 directly promotes axon growth. Together, these findings suggest that a loss of Magel2 leads to the disruption of hypothalamic feeding circuits, an effect that appears to be independent of the neurodevelopmental effects of leptin and ghrelin and likely involves a direct neurotrophic effect of Magel2.
Introduction
Prader–Willi syndrome (PWS) is a rare genetic disorder characterized by severe hypotonia and a failure to thrive in infancy, which is followed by hyperphagia, morbid obesity and neurobehavioral abnormalities. PWS results from a lack of expression of several paternally inherited, imprinted contiguous genes that are located in chromosomal region 15q11-13 (1). Among the genes that are inactivated in PWS, MAGEL2 is of particular interest because it is highly expressed in brain regions that are involved in metabolic regulation, including the hypothalamus (2–4).
The central nervous system regulates body weight and energy homeostasis through a distributed and interconnected neural network (5). The hypothalamus has been considered central to this regulation, in part because this brain region can integrate hormonal, autonomic and somatomotor control mechanisms and, in turn, induce a variety of neuroendocrine and homeostatic responses. At the core of this hypothalamic regulatory network is the arcuate nucleus of the hypothalamus (ARH). The ARH contains two chemically distinct neuronal populations that have opposite roles in energy balance regulation: pro-opiomelanocortin (POMC) neurons, which are anorexigenic, and agouti-related peptide/neuropeptide Y (AgRP/NPY) neurons, which are orexigenic. NPY/AgRP and POMC neurons provide overlapping projections to other parts of the hypothalamus, including the paraventricular (PVH) and dorsomedial (DMH) nuclei of the hypothalamus, to exert effects on feeding and energy balance (6,7).
Because of the importance of the hypothalamus in the control of eating and energy balance, it has been suggested that impairments of hypothalamic development during perinatal life may result in lifelong metabolic dysregulation (8–10). In mice, ARH neural projections develop primarily during the first 3 weeks of postnatal life and a variety of animal models of obesity and metabolic programming have been associated with impairments in hypothalamic development (11–14). While it is not yet known whether PWS causes alterations to hypothalamic development, hyperghrelinemia is recognized as an endocrine hallmark of patients with PWS (15), and elevated levels of ghrelin are found as early as infancy, which is significantly earlier than the onset of obesity and hyperphagia (16,17). Notably, neonatal ghrelin has recently emerged as a critical regulator of hypothalamic development, supporting the hypothesis that PWS might be associated with alterations in hypothalamic development.
In this study, we examined whether loss of Magel2 influences the development and organization of hypothalamic circuits involved in feeding and energy balance regulation. On the basis of the recently documented role of neonatal metabolic hormones in brain development and lifelong metabolic regulations (10), we also studied the temporal patterns of circulating leptin and ghrelin levels in Magel2-null mice during important periods of hypothalamic development. Furthermore, we tested the ability of Magel2 to directly influence axon growth in vitro.
Results
Magel2 mRNA is expressed during an important period of hypothalamic development
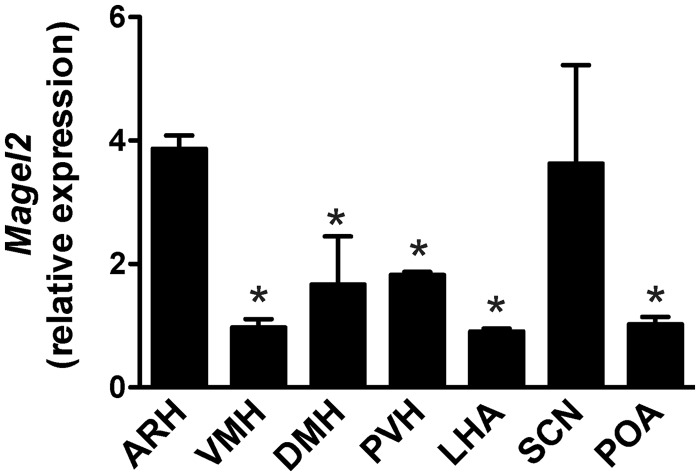
To assess the potential role of Magel2 in the development of hypothalamic feeding circuits, we first examined the expression pattern of Magel2 mRNA in the hypothalamus of neonatal mice. Our results showed that Magel2 mRNA is expressed in the mouse hypothalamus at postnatal day 10 (P10) (Fig. 1). Notably, Magel2 mRNA levels were four times higher in the ARH than in the ventromedial nucleus (VMH), DMH, PVH, lateral hypothalamis area (LHA) and preoptic area (POA) (Fig. 1). Magel2 mRNA expression was also elevated in the suprachiasmatic nucleus (SCN) (Fig. 1)
Figure 1.
Magel2 mRNA expression in the postnatal hypothalamus. Relative expression of Magel2 mRNA in hypothalamic nuclei of P10 wild-type mice (n = 3 per group). ARH, DMH, lateral hypothalamic area, POA, PVH, SCN and VMH. Values are shown as the mean ± SEM. *P < 0.05 versus the ARH.
Magel2-null mice display abnormal development of anorexigenic POMC neuronal projections
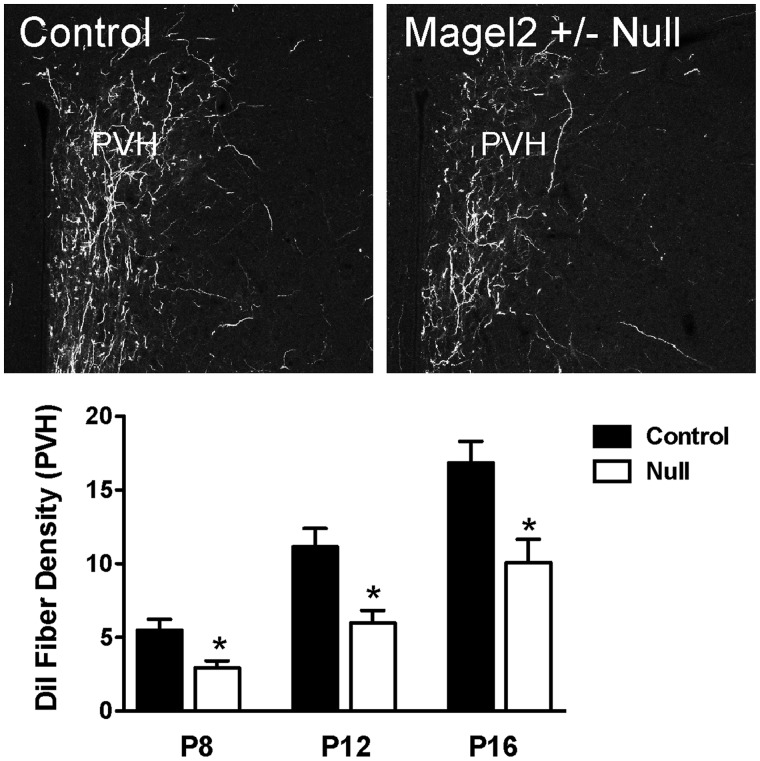
During development, axonal projections extend from ARH neurons to reach their target nuclei, including metabolically relevant nuclei such as the PVH, during the second week of postnatal life (18). To examine the development and architecture of the hypothalamic neural circuits involved in feeding regulation in a mouse model of PWS, we used Magel2-null mice (19–21). Magel2 is one of the protein-coding genes in the PWS domain (21,22). We first investigated whether Magel2-null mice displayed changes in the pattern of ARH axonal projections by implanting the fluorescent axonal tracer DiI into the ARH of Magel2-null and control neonatal mice. Although the overall distribution of ARH DiI-labeled fibers was relatively similar between Magel2-null and control neonatal mice, we observed clear differences in the density of the labeled fibers. In the PVH of P8 Magel2-null mice, there were 1.8 times fewer labeled axons when compared to the control mice (Fig. 2). The density of ARH axons in the PVH was increased in both Magel2-null and control mice on P12 and P16, but those of Magel2-null remained 1.5–2.0 times lower (Fig. 2).
Figure 2.
Development of ARH neural projections is disrupted in Magel2-null mice. Confocal images and quantification of the density of arcuate DiI-labeled fibers innervating the PVH in P8, P12 and P16 Magel2-null and control pups (n = 4–6 per group). Values are shown as the mean ± SEM. *P < 0.05 versus the control.
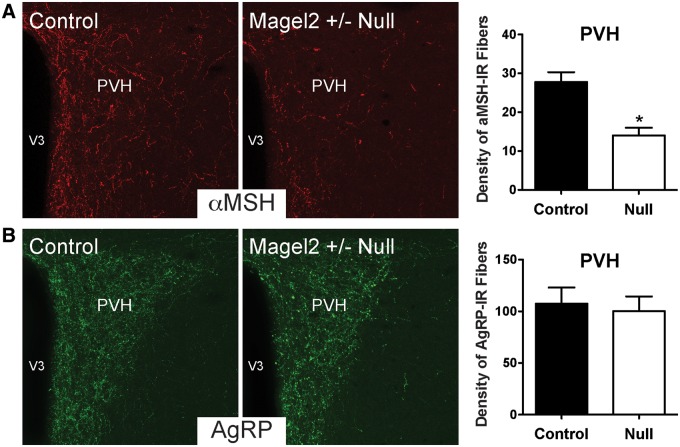
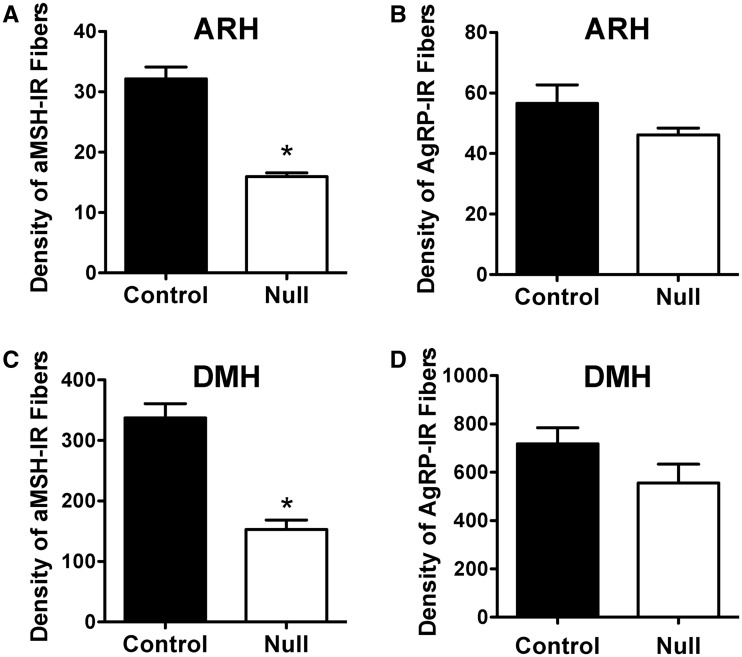
To determine whether the defect in ARH projections that was observed in Magel2-null neonatal mice was permanent, we performed immunohistochemical labeling for alpha-melanocyte stimulating hormone (aMSH) and agouti-related protein (AgRP), which are two key neuropeptidergic factors expressed in the ARH. aMSH is a cleavage product of POMC and represents an important anorectic signal, whereas AgRP is a major orexigenic regulator produced in the ARH. The density of aMSH fibers in the PVH of Magel2-null mice was 2-fold lower than that observed in control mice (Fig. 3A). A substantial reduction in the density of aMSH-labeled fibers was observed in both the parvocellular and magnocellular regions of the PVH (data not shown). Similar decreases in aMSH fiber densities were also observed in the DMH, which is another terminal field of ARH projections, and in the ARH itself (Fig. 4A and C). We also examined the density of neural projections that contained AgRP; in contrast to neural projections that contained aMSH, the density of AgRP-labeled fibers innervating the PVH, DMH and ARH appeared normal in Magel-null mice (Figs 3B, 4B and 4D).
Figure 3.
Altered aMSH neural projections to the PVH in Magel2-null mice. Confocal images and quantification of (A) aMSH and (B) AgRP immunoreactive fibers innervating the PVH in adult (P60) Magel2-null and control mice (n = 4–5 per group). V3, third ventricle. Values are shown as the mean ± SEM. *P < 0.05 versus the control.
Figure 4.
Disruption of hypothalamic aMSH neural projections in Magel2-null mice. Quantification of (A, C) aMSH and (B, D) AgRP immunoreactive fibers innervating the (A, B) ARH and (C, D) DMH in adult (P60) Magel2-null and control mice (n = 4–5 per group). Values are shown as the mean ± SEM. *P < 0.05 versus the control.
Normal levels of ghrelin and leptin in Magel2-null neonates
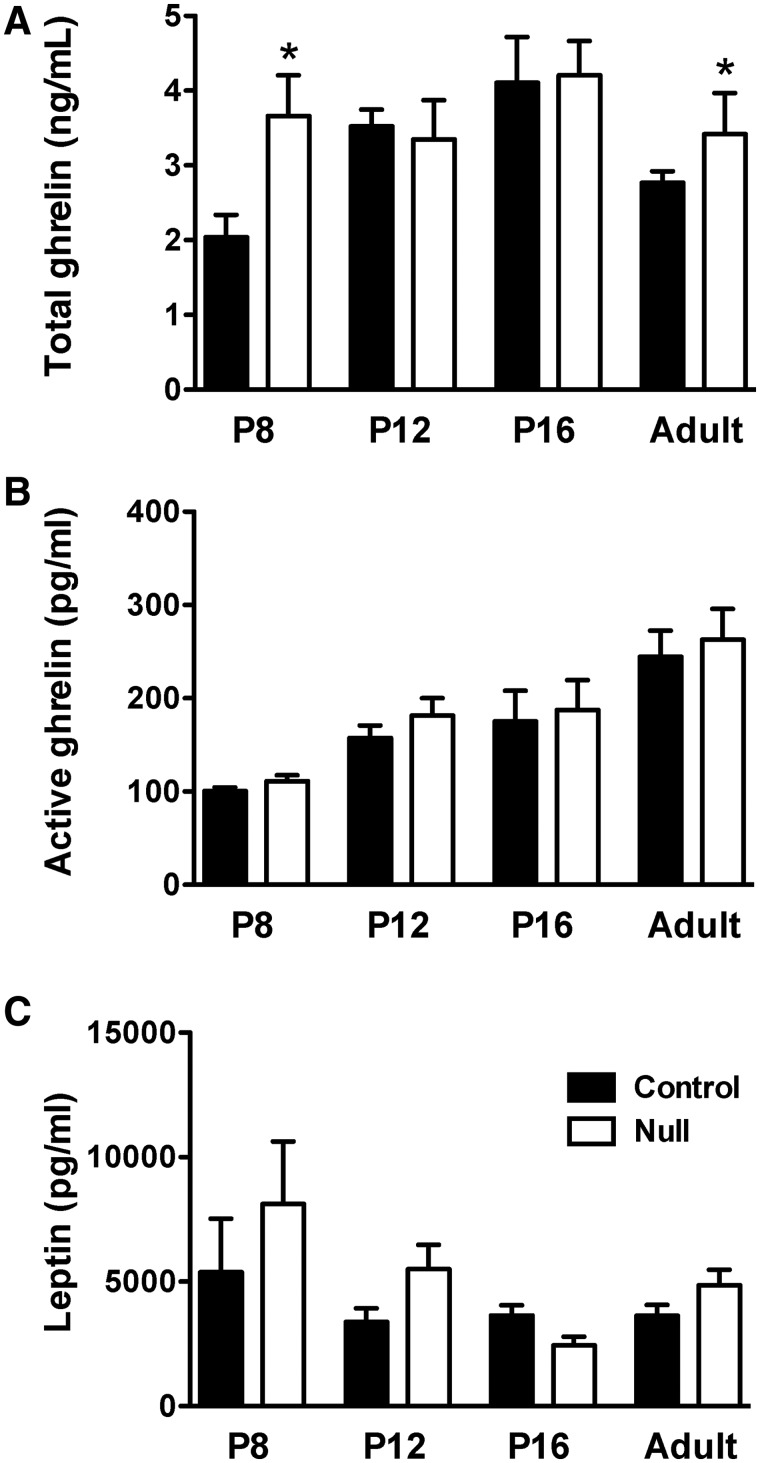
Hyperghrelinemia is one of the hallmark symptoms of PWS, and patients with PWS display elevated levels of circulating ghrelin as early as 2 years of age, i.e. before they develop obesity and hyperphagia (16,17). In addition, recent data from our laboratory revealed that chronic neonatal hyperghrelinemia in mice resulted in the abnormal development of projection pathways from the ARH, leading to lifelong metabolic disturbances (23). On the basis of these observations, we next examined whether Magel2-null mice display abnormally elevated ghrelin levels during early life. Magel2-null and control mice were sacrificed on P8, P12, P16 and P60 (adult), and trunk blood was collected and assayed for total and acylated ghrelin. Magel2-null mice displayed elevated levels of total ghrelin at P8 (Fig. 5A). However, levels of the acylated form of ghrelin (the ‘active’ form) were normal in P8 Magel2-null mice (Fig. 5B). In addition, the levels of both total and acylated ghrelin appeared similar between Magel2-null and control mice at P12 and at P16 (Fig. 5A and B). Moreover, the total ghrelin levels were increased in adult Magel2-null mice, whereas acylated ghrelin levels appeared normal in adult mutant mice (Fig. 5A and B). Because leptin exerts a neurotrophic effect on ARH neurons during postnatal life (24,25) we also examined leptin levels, and they appeared normal in Magel2-null mice (Fig. 5C). These findings suggest that the abnormal development of arcuate POMC projections observed in Magel2-null mice is not likely caused by changes in ghrelin or leptin levels during critical periods of development but is rather the consequence of other intrinsic factors.
Figure 5.
Plasma ghrelin and leptin levels in Magel2-null mice. (A) Total plasma ghrelin levels, (B) acylated ghrelin and (C) leptin levels in P8, P12, P16 and adult (P60) Magel2-null (red bars) and control (black bars) mice (n= 4–5 per group). Values are shown as the mean ± SEM. *P < 0.05 versus the control.
Magel2 promotes axon growth in vitro
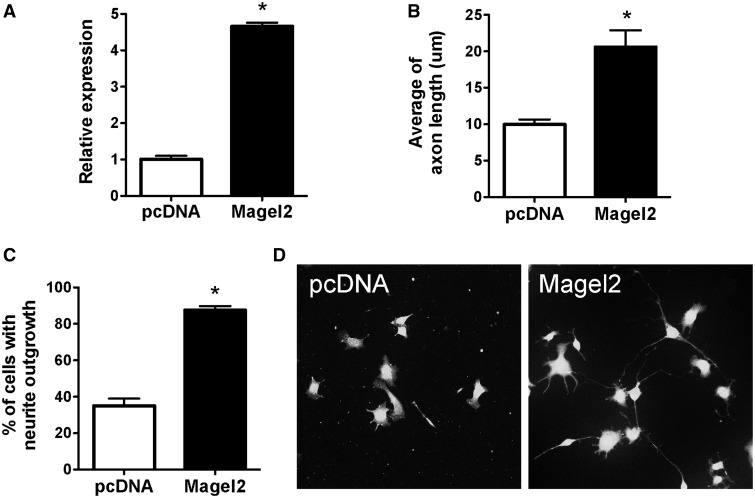
Because the neurodevelopmental defects observed in Magel-null mice unlikely involve hormonal factors, we next evaluated the ability of Magel2 to directly influence axon growth in vitro. To this aim, we stably expressed Magel2 in mouse neuroblastoma N2a cells (Fig. 6A), which do not express endogenous Magel2. The pcDNA (vector) was stably expressed as control (Fig. 6A). We then differentiated these cells and measured axon growth. Compared with the control N2a cells, the length of anti- growth associated protein-43 (GAP-43)-positive neurites extending from each cell was 2 times longer in cells expressing high levels of Magel2 (Fig 6B–D). In addition, the proportion of cells displaying axons was 2.5 times greater in cells expressing high levels of Magel2 (Fig. 6C and D). These observations provide direct evidence that Magel2 functions as an essential factor for neurite outgrowth.
Figure 6.
Magel2 promotes neurite outgrowth. (A) Relative expression of Magel2 mRNA in N2a cells transfected with a Magel2 or an empty (pcDNA) vector. (B) Quantification of neurite length and (C) percentage of cells with neurites in N2a after transfection with a Magel2 or an empty (pcDNA) vector. (D) Representative images showing GAP-43-immunopositive fibers, an axonal marker, in N2a cells transfected with a Magel2 or an empty (pcDNA) vector.
Discussion
It is generally accepted that PWS leads to a variety of neuroendocrine and metabolic alterations that likely due to hypothalamic dysregulation (26). However, the association between PWS genes and the development of hypothalamic feeding circuits has not been examined. The axonal labeling experiments presented here show that mice lacking Magel2, one of the genes inactivated in PWS, display disrupted development of ARH axonal projections when compared to wild-type mice. Notably, some of the most severely affected projections were those that contained aMSH, a neuropeptide that acts as a major negative regulator of energy balance. In contrast, neural projections that contained AgRP, a neuropeptidergic factor that drives feeding behavior, appeared relatively unaffected in Magel2-null mice. Our in vitro experiments also suggest that these changes in neural wiring likely involve a direct neurotrophic effect of Magel2.
The precise mechanisms that underlie the reduction in POMC fiber density in Magel2-null mice remain unknown. Because of the observation that PWS patients exhibit hyperghrelinemia during infancy (16,17), before the onset of hyperphagia, as well as recent findings in our laboratory showing that neonatal ghrelin plays a critical role in the normal development of arcuate axonal projections (23), we initially hypothesized that Magel2-null mice would exhibit prematurely elevated levels of ghrelin that could disrupt the development of ARH projections. However, the levels of the acylated form of ghrelin (the ‘active’ form) appeared normal in Magel2-null mice. Another hormonal factor that is involved in hypothalamic development is leptin. Leptin levels exhibit a surge during the first 2 weeks of postnatal life, and the loss of leptin or its receptors is associated with the altered development of ARH projections (24,25). Intriguingly, adult Magel2-null mice display central leptin resistance (27). However, Pravdivyi et al. (28) recently reported a normal leptin response in the hypothalamus of Magel2-null mice until the postnatal age of 4 weeks. Moreover, our data indicate that leptin levels are similar between Magel2-null and control neonates. Together, these observations suggest that changes in ghrelin or leptin signaling are not likely mediators of the disrupted development of ARH projections observed in Magel2-null mice.
MAGEL2 is a member of the type II melanoma antigen (MAGE) family (29). The human MAGEL2 gene and its mouse homolog Magel2 are located in the human 15q11-q13 chromosome and mouse 7C region, respectively (30). This gene encodes a ubiquitin ligase enhancer, which is required for endosomal protein recycling (31). During development, Magel2 is initially expressed in the mouse central nervous system, including the neural tube, telencephalon, hindbrain, midbrain and hypothalamus, as early as embryonic day 9 (2–4). The highest levels of Magel2 mRNA are found in E15-E17 embryos. Magel2 continues to be expressed in the hypothalamus during postnatal life, with a particularly high level of expression found in the arcuate and suprachiasmatic nuclei (our findings and 4). In agreement with this elevated expression of Magel2 in the SCN, recent data indicate that Magel2 plays a role in the regulation of circadian rhythm (4,32). Our in vitro data also revealed that Magel2 can directly act as a developmental factor by promoting axon growth. Previous data reported that necdin, which is another member of the type II MAGE family and shares 51% amino acid sequence homology to MAGEL2 (22,33), influence neurotrophin signaling, cytoskeletal rearrangement, as well as neurite extension and axon bundling and pathfinding (34–37). Together these observations indicate that PWS locus genes, including Magel2 and necdin, can exert direct neurotrophic actions and influence brain development.
Many of the features of PWS suggest that brain abnormalities play an important role in the clinical phenotype. The most common hypothesis is that hypothalamic and pituitary dysfunction is responsible for many of the features of this syndrome. Consistent with the idea that PWS results in a variety of structural and functional brain alterations, magnetic resonance imaging (MRI) analyses have shown a reduction in brain volume in Magel2-null mice and in individuals with PWS (38,39). In addition, functional imaging (fMRI) has shown an altered response of the brain of patients with PWS to metabolic cues, such as glucose and food stimuli (40,41). However, the study of changes in specific neural systems using MRI and fMRI has been limited, in part, by instrument resolution. Nevertheless, immunohistochemical approaches have revealed that Magel2-null mice and PWS patients display a dramatic reduction in the number of oxytocin neurons in the PVH (20,42). Remarkably, a single subcutaneous injection of oxytocin in Magel2-null mice at birth is sufficient to rescue the neonatal suckling deficiencies that cause neonatal death as well as ameliorate social and cognitive behavior in adults (20,43). These findings support a role for oxytocin in feeding systems during early development. More recently, data from Dr. Wevrick’s lab show that adult Magel2-null mice display a reduction in the number of POMC-positive cells, which is accompanied by a reduced density of aMSH fibers innervating the PVH (27,28). Our data expand upon these findings and show that the loss of Magel2 results in the widespread disruption of aMSH-containing projections to each terminal field involved in appetite regulation, including those to the PVH, DMH and ARH. Our data also suggest that these structural alterations are developmentally acquired. However, not all of the neuropeptidergic systems involved in feeding regulation appear to be disrupted in PWS. For example, the number of AgRP/NPY and GHRH neurons in the infundibular nucleus (human equivalent of the mouse ARH) (44,45) and of orexin neurons in the lateral hypothalamus (46) is not altered in PWS. In addition, our data indicate that AgRP-containing projections are not disrupted in Magel2-null mice. Nevertheless, the marked reduction in aMSH-containing fibers compared to AgRP axons in Magel2-null mice suggests an elevated ratio of orexigenic to anorexigenic projections in this mouse model of PWS.
Materials and Methods
Animals
Magel2-null mice (Jax Mice stock number 009062) (19) were used in this study. Mice were housed in individual cages under specific pathogen-free conditions and maintained in a temperature-controlled room with a 12-h light/dark cycle. The animals were provided with ad libitum access to water and standard laboratory chow (Special Diet Services). The Magel2 mouse colony was maintained on a C57Bl/6 background by breeding Magel2+/- female mice that carried a maternally inherited Magel2-lacZ knock-in allele with C57Bl/6 male mice to generate heterozygous, functionally wild-type offspring. Because of imprinting that silences the maternally inherited allele, Magel2-null mice retained expression only from the paternally inherited lacZ knock-in allele. C57Bl/6 female mice were bred with Magel2+/- male mice that carried a maternally inherited Magel2-lacZ knock-in allele. This breeding strategy generated Magel2+/− mice that carried a paternally inherited lacZ knock-in allele (Magel2-null) and Magel2+/+ (control littermate) offspring. Mice were genotyped prior to sacrifice. For all experiments, 1 day after birth, the litter size was adjusted to six pups to ensure adequate and standardized nutrition until weaning (P22). Only male mice were studied. Animal usage was in compliance with and approved by the Institutional Animal Care and Use Committee of the Saban Research Institute of the Children’s Hospital of Los Angeles, and all experiments were performed in accordance with the European Communities Council Directive of November 24, 1986 (86/609/EEC) regarding mammalian research
Ghrelin and leptin assays
Male Magel2-null and control mice were decapitated on P8, P12, P16 and P60 (adult) (n = 4–5 per group), and trunk blood was collected in a chilled tube containing Pefabloc (AEBSF, Roche Diagnostics). Total and acylated ghrelin as well as leptin levels in the plasma were assayed using enzyme-linked immunosorbent assay (ELISA) kits (Millipore) as previously described (23,47).
Measurement of Magel2 mRNA
The ARH, VMH, DMH, PVH, LHA, SCN and POA of P10 wild-type mice (n = 3) were microdissected. Briefly, mice were decapitated, fresh brains were collected in RNALater (Ambion) and sectioned at 200 µm using a vibratome. Regions of interest were then identified under a steromicroscope and dissected out using a 1-mm diameter sample corer. Total RNA was isolated using the Arcturus PicoPure RNA isolation kit (Invitrogen). cDNA was generated with the high-capacity cDNA Reverse Transcription Kit (Applied Biosystems). Quantitative real-time polymerase chain reaction (PCR) analysis was performed using TaqMan Fast Universal PCR MasterMix. mRNA expression was calculated using the 2-ddCt method after normalization with Gapdh as a housekeeping gene. Inventoried TaqMan Gene Expression Assays for Magel2 (Mm00844026_s1) and Gapdh (Mm99999915_g1) were used. All assays were performed using an Applied Biosystem 7900 HT real-time PCR system.
DiI implants
Magel2-null and control mouse pups (n = 4–6 per group) were perfused on P8, P12 and P16 with 4% paraformaldehyde. The brains were removed and numerically coded to insure unbiased processing and analysis. Crystals of 1,1’-dioctadecyl-3,3,3’,3’-tetramethylindocarbocyanine perchlorate (DiI; Santa Cruz) were implanted as previously described (24). Briefly, an insect pin was used to place a crystal of DiI (15 µm in diameter) into the ARH of each brain under visual guidance. After incubation in the dark for 2 weeks at 37ºC, hypothalamic sections were collected from each brain and evaluated by confocal microscopy as described below.
AgRP and aMSH immunohistochemistry
Magel2-null and control mice (n = 4–5 per group) were perfused transcardially with 4% paraformaldehyde at P60. The brains were then frozen and sectioned at a 30-µm thickness and processed for immunofluorescence using standard procedures (24). The primary antibodies used for immunohistochemistry included rabbit anti-AgRP (1:4000, Phoenix Pharmaceuticals) and sheep anti-aMSH (1:40 000, Millipore). The primary antibodies were visualized with Alexa Fluor 488 goat anti-rabbit IgGs or Alexa Fluor 568 donkey anti-sheep IgGs (1:200, Invitrogen). Sections were counterstained using bis-benzamide (1:10 000, Invitrogen) to visualize cell nuclei and coverslipped with Fluoromount (Sigma-Aldrich).
Quantitative analysis of fiber density
Two sections through the PVH, ARH and DMH from animals of each experimental group were acquired using a Zeiss LSM 710 confocal system equipped with a 20X objective. Slides were numerically coded to obscure the treatment group. Image analysis was performed using ImageJ analysis software (NIH). For the quantitative analysis of fiber density (for DiI, α-MSH, AgRP), each image plane was binarized to isolate labeled fibers from the background and to compensate for differences in fluorescence intensity. The integrated intensity, which reflects the total number of pixels in the binarized image, was then calculated for each image. This procedure was conducted for each image plane in the stack, and the values for all image planes in a stack were summed. The resulting value is an accurate index of the density of the processes in the volume sampled (24).
N2a cell culture and transfection
N2a cells were cultured in Dulbecco’s modified Eagle’s medium supplemented with 10% fetal bovine serum, GlutaMAX™-I, 100 U/ml penicillin and 100 µg/ml streptomycin at 37 °C in 5% CO2 in a humidified atmosphere. To induce differentiation, growth medium was carefully removed and then replaced with Neurobasal medium supplemented with GlutaMAX™-I for 3 days. For transfection, approximately 5 × 10⁴ cells were plated into 24-well plates. Cells were transfected with either Magel2 (Genscript) or pcDNA3.1(+) (Invitrogen) plasmid using Lipofectamine LTX with PLUS reagent (Invitrogen) according to the manufacturer’s instructions.
Immunocytochemistry and quantification of neurite outgrowth
After 3 days in differentiation medium, transfected cells were then washed in phosphate-buffered saline, fixed in 4% paraformaldehyde and processed for immunofluorescence using standard procedures. The primary antibody used for immunocytochemistry was a rabbit GAP-43 (1:5000, Millipore). The primary antibody was visualized with Alexa Fluor 488 goat anti-rabbit IgGs (1:200, Invitrogen). Cultures were counterstained with 4,6-diamindino-2-phenylindole to visualize cell nuclei.
To quantify the number of cells expressing neurites and measure neurite length, images were acquired using a Zeiss LSM 710 confocal system equipped with a 20X objective. Five random fields were examined from each well, giving a total cell count of at least 100 cells/well. Each data point represents the mean of four individual wells. Image analysis was performed using the MetaMorph 7.0 neurite outgrowth application module. Briefly, the percentage of cells expressing neurites and the average neurite length was scored. Cells with neurites were defined as cellular extensions greater than two cell body diameters in length. Neurite length was measured as the distance from the center of the cell soma to the tip of its longest neurite.
Statistical analysis
All values were expressed as the mean ± SEM. Statistical analyses were conducted using GraphPad PRISM (version 5.0a). Statistical significance was determined using unpaired, two-tailed Student’s t tests and a two-way analysis of variance followed by the Bonferroni post hoc test when appropriate. P < 0.05 was considered statistically significant.
Acknowledgements
We would like to thank Li Liu and Aleek Aintablian for the expert technical assistance.
Conflict of interest statement. None declared.
Funding
Foundation for Prader-Willi Research (to S.G.B.), the National Institutes of Health (Grants R01DK84142, R01DK102780 and P01ES022845 to S.G.B.), the United States Environment Protection Agency (Grant RD83544101); the European Commission Seventh Framework Program integrated project (grant agreement no. 266408, ‘Full4Health’, to S.G.B.).
References
- 1.Hanel M., Wevrick R. (2001) The role of genomic imprinting in human developmental disorders: lessons from Prader–Willi syndrome. Clin. Genet., 59, 156–164. [DOI] [PubMed] [Google Scholar]
- 2.Lee S., Kozlov S., Hernandez L., Chamberlain S.J., Brannan C.I., Stewart C.L., Wevrick R. (2000) Expression and imprinting of MAGEL2 suggest a role in Prader–Willi syndrome and the homologous murine imprinting phenotype. Hum. Mol. Genet., 9, 1813–1819. [DOI] [PubMed] [Google Scholar]
- 3.Lee S., Walker C.L., Wevrick R. (2003) Prader–Willi syndrome transcripts are expressed in phenotypically significant regions of the developing mouse brain. Gene Expr. Patterns, 3, 599–609. [DOI] [PubMed] [Google Scholar]
- 4.Kozlov S.V., Bogenpohl J.W., Howell M.P., Wevrick R., Panda S., Hogenesch J.B., Muglia L.J., Van Gelder R.N., Herzog E.D., Stewart C.L. (2007) The imprinted gene Magel2 regulates normal circadian output. Nat. Genet., 39, 1266–1272. [DOI] [PubMed] [Google Scholar]
- 5.Grill H.J. (2006) Distributed neural control of energy balance: contributions from hindbrain and hypothalamus. Obesity, 14, 216S–221S. [DOI] [PubMed] [Google Scholar]
- 6.Broberger C., Johansen J., Johansson C., Schalling M., Hokfelt T. (1998) The neuropeptide Y/agouti gene-related protein (AGRP) brain circuitry in normal, anorectic, and monosodium glutamate-treated mice. Proc. Natl. Acad. Sci. USA., 95, 15043–15048. [DOI] [PMC free article] [PubMed] [Google Scholar]
- 7.Cone R.D. (2005) Anatomy and regulation of the central melanocortin system. Nat. Neurosci., 8, 571–578. [DOI] [PubMed] [Google Scholar]
- 8.Levin B.E. (2000) The obesity epidemic: metabolic imprinting on genetically susceptible neural circuits. Obesity Res., 8, 342–347. [DOI] [PubMed] [Google Scholar]
- 9.Horvath T.L., Bruning J.C. (2006) Developmental programming of the hypothalamus: a matter of fat. Nat. Med., 12, 52–53. [DOI] [PubMed] [Google Scholar]
- 10.Bouret S., Levin B.E., Ozanne S.E. (2015) Gene-environment interactions controlling energy and glucose homeostasis and the developmental origins of obesity. Physiol. Rev., 95, 47–82. [DOI] [PMC free article] [PubMed] [Google Scholar]
- 11.Kirk S.L., Samuelsson A.M., Argenton M., Dhonye H., Kalamatianos T., Poston L., Taylor P.D., Coen C.W. (2009) Maternal obesity induced by diet in rats permanently influences central processes regulating food intake in offspring. PLoS One, 4, e5870. [DOI] [PMC free article] [PubMed] [Google Scholar]
- 12.Grayson B.E., Levasseur P.R., Williams S.M., Smith M.S., Marks D.L., Grove K.L. (2010) Changes in melanocortin expression and inflammatory pathways in fetal offspring of nonhuman primates fed a high-fat diet. Endocrinology, 151, 1622–1632. [DOI] [PMC free article] [PubMed] [Google Scholar]
- 13.Bouret S.G., Gorski J.N., Patterson C.M., Chen S., Levin B.E., Simerly R.B. (2008) Hypothalamic neural projections are permanently disrupted in diet-induced obese rats. Cell Metab., 7, 179–185. [DOI] [PMC free article] [PubMed] [Google Scholar]
- 14.LaBelle D.R., Cox J.M., Dunn-Meynell A.A., Levin B.E., Flanagan-Cato L.M. (2009) Genetic and dietary effects on dendrites in the rat hypothalamic ventromedial nucleus. Physiol. Behav., 98, 511–516. [DOI] [PMC free article] [PubMed] [Google Scholar]
- 15.Cummings D.E., Clement K., Purnell J.Q., Vaisse C., Foster K.E., Frayo R.S., Schwartz M.W., Basdevant A., Weigle D.S. (2002) Elevated plasma ghrelin levels in Prader−Willi syndrome. Nat. Med., 8, 643–644. [DOI] [PubMed] [Google Scholar]
- 16.Feigerlová E., Diene G., Conte-Auriol F., Molinas C., Gennero I., Salles J.P., Arnaud C., Tauber M. (2008) Hyperghrelinemia precedes obesity in Prader-Willi syndrome. J. Clin. Endocrinol. Metab., 93, 2800–28005. [DOI] [PubMed] [Google Scholar]
- 17.Kweh F.A., Miller J.L., Sulsona C.R., Wasserfall C., Atkinson M., Shuster J.J., Goldstone A.P., Driscoll D.J. (2015) Hyperghrelinemia in Prader-Willi syndrome begins in early infancy long before the onset of hyperphagia. Am. J. Med. Genet. Part A., 167, 69–79. [DOI] [PMC free article] [PubMed] [Google Scholar]
- 18.Bouret S.G., Draper S.J., Simerly R.B. (2004) Formation of projection pathways from the arcuate nucleus of the hypothalamus to hypothalamic regions implicated in the neural control of feeding behavior in mice. J. Neurosci., 24, 2797–2805. [DOI] [PMC free article] [PubMed] [Google Scholar]
- 19.Bischof J.M., Stewart C.L., Wevrick R. (2007) Inactivation of the mouse Magel2 gene results in growth abnormalities similar to Prader-Willi syndrome. Hum. Mol. Genet., 16, 2713–2719. [DOI] [PubMed] [Google Scholar]
- 20.Schaller F., Watrin F., Sturny R., Massacrier A., Szepetowski P., Muscatelli F. (2010) A single postnatal injection of oxytocin rescues the lethal feeding behaviour in mouse newborns deficient for the imprinted Magel2 gene. Hum. Mol. Genet., 19, 4895–4905. [DOI] [PubMed] [Google Scholar]
- 21.Bervini S., Herzog H. (2013) Mouse models of Prader–Willi Syndrome: a systematic review. Front. Neuroendocrinol., 34, 107–119. [DOI] [PubMed] [Google Scholar]
- 22.Cassidy S.B., Schwartz S., Miller J.L., Driscoll D.J. (2012) Prader-Willi syndrome. Genet. Med., 14, 10–26. [DOI] [PubMed] [Google Scholar]
- 23.Steculorum S.M.C.G., Coupe B., Croizier S., Andrews Z., Jarosch F., Klussmann S., Bouret S.G. (2015) Ghrelin programs development of hypothalamic feeding circuits. J. Clin. Invest., 125, 846–858. [DOI] [PMC free article] [PubMed] [Google Scholar]
- 24.Bouret S.G., Draper S.J., Simerly R.B. (2004) Trophic action of leptin on hypothalamic neurons that regulate feeding. Science, 304, 108–110. [DOI] [PubMed] [Google Scholar]
- 25.Bouret S.G., Bates S.H., Chen S., Myers M.G., Simerly R.B. (2012) Distinct roles for specific leptin receptor signals in the development of hypothalamic feeding circuits. J. Neurosci., 32, 1244–1252. [DOI] [PMC free article] [PubMed] [Google Scholar]
- 26.Tennese A.A., Wevrick R. (2011) Impaired hypothalamic regulation of endocrine function and delayed counterregulatory response to hypoglycemia in Magel2-null mice. Endocrinology, 152, 967–978. [DOI] [PMC free article] [PubMed] [Google Scholar]
- 27.Mercer R.E., Michaelson S.D., Chee M.J.S., Atallah T.A., Wevrick R., Colmers W.F. (2013) Magel2 is required for leptin-mediated depolarization of POMC neurons in the hypothalamic arcuate nucleus in mice. PLoS Genet., 9, e1003207. [DOI] [PMC free article] [PubMed] [Google Scholar]
- 28.Pravdivyi I., Ballanyi K., Colmers W.F., Wevrick R. (2015) Progressive postnatal decline in leptin sensitivity of arcuate hypothalamic neurons in the Magel2-null mouse model of Prader–Willi syndrome. Hum. Mol. Genet., 24, 4276–4283. [DOI] [PubMed] [Google Scholar]
- 29.Bazeley P., Shepelev V., Talebizadeh Z., Butler M.G., Fedorova L., Filatov V. A. F., (2008) snoTARGET shows that human orphan snoRNA targets locate close to alternative splice junctions. Gene, 408, 172–179. [DOI] [PMC free article] [PubMed] [Google Scholar]
- 30.Boccaccio I., Glatt-Deeley H., Watrin F., Roëckel N., Lalande M., Muscatelli F. (1999) The human Magel2 gene and its mouse homologue are paternally expressed and mapped to the Prader-Willi region. Hum. Mol. Genet., 8, 2497–2505. [DOI] [PubMed] [Google Scholar]
- 31.Doyle J.M., Gao J., Wang J., Yang M., Potts P.R. (2010) MAGE-RING protein complexes comprise a family of E3 ubiquitin ligases. Mol. Cell, 39, 963–974. [DOI] [PMC free article] [PubMed] [Google Scholar]
- 32.Devos J., Weselake S.V., Wevrick R. (2011) Magel2, a Prader-Willi syndrome candidate gene, modulates the activities of circadian rhythm proteins in cultured cells. J. Circadian Rhythms, 9, 12-12. [DOI] [PMC free article] [PubMed] [Google Scholar]
- 33.Jay P., Rougeulle C., Massacrier A., Moncla A., Mattel M.G., Malzac P., Roeckel N., Taviaux S., Berge Lefranc J.L., Cau P. et al. (1997) The human necdin gene, NDN, is maternally imprinted and located in the Prader-Willi syndrome chromosomal region. Nat. Genet., 17, 357–361. [DOI] [PubMed] [Google Scholar]
- 34.Kuwako K., Hosokawa A., Nishimura I., Uetsuki T., Yamada M., Nada S., Okada M., Yoshikawa K. (2005) Disruption of the paternal Necdin gene diminishes TrkA signaling for sensory neuron survival. J. Neurosci., 25, 7090–7099. [DOI] [PMC free article] [PubMed] [Google Scholar]
- 35.Tcherpakov M., Bronfman F.C., Conticello S.G., Vaskovsky A., Levy Z., Niinobe M., Yoshikawa K., Arenas E., Fainzilber M. (2002) The p75 neurotrophin receptor interacts with multiple MAGE proteins. J. Biol. Chem., 277, 49101–49104. [DOI] [PubMed] [Google Scholar]
- 36.Pagliardini S., Ren J., Wevrick R., Greer J.J. (2005) Developmental abnormalities of neuronal structure and function in prenatal mice lacking the Prader-Willi syndrome gene necdin. Am. J. Pathol., 167, 175–191. [DOI] [PMC free article] [PubMed] [Google Scholar]
- 37.Lee S., Walker C.L., Karten B., Kuny S.L., Tennese A.A., O'Neill M.A., Wevrick R. (2005) Essential role for the Prader–Willi syndrome protein necdin in axonal outgrowth. Hum. Mol. Genet., 14, 627–637. [DOI] [PubMed] [Google Scholar]
- 38.Mercer R.E., Kwolek E.M., Bischof J.M., van Eede M., Henkelman R.M., Wevrick R. (2009) Regionally reduced brain volume, altered serotonin neurochemistry, and abnormal behavior in mice null for the circadian rhythm output gene Magel2. Am. J. Med. Genet. B Neuropsychiatr. Genet., 150B, 1085–1099. [DOI] [PubMed] [Google Scholar]
- 39.Miller J.L., Couch J.A., Schmalfuss I., He G., Liu Y., Driscoll D.J. (2007) Intracranial abnormalities detected by three-dimensional magnetic resonance imaging in Prader–Willi syndrome. Am. J. Med. Genet. Part A., 143A, 476–483. [DOI] [PubMed] [Google Scholar]
- 40.Shapira N.A., Lessig M.C., He A.G., James G.A., Driscoll D.J., Liu Y. (2005) Satiety dysfunction in Prader-Willi syndrome demonstrated by fMRI. J. Neurol. Neurosurg. Psychiatry, 76, 260–262. [DOI] [PMC free article] [PubMed] [Google Scholar]
- 41.Holsen L.M., Zarcone J.R., Brooks W.M., Butler M.G., Thompson T.I., Ahluwalia J.S., Nollen N.L., Savage C.R. (2006) Neural mechanisms underlying hyperphagia in Prader-Willi syndrome. Obesity, 14, 1028–1037. [DOI] [PMC free article] [PubMed] [Google Scholar]
- 42.Swaab D.F., Purba J.S., Hofman M.A. (1995) Alterations in the hypothalamic paraventricular nucleus and its oxytocin neurons (putative satiety cells) in Prader-Willi syndrome: a study of five cases. J. Clin. Endocrinol. Metab., 80, 573–579. [DOI] [PubMed] [Google Scholar]
- 43.Meziane H., Schaller F., Bauer S., Villard C., Matarazzo V., Riet F., Guillon G., Lafitte D., Desarmenien M.G., Tauber M. et al. (2015) An early postnatal oxytocin treatment prevents social and learning deficits in adult mice deficient for magel2, a gene involved in Prader-Willi syndrome and autism. Biol. Psychiatry, 78, 85–94. [DOI] [PubMed] [Google Scholar]
- 44.Goldstone A.P., Unmehopa U.A., Bloom S.R., Swaab D.F. (2002) Hypothalamic NPY and agouti-related protein are increased in human illness but not in Prader-Willi syndrome and other obese subjects. J. Clin. Endocrinol. Metab., 87, 927–937. [DOI] [PubMed] [Google Scholar]
- 45.Goldstone A.P., Unmehopa U.A., Swaab D.F. (2003) Hypothalamic growth hormone-releasing hormone (GHRH) cell number is increased in human illness, but is not reduced in Prader-Willi syndrome or obesity. Clin. Endocrinol., 58, 743–755. [DOI] [PubMed] [Google Scholar]
- 46.Fronczek R., Lammers G.J., Balesar R., Unmehopa U.A., Swaab D.F. (2005) The number of hypothalamic hypocretin (Orexin) neurons is not affected in Prader-Willi syndrome. J. Clin. Endocrinol. Metab., 90, 5466–5470. [DOI] [PubMed] [Google Scholar]
- 47.Collden G., Balland E., Parkash J., Caron E., Langlet F., Prevot V., Bouret S.G. (2015) Neonatal overnutrition causes early alterations in the central response to peripheral ghrelin. Mol. Metab., 4, 15–24. [DOI] [PMC free article] [PubMed] [Google Scholar]


