

Summary
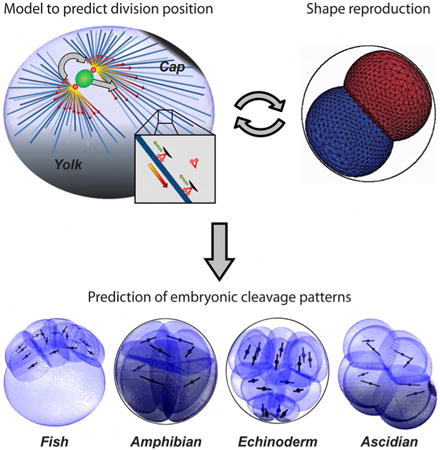
Life for all animals starts with a precise 3D-choreography of reductive divisions of the fertilized egg, known as cleavage patterns. These patterns exhibit conserved geometrical features and striking inter-species invariance within certain animal classes. To identify the generic rules that may govern these morphogenetic events, we developed a 3D-modelling framework that iteratively infers blastomere division positions and orientations, and consequent multicellular arrangements. From a minimal set of parameters, our model predicts detailed features of cleavage patterns in the embryos of fishes, amphibians, echinoderms and ascidians, as well as the genetic and physical perturbations that alter these patterns. This framework demonstrates that a geometrical system based on length-dependent microtubule forces that probe blastomere shape and yolk gradients, biased by cortical polarity domains, may dictate division patterns and overall embryo morphogenesis. These studies thus unravel the default self-organization rules governing early embryogenesis, and how they are altered by deterministic regulatory layers.
Graphical abstract
Pierre et al. develop computational models to make predictions on the positions and orientations of division axes in subsequent rounds of embryonic cleavages across fishes, amphibians, echinoderms, and ascidians. The model reveals a set of simple self-organizing rules that can predict the morphogenesis of early developing embryos from different species.
Introduction
A cleaving embryo serves as an excellent context to understand the emergence of diverse modes of division plane positioning in a single developing system. After fertilization, animal eggs undergo a precise series of subsequent reductive blastomere divisions called cleavage patterns. The geometry of these patterns may specify developmental axes, germ layers and cell fates (Gilbert, 2010). Blastomeres divide in a stereotyped manner, exhibiting symmetric or asymmetric divisions, oftentimes oriented with respect to embryonic axes or preceding divisions (Kimmel et al., 1995; Olivier et al., 2010; Summers, 1993; Tassy et al., 2010). The invariance and diversity of cleavage patterns has long attracted the attention of biologists, and several empirical rules were formulated. These include Balfour's, Sachs', or Hertwig's rules, that capture conserved features of blastomere division, such as the tendency of cells to divide along their long axis, or the orthogonal sequence of division axes typical of various species (Hertwig, 1893; Minc et al., 2011; Minc and Piel, 2012; Sachs, 1887; Wilson, 1925).
Division positioning is now known to involve the dynamic orientation of nuclei and spindles, which are moved and oriented from the forces exerted by microtubules (MT) and associated motors such as dynein (Minc and Piel, 2012). In eggs and early blastomeres, recent work suggested that division axes are pre-determined by interphase MT asters which fill the large volume of these cells. These asters are organized around the nucleus from a pair of centrosomes, and may be positioned and oriented from dynein-mediated MT forces exerted in the cytoplasm. These findings outline a geometrical model in which length-dependent MT forces may convert aster geometry into a net force and torque to specify division positioning (Hamaguchi and Hiramoto, 1986; Minc et al., 2011; Mitchison et al., 2012; Tanimoto et al., 2016; Wuhr et al., 2009; Wuhr et al., 2010). These designs contrast with deterministic inputs that guide division positioning from cortical polarity cues that influence MT forces by promoting dynein activity or MT depolymerization at the cortex (Gonczy, 2008; Grill and Hyman, 2005; Kozlowski et al., 2007). Although our basic understanding of these diverse mechanisms has emerged from detailed studies of one reproducible single-cell division in models such as the C. elegans zygote, how polarity and geometrical cues may cooperate or compete to pattern the wide diversity of division positioning events in a multi-cellular context remains an outstanding question.
Here, we develop a 3D-modelling framework to elucidate the generic rules that dictate subsequent division axes and overall morphogenesis of embryos from several deuterostome classes which exhibit invariant cleavage, including fishes, amphibians, echinoderms and ascidians. These models iteratively predict division axes and blastomeres' arrangement, and thus allow full development of cleaving embryos in silico. Core hypotheses of the models are defined and tested using imaging data and experimental assays available in the literature, and performed by ourselves. Our findings support that aster geometry, set by cell boundaries, yolk gradients and/or neighboring asters, and probed by length-dependent MT pulling forces, serve as a basal cue for division positioning. This default mode may then be locally biased by maternal cortical domains that exert additional pulling forces on astral MTs. Thus, this quantitative analysis shows that complex multiple modes of division may be accounted for by a few simple rules, and begins to elucidate how self-organized and deterministic maternal traits intersect to pattern early embryogenesis.
Results
Two complementary 3D models to predict division plane positioning, and consequent blastomere multicellular arrangement in cleaving embryos
To understand the mechanisms that control cleavage patterns, we first developed a model to predict, in 3D, the position and orientation of interphase aster pairs which pre-specify the site of division in eggs and early blastomeres studied here (Minc et al., 2011; Sawada and Schatten, 1988; Wuhr et al., 2010). The model inputs simple MT aster nucleation parameters and assumes a certain spatial distribution of MT forces to output an equilibrium position and orientation of aster pairs (Bjerknes, 1986; Minc et al., 2011; Thery et al., 2007). Following recent studies, we assumed as a starting hypothesis that forces exerted by astral MTs depend on MT length, which may allow cells to divide with respect to their geometry (Minc et al., 2011; Wuhr et al., 2010) (Figure 1A). Length-dependency of MT forces is modeled using a scaling exponent δ, so that F ∼ Lδ, with L the MT length (Minc et al., 2011). The distribution of MT length in asters can be computed, depending on the system considered (see below), by assuming that MTs stop growing when touching the cell cortex, a sister aster, or from specific hypotheses on the influence of yolk density on MT growth.
Figure 1. A modelling framework to predict cleavage morphogenesis of early embryos.
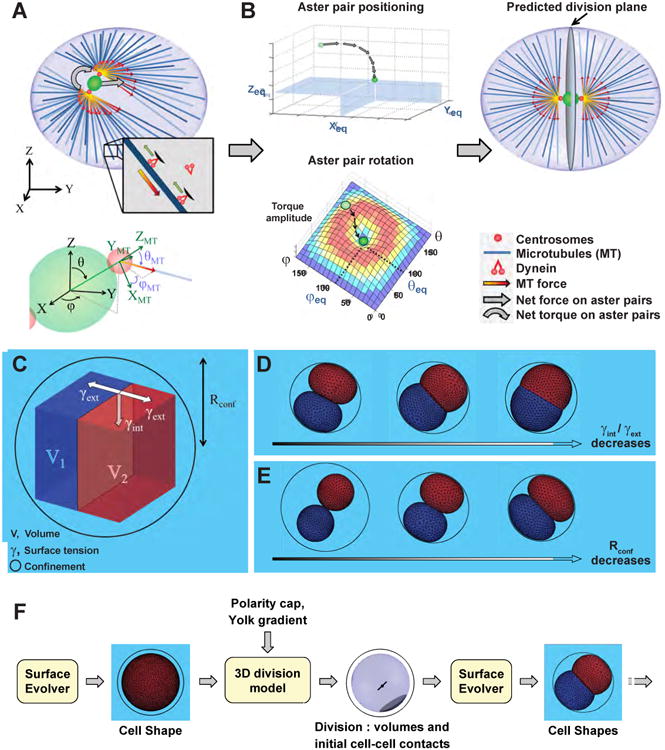
(A) 3D model to predict division plane positioning and orientation from cell shape. Interphase MT asters exert forces and torques on centrosomes that scale to MT lengths (top). Definition of 3D positions and angles for the centrosome pair axis and individual MTs used to project forces and torques (Bottom, See Supplemental Information). (B) Principle of the directed search for mechanical equilibrium used to identify the position and orientation of aster pairs. The calculated force and torque directions lead the centrosome pair from a random starting point to its equilibrium position and orientation, that corresponds to a near-zero torque and force (center), and determines the position and orientation of the future division plane (right). (C) Shapes and arrangements of divided blastomeres are generated with “The Surface Evolver” software that minimizes surface energy under custom constraints, including cells volumes, surface tensions and confinement. (D) Influence of the ratio of cell-cell tension, γint over cell-medium tension, γext on blastomere shapes. (E) Influence of confinement that mimics the impact of fertilization envelopes on blastomere shapes. (F) Iterative modelling framework subsequently predicting blastomere shape/arrangement and division position to develop embryos in silico.
The model computes a net force and torque on the pair of centrosomes at the center of asters for any position or orientation defined by the 5 space variables in 3D (x, y, z, θ, φ). The predicted mechanical equilibrium may be identified by assessing all possible positions or orientations (Minc et al., 2011; Thery et al., 2007). However, in 3D, this approach yielded overly long computing times, which led us to adopt a directed search for the mechanical equilibrium that follows the direction of force and torque up to the equilibrium position (Figure 1B, Experimental Procedure and Supplemental Information). Using a range of different input geometries, we first systematically confirmed that this model could account for the alignment of the division axis with cell shape in 3D (data not shown) (Minc et al., 2011). Next, we tested the influence of parameters on these predictions. The distance between centrosomes, Dc, did not impact predictions. The angular extension of MT asters, ψ, influenced aster positions, but only weakly affected their orientation. Finally, the force scaling exponent, δ had no major influence below a value of 5, and was set to 3 following recent estimations (Figure S1A-S1C, Experimental Procedure and Supplemental Information) (Minc et al., 2011).
Next, we sought to compute the resulting shapes and arrangement of divided blastomeres. We used the modeling software “The Surface Evolver”, which iteratively minimizes surface energy under various constraints (Brakke, 1992; Xiong et al., 2014). We input the volumes of blastomeres, their initial topology based on previous division axes predicted from the abovementioned model, and values of surface tension at the site of cell-cell adhesion, γint, and cell-medium interface, γext. Confinement by the fertilization envelope or other egg-surrounding layers can also be added as an additional factor contributing to blastomere shape and re-positioning (Figure 1C). The model ignores the complex mechanisms regulating cortical tension and cell-cell adhesion. Yet it allows generation of 3D blastomere shapes and arrangement from a minimal set of parameters, and subsequent testing of their contribution to cleavage patterns (Movie S1). For instance, a lower value of γext/γint yields more rounded blastomeres, while a higher value causes apposed blastomeres to adopt near-hemispherical shapes (Maitre et al., 2015) (Figure 1D). Similarly, an increased confinement tends to flatten cell sides and lengthen cell-cell interfaces (Figure 1E).
Using both models, we iteratively compute division position and blastomere shape and arrangement in subsequent cleavage stage, which provides us with a complete in silico modeling framework to predict and understand cleavage patterns (Figure 1F and Supplementary Item S1).
Cell geometry as a dominant cue to dictate a cleavage pattern: the case of fishes
The geometry of eggs and blastomeres has been shown to influence division positioning in different cells and embryos (Minc et al., 2011; Minc and Piel, 2012), but whether it can serve as the prevalent cue to pattern early development is not known. In Zebrafish embryos, like in most fish species and several other vertebrates including birds and reptiles, cleavage is discoidal, as only a superficial part of the embryo, called the blastodisc, sitting on a large dense yolk layer, is being cleaved (Gilbert, 2010; Kimmel et al., 1995). Two conserved features of fish cleavage have been described: (i) Divisions up to the 4th cleavage all lie parallel to the yolk interface and are nearly orthogonal to the previous division axes and (ii) at the 5th cleavage, the four center-most blastomeres of the blastodisc switch to a division axis now orthogonal to the yolk interface, allowing tissue layering in the 3rd dimension (Kimmel et al., 1995; Mitchison et al., 2012; Olivier et al., 2010; Wuhr et al., 2010) (Figure 2A and 2C). Large interphase MT asters that fill the whole blastodisc, but do not penetrate the yolk, were suggested to organize early fish cleavage through length-dependent MT forces (Figure S2A). Finally, centrosome separation in the next cell cycle occurs before cytokinesis within sister telophase asters, which repulse each other at an aster-aster interaction zone that marks the site of cleavage furrow ingression (Mitchison et al., 2012; Wuhr et al., 2010).
Figure 2. Division positioning based on aster shapes and MT length-dependent forces may account for fish early development.
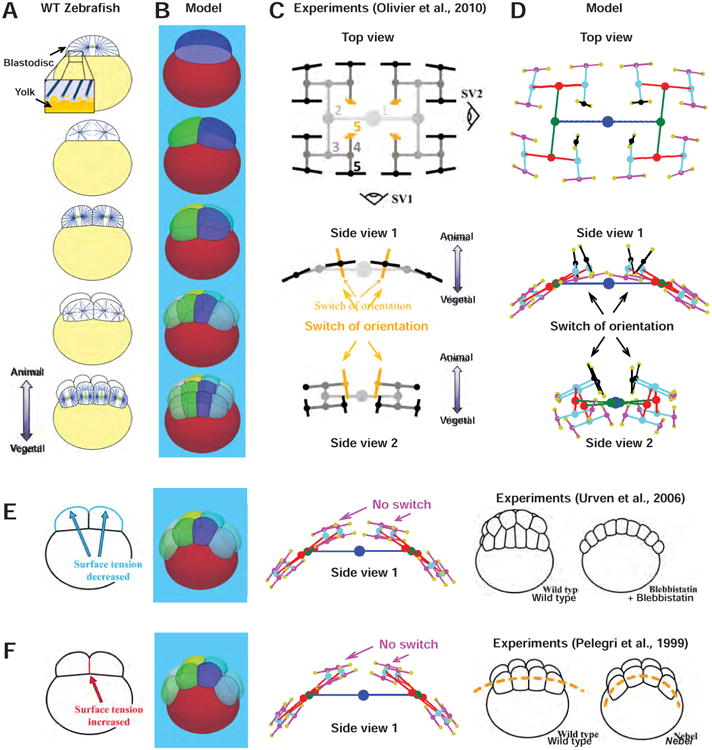
(A) Cleavage patterns, and interphase aster position in zebrafish embryo (adapted from (Olivier et al., 2010; Wuhr et al., 2010)). A large fraction of the embryo is filled with yolk (yellow) that stops aster growth. (B) Model predictions of early embryo development. (C) Schematic subsequent 3D division positions and orientation (adapted from (Olivier et al., 2010)). Note the switch of division orientation in the 4 central blastomeres at the 5th cleavage (orange). Numbers represent the cleavage stage. (D) Predicted division patterns from the model solely based on length-dependent forces. (E) Effect of lowering cortical tension on morphogenesis and division patterns. Note the absence of switch at the 5th cleavage in the model. (Right) Schematic phenotype of controls and embryos treated with blebbistatin that reduces cortical tension (adapted from (Urven et al., 2006)). (F) Effect of increasing cell-cell tension on morphogenesis and division patterns. Note the spreading of blastomere on the yolk layer and the absence of division orientation switch at the 5th cleavage. (Right) Schematic phenotype of WT and nebel mutant embryos, defective in cell-cell adhesion (adapted from (Pelegri et al., 1999)).
We modeled aster geometry by assuming that MTs stop growing at the cell cortex, at the yolk interface, and at aster-aster interaction zones. The shapes of dividing blastomeres were obtained by setting the value of γext/γint to match contact angles measured from images in the literature (Olivier et al., 2010). Confinement was neglected as the chorion which surrounds embryos is located far from the egg (Kimmel et al., 1995). Strikingly, a model solely based on length-dependent forces accounted for all stereotypical division orientations and positions up to the 5th cleavage, with no adjusted parameters between subsequent simulations (Figure 2B and 2D, Movie S2). The model robustly reproduced the planarity of division axes in the four initial rounds of divisions, the successive orthogonality of these division axes, and the switch in division orientation at the 5th cleavage in the four central blastomeres. In the model, this switch was caused by an elongation of these four cells perpendicular to the yolk-interface resulting from the compaction of neighboring blastomeres (Figure 2B, 2D and Figure S3A-S3D). By contrast, a model based on putative surface cues located at cell-cell adhesion sites was not able to reproduce the switch at the 5th cleavage (Figure S2B-S2D) (Goldstein, 1995).
To further test these findings, we assayed the impact of changing parameters that influence cell shape on the sequence of division axis alignments, and compared the results to published observations. We found that a decreased cell-cell tension or an increased cortical tension influenced blastomere shapes, and caused a precocious division orientation switch at the 4th cleavage. Conversely, a lower cortical tension caused cells to flatten, with a shorter cell-cell interface, and the 5th cleavage to remain planar. This simulation is consistent with defects in tissue layering observed in embryos treated with blebbistatin, which affects myosin activity and presumably reduces cortical tension (Figure 2E and S3I) (Urven et al., 2006). A similar effect was obtained by increasing cell-cell tension, which may account for weakened cell-cell adhesions. This simulation may correspond to the phenotype of a nebel mutant, which is defective in cell-cell adhesion, and predicts that the switch at the 5th cleavage should be less pronounced in this mutant (Figure 2F and S3J) (Pelegri et al., 1999; Webb et al., 1997). Finally, we found that a precocious separation of daughter cells induced earlier blastomeres arrangement and caused a significant bias in the angular distribution of division axes, consistent with experiments that challenge the cell cycle with heat shocks (Heier et al., 2015) (Figure S3A-S3H). Together these data highlight how parameters that influence blastomere shape can give rise to various patterns, and demonstrate in a dose-dependent manner that a length-dependent MT pulling mechanism, which relies on pure geometrical effects, may account for early fish cleavage morphogenesis.
The gradual effect of yolk on length-dependent forces and cleavage patterns: the case of amphibians
We next sought to test if variations in the length-dependent model could account for the development of mesolecithal eggs. A well-studied case is the cleavage pattern of the frog Xenopus laevis, which is stereotypical of hundreds of amphibian species (Desnitskiy, 2014). The 1st and 2nd division planes lie parallel to the A-V axis, and perpendicular to each other, and the cleavage furrow ingresses from the animal pole. The third cleavage is orthogonal to the A-V axis and asymmetric, generating small animal blastomeres (Figure 3A). Recent studies have suggested similar principles as in fish regarding large aster organization, cytoplasmic length-dependent MT forces, and the relative timing of centrosome duplication and furrow ingression (Wuhr et al., 2010). However, Xenopus eggs display a more gradual accumulation of yolk with increasing density towards the vegetal pole compared to zebrafish (Figure S4A). We asked if and how this yolk gradient could influence the length-dependent model to account for the cleavage patterns of amphibians.
Figure 3. Gradual influence of yolk concentration on MT length and consequent forces may account for early amphibian cleavage pattern.
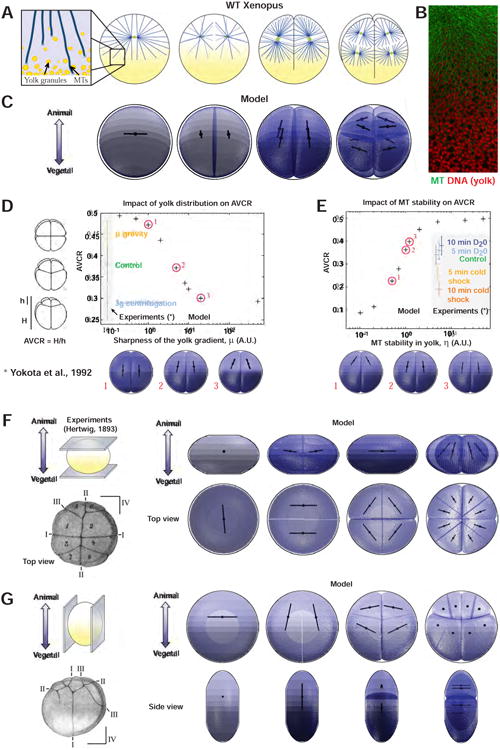
(A) Early developmental patterns and aster organization in Xenopus embryo (adapted from (Gilbert, 2010) and (Wuhr et al., 2010)). Yolk granules form a gradient in the cytoplasm, and the model now posits that MTs angular density decreases as a function of yolk concentration. (B) Immunostaining image showing the organization of interphase MTs (green) around yolk granules (red) in a Xenopus 2-cell stage embryo. Scale bar: 40μm. (C) Model predictions, the yolk is depicted in black inside the embryos. (D) Influence of gravity on yolk gradient and consequence on the asymmetry of the 3rd divisions computed by the AVCR (Animal-Vegetal Cleavage Ratio) in experiments (Yokota et al., 1992) and in the model (crosses, numbered red circles corresponding to bottom images). (E) Influence of MT stability in yolk on AVCR in experiments (Yokota et al., 1992) and in the model (crosses, numbered red circles corresponding to bottom images). (F and G) Hertwig's egg compression experiments (Hertwig, 1893). (F) Impact of compression orthogonal to the animal-vegetal axis in experiments and in the model. (G) Impact of compression along the animal-vegetal axis in experiments and in the model.
To assess how MTs may be influenced by the yolk, we first performed immunostaining. This analysis confirmed a gradual accumulation of yolk towards the vegetal pole, and revealed that the relative density of MTs decreases as a function of yolk amount in a dose-dependent manner (Figure 3B and S4A). We thus used a model based on MT length-dependent forces but allowed MTs to penetrate the yolk. We tested several yolk distributions and hypotheses on the influence of yolk on MT growth, including one based on a threshold in yolk density that stops MT growth (Figure S4B-S4D and Supplemental Information). To reproduce the shapes of blastomeres reported in the literature, we assumed a strong confinement by the fertilization envelope and/or other coat layers around the egg (Danilchik et al., 2006; Gilbert, 2010). Given this confinement, tension values had little impact on blastomere shapes and arrangement.
The model accounted for Xenopus cleavage patterns up to the 8-cell stage (Figure 3C, Figure S4C and Movie S3). In contrast with zebrafish, altering the timing of furrow ingression had no major effect on cleavage patterns, likely because, as a result of confinement, the shapes of divided blastomeres and preceding asters are similar (Figure S4E). Accordingly, removing the confinement yielded, with all other parameters fixed, a drastic change in blastomere shapes and an inhibition of the switch in orientation at the 3rd cleavage (Drechsel et al., 1997) (Figure S4F).
To further assay the influence of the yolk, we tested if our model could account for published experiments manipulating gravity and MT stability at the 3rd asymmetric cleavage (Neff et al., 1984; Yokota et al., 1992). Removing the effect of gravity by rolling the eggs yields a near symmetric 3rd cleavage, with similar orientation along the A-V axis. Conversely, placing eggs in 3g gravity by centrifuging them increases the amount of asymmetry. In the model, we tuned the sharpness of the yolk gradient to account for the effect of gravity, and could quantitatively reproduce these observed changes (Figure 3D). Another set of experiments consisted in exposing eggs to different treatments that presumably affect MT stability. Applying a 10 min cold shock to destabilize MTs prior to the 3rd cleavage, caused an increased asymmetry. Conversely, the use of heavy water (D20) to stabilize MTs made division more symmetric than controls, and rescued the effects of cold shocks. By tuning the impact of yolk density on MT density in the model, we could account for these experimental results (Figure 3E).
Finally, we ran our models against Hertwig's experiments, in which eggs are deformed between glass slides either along or perpendicular to the A-V axis, by adding an asymmetric confinement in “The Surface Evolver” (Figures 3F-3G) (Hertwig, 1893). We found that when the egg was compressed along the A-V axis, the 3rd division now occurred perpendicular to the A-V axis, and the 4th division axis was nearly parallel to this axis, in agreement with Hertwig's findings (Figure 3F). A compression perpendicular to the A-V axis yielded, both in the simulation and in Hertwig's experiments, a premature switch of the 2nd cleavage axis parallel to the A-V axis (Figure 3G). We conclude that our hypothesis based on length-dependent forces combined with an influence of yolk on MT density may account for amphibians cleavage patterns and relevant perturbations of these patterns.
Integrating geometry and polarity to define a cleavage pattern: the case of echinoderms
We next asked how geometrical cues may compete or cooperate with polarity cues that are known to promote asymmetric divisions in the cleavage of several embryos (Gonczy, 2008; Hörstadius, 1928). One remarkable example are echinoderms, such as sea urchin, sand dollar or starfish (Gilbert, 2010; Raff, 1987). These embryos do not exhibit any yolk gradient, and cleave in a holoblastic manner. The first three cleavages are symmetric and orthogonal to each other, with the first and second ones parallel to the A-V axis. At the 4th cleavage, the four vegetal blastomeres undergo marked asymmetric divisions oriented along the A-V axis, to produce small micromeres, while animal blastomeres follow a symmetric pattern (Gilbert, 2010; Summers, 1993) (Figure 4A). Many past experiments have supported the existence of a single domain accumulated at the vegetal pole, which contains conserved polarity effectors, such as Dishevelled (Figure 4B) (Boveri, 1901; Dan, 1979; Hörstadius, 1928). This domain may influence MT forces to drive vegetal asymmetric divisions at the 4th cleavage (Dan, 1979; Leonard and Ettensohn, 2007; Peng and Wikramanayake, 2013; Tanaka, 1976). Yet, although this domain is assembled before fertilization, cell shape appears to override its effect in the first three rounds of cleavages, suggesting it only weakly influences MT forces in these stages (Minc et al., 2011). We sought to use echinoderm cleavage to understand how effects of length-dependent pulling and polarity on MT forces may be combined to pattern those various division events.
Figure 4. A single maternal cortical domain may superimpose on cell geometry to orient divisions with respect to the A-V axis in echinoderms.
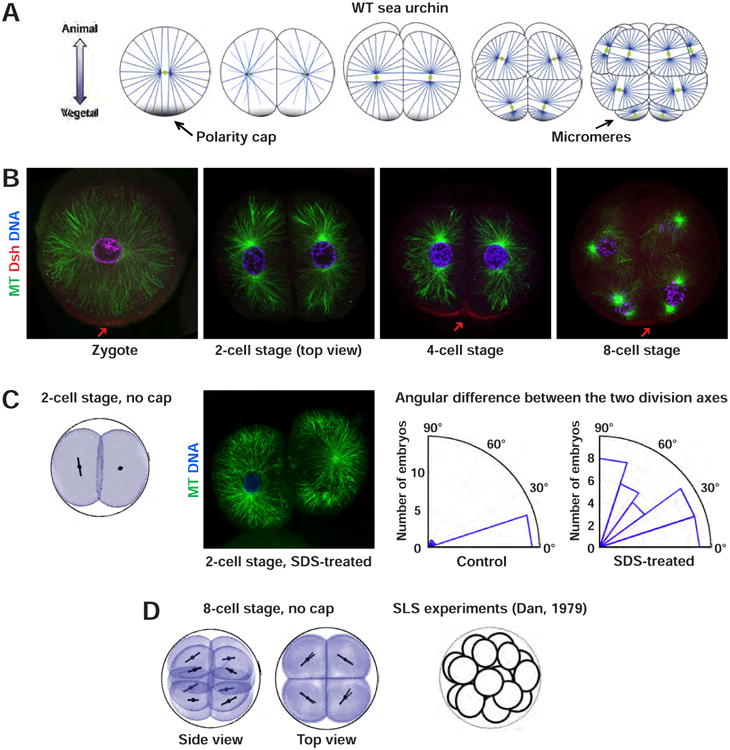
(A) Early developmental patterns and interphase aster organization of sea urchin embryos (adapted from (Gilbert, 2010; Minc et al., 2011; Peng and Wikramanayake, 2013)). (B) Immunostaining images of sea urchin early development, showing MT interphase asters (green), Dishevelled (red, arrows) and DNA (blue). Scale bar: 20μm. (C) Geometry alone is not sufficient to account for the co-planarity of the 2-cell stage division axes. (Left) Simulation of the 2nd round of divisions, solely based on cell shape. (Middle) Immunostaining image of SDS-treated 2-cell stage embryos, showing MT interphase asters (green) and DNA (blue). The two division axes are not coplanar. Scale bar: 20 μm. (Right) Quantification of the co-planarity of division axes in 2-cell stage SDS-treated embryos (N = 37), as compared to control embryos (N = 17). (D) A model solely based on geometry with no input from the vegetal polar domain cannot account for the asymmetric divisions in vegetal blastomeres at the 8-cell stage, but may account for symmetric patterns seen in embryos treated with SLS detergent that may inhibit effects of the cortical domain, depicted as a scheme on the right (Dan, 1979).
To generate blastomere shapes and arrangement, we tuned surface tensions and confinement to match shapes and adhesion angles in the literature (Summers, 1993). We first ran simulations solely based on length-dependent MT pulling. We found that at the 2-cell stage, the two division axes were not coplanar. At the 8-cell stage, the simulations yielded only symmetric divisions oriented near-perpendicular to the A-V axis. These simulations are in agreement with detergent treatment experiments, performed here and in published work (Dan, 1979; Tanaka, 1976), which presumably disrupt surface cues and inhibit division axes co-planarity at the 2-cell stage and cause 8-cell stage vegetal blastomeres to divide symmetrically (Figure 4C-4D). Thus, the vegetal domain may be required both to trigger asymmetric divisions and to orient the three first rounds of division with respect to the A-V axis.
To incorporate the influence of vegetal domains, we first added a “polarity” term in the MT force equation, following a previous hypothesis of dynein-dependent surface pulling limited by dynein (Grill and Hyman, 2005). This hypothesis implicates the force of MTs that contact the domain to be written as FP = α L3 + β L2, with β reflecting dynein concentration/activity at the domain. However, we found that this law systematically caused the division axis to point towards the cap already in the first cleavage (Figure S5A and S5B). We thus tested several other designs and compared simulations to published experimental data (Supplemental information). We found that a law in which the force exerted by MTs at the domain increases exponentially with MT length could stabilize a division axis parallel to the domain (Figure S5C). Experimentally, we computed MT density in interphase asters, by performing immunostaining at various cleavage stages. This showed that branching properties of these asters caused MT density to increase exponentially in addition to dilution effects from the centrosomes to the cell cortex (Figure S5D-S5E) (Minc et al., 2011; Mitchison et al., 2012). We thus hypothesized that cortical pulling forces were limited by the number of MT tips, and subsequently used the law FP = α L3 + γ 2L/a, where γ accounts for the strength of the cap in this condition, and a is the distance between branches, estimated from staining images to be 6.9 ± 3 μm (Figure S5E), and set to 6.75 μm in all simulations. We speculate that this design could better reflect an end-on pulling mechanism mediated by other elements than dynein, such as depolymerization factors (Kozlowski et al., 2007; Kwon et al., 2015) (Figure 5A). Importantly, in simulations, this contribution yielded an orientation of the division axis parallel to the domain for a broad range of parameters (Figure S5F and Supplemental Information). However, it did not allow the generation of situations of centered aster pairs pointing towards the domain. However, 4-cell stage separated blastomeres are round and have been shown to divide symmetrically along the A-V axis (Dan, 1987), suggesting this law alone cannot account for the full range of reported experiments (Figure S5G-S5I).
Figure 5. Cleavage-stage dependent competition between geometry and two distinct cortical mechanisms on MT forces may underlie echinoderm cleavage patterns.
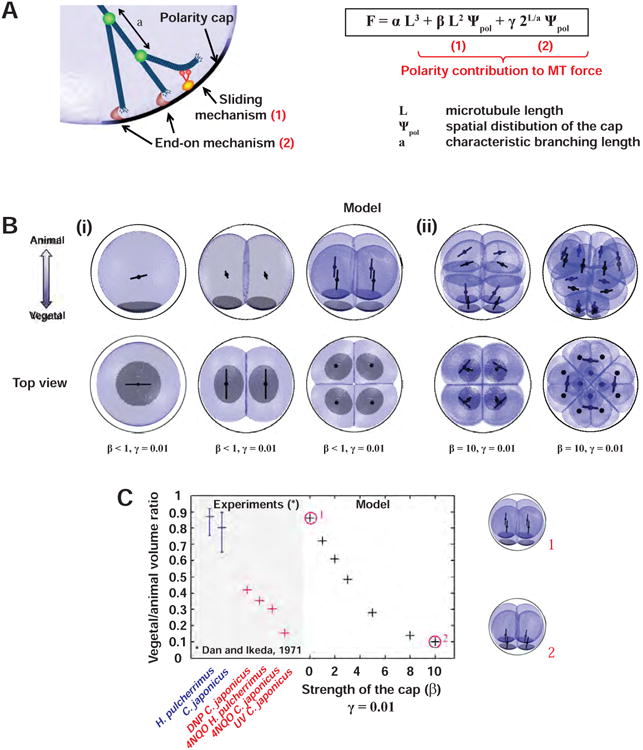
(A) Additional hypothesis for the division model: in addition to MT length-dependent pulling, MTs contacting the polar domain may pull by two distinct mechanisms: (1) a sliding mechanism limited by dynein concentration/activity at the cap; and (2) an end-on mechanism that depends on the number of MT tips reaching the cap, which, as a result of MT branching, depends on MT length in an exponential manner. (B) Model predictions with polar domains represented in black. In the first 3 rounds of divisions, contribution (1) is small (i), and increases in strength in the 4th and 5th cleavages to promote asymmetric division (ii). More precisely for MTs extending from the centrosome to the polar domain along the A-V axis the relative contribution of the geometry term (αL3), the sliding mechanism (βL²) and the end-on mechanism (γ2L/a) are: (40-45%, <10%, 50-55%) for the 1 and 2-cell stage, (30-50%, <40%,30-50%) for the 4-cell stage and (2.6%, 93.1%, 4.3%) for the 8-cell stage. (C) Evidence for a timing associated with an increase in strength of the cap promoting asymmetric division, in cell-cycle delay experiments (Dan, 1971) and in the model (crosses, numbered red circles corresponding to bottom images).
Based on these analyses, we used a sum of both polarity terms, in addition to the length-dependent forces, but kept the polarity terms weak, so that they only modulated the potential landscape set by geometry in the three first cleavages (Figure 5A, Figures S6A-S6B and Supplemental Information). We could fully account for the normal sea urchin cleavage pattern, as well as blastomere dissections up to the 8-cell stage (Dan, 1987; Minc et al., 2011; Summers, 1993; Tanaka, 1976) (Figure 5Bi, and Figure S5C and S5I). These predictions were robust to parameter variations (Figure S6C-S6E). However, they could not produce asymmetric divisions of vegetal blastomeres at the 8-cell stage. We thus considered an additional hypothesis of an increase in motor activity, represented by an increase in the value of β. This was supported by Dan's retardation experiments (Dan, 1971). In those, eggs are treated at the 4-cell stage with UV or chemicals that presumably cause DNA damage and delay cell cycle progression, without affecting domain maturation. These treatments create a curious scenario in which the domain becomes attractive at the 4-cell stage, yielding four asymmetric divisions. A comparison of the model with Dan's observations and normal embryos suggested that an increase in β by a factor of ∼ 10 would be sufficient to recapitulate experimental behavior (Figure 5C). With this additional hypothesis, the model could fully reproduce cleavage patterns up to the 5th division, including micromere formation and radial divisions of animal blastomeres (Figure 5Bi and 5Bii and Movie S4).
To further validate our hypotheses, we compared the model to other published experiments assaying the competition between geometry and polarity. We first considered Hörstadius' experiments, which paused cell cycle-progression by incubating eggs in diluted sea water and assayed the consequence on cleavage patterns (Hörstadius, 1939) (Figure 6A). A treatment at the 1-cell stage caused the second pair of division axes to align along the A-V axis in a precocious manner. A treatment at the 4-cell stage yielded similar abnormal asymmetric divisions as in Dan's experiments. Finally, delaying the two first cell cycles of eggs cut into halves generated an asymmetric division at the 2-cell stage. Our model, using the exact same set of parameters as those used for controls, could account for all those variations in cleavage patterns (Figure 6B). Second, we ran our model against deformation experiments, in which eggs are flattened to assess the impact of cell shape on the location of micromere formation (Dan, 1987). The simulations reproduced these experiments, suggesting they can fully account for the titrated competition between cell geometry and polarity (Figure 6C and 6D). Thus, our model may capture all relevant designs for how a local surface cue could modulate the default geometrical rules to regulate echinoderms cleavage patterns.
Figure 6. Comparison of model prediction and experiments assaying the competition between polarity and geometry in echinoderms.
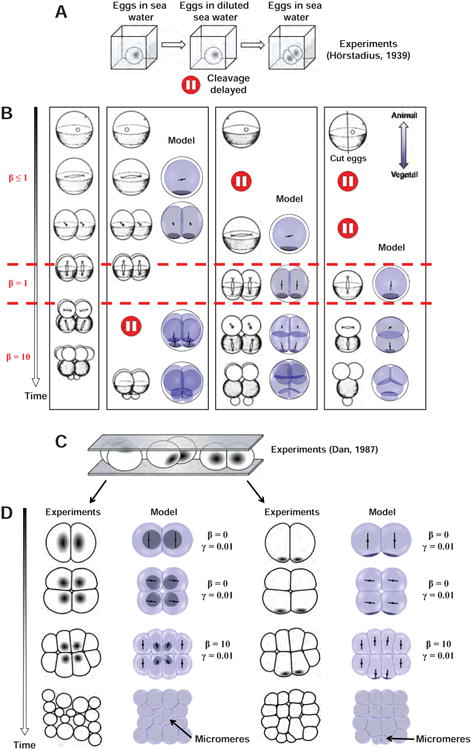
(A-B) Hörstadius' experiment assaying the impact of delays in cleavage on division patterns (Hörstadius, 1939). (A) Cell cycle delay is induced by placing embryos in diluted sea water. (B) Variation of this assay and corresponding predictions of the model obtained by solely changing the value of cap strength β, at various cleavage stages. (C) Dan's egg compression experiments (Dan, 1987). (D) Impact of egg flattening on the appearance and location of micromeres in experiments and models.
Integrating several developmental axes: the case of ascidians
Some embryos possess multiple cues oriented along different axes that may overlap to create complex patterns of divisions. One typical example are ascidians, which are tunicates that exhibit highly conserved cleavage patterns. Ascidian cleavage is organized along two independent axes, an Animal-Vegetal and an Antero-Posterior axis, which may be regulated independently (Gilbert, 2010; Negishi et al., 2007). A-V polarity has been suggested to be associated with the deposition of yolk and other organelles at the vegetal pole (Nishida, 1996). A polar domain, called CAB (Centrosome Attracting Body), may influence division positioning along the prospective A-P axis (Iseto and Nishida, 1999; Negishi et al., 2007; Nishikata et al., 1999). At fertilization, a cytoplasmic rotation creates a yolk crescent with most of the yolk accumulated at the vegetal part of the egg, and some at the incipient anterior pole (Figure 7A and 7B) (Conklin, 1931; Roegiers et al., 1999). The CAB then assembles on the posterior side and maturates to start influencing division positioning at the 2-cell stage (Negishi et al., 2007). The first two divisions are symmetric. The 2nd division axes are tilted with an angle of ∼35°, and only the two posterior blastomeres inherit the CAB at the 4-cell stage (Negishi et al., 2007). At the 3rd cleavage, blastomeres divide slightly asymmetrically towards the animal pole, with posterior blastomeres dividing at a different orientation than the anterior ones. Finally, at the 4th cleavage, the two most posterior blastomeres undergo an asymmetric division, while other blastomeres divide symmetrically (Figure 7A).
Figure 7. Ascidians bilateral cleavage pattern may integrate both influence of yolk on MT length-dependent forces, and the effect of a single polar domain.
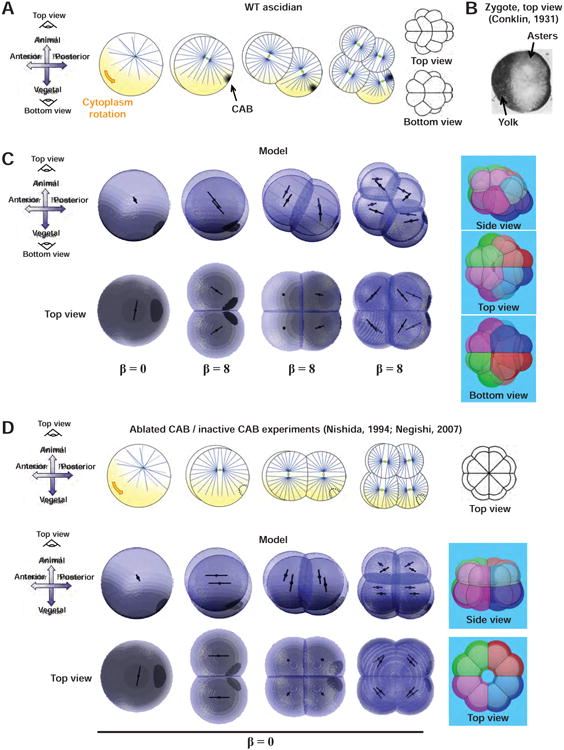
(A) Cleavage patterns and aster organization in ascidian embryos (adapted from (Negishi et al., 2007)). Cytoplasm rotation in the zygote contributes to the accumulation of yolk at the presumptive vegetal and anterior poles. The polar domain (CAB, Centrosome Attracting Body) assembles at the presumptive posterior pole and influences aster position from the 2nd cleavage. (B) Cut top view of an egg which highlights the yolk accumulation at the anterior pole and the position of aster shifted away from the yolk (Conklin, 1931). (C) Model predictions using the same equations as in Figure 5A for the contribution of the polar domain, with a strength increasing at the 2-cell stage, and the same assumptions on the yolk gradients as in Figure 3. (Right) 16-cell stage blastomeres arrangement and typical embryo pointy shape predicted with “The Surface Evolver”. (D) Cleavage radialization achieved by CAB physical ablation (Nishida, 1994; Nishikata et al., 1999) or PEM-mRNA knock-down (Negishi et al., 2007), and its simulation with a non-pulling cap.
To reproduce the morphogenetic arrangement of blastomeres, we neglected the confining effect of the envelope, and used images from the literature to extract interface angles (Tassy et al., 2010). We noted that 4 and 8-cell stage blastomeres appear more adherent, and thus decreased cell-cell tension value after the 2-cell stage. To model division planes positioning, we assumed a model based on aster shape as above, on which we added the contributions of the CAB and yolk layers. We reproduced the yolk crescent at the 1-cell stage with two gradients. This, under the same hypotheses for the effect of yolk on MTs as in amphibians, predicted a division axis shifted towards the animal and posterior poles, and aligned perpendicular to the A-P axis, as in previous reports (Conklin, 1931; Roegiers et al., 1999) (Figure 7C). Following published experimental observations, we added a contribution of the CAB after the first cleavage (Negishi et al., 2007), and used a similar surface-based pulling hypothesis as for echinoderms. However, the exponential contribution to surface pulling did not appear to be required in this case (Figure S7).
We could predict the whole set of division positions observed in ascidians, and overall embryo morphogenesis, including the stereotypical posterior pointy shape of the embryo at the 16-cell stage (Figure 7C and Movie S5). As a further validation, we ran our model without the contribution of the CAB. As observed in published experiments where the CAB was ablated or made inactive with Morpholino against PEM mRNA (Negishi et al., 2007; Nishida, 1994; Nishikata et al., 1999), we obtained in the model a radialized embryo, which maintained an asymmetry along the A-V axis caused by yolk vegetal accumulation. In addition, as reported (Negishi et al., 2007), the position of the inactive CAB was different than in the wild-type as a result of altered division patterns and rearrangements (Figure 7D). We conclude that a competition between length-dependent MT forces influenced by the yolk and the presence of a single polarity domain may account for the cleavage patterns of ascidians.
Discussion
A model to predict the developmental morphogenesis of early embryos
By systematically exploring the mechanisms that specify embryonic cleavage with a 3D model, we here identify and test the generic designs that may pattern multiple rounds of divisions in different species. The model is kept minimal to allow the rapid exploration of simple rules which can account for a broad range of experimental results. Inputs such as dynamic instabilities or details of MT arrangement in asters are ignored, as they are expected to only impact parameters values in the model. The quality of our prediction relative to experimental data in normal as well as manipulated embryos indicates that we may capture all dominant features regulating cleavage patterns. The opaqueness of some eggs, their large size or fragility renders 3D imaging of early embryogenesis limited to a few systems (Olivier et al., 2010; Summers, 1993; Tassy et al., 2010). In addition, embryonic cleavage relies on maternal proteins and mRNA, rendering the genetic dissection of underlying mechanisms difficult (Pelegri et al., 2004). In this context, our model, which can rapidly explore the impact of parameters connecting MT forces to spatial organization layers such as yolk or polarity domains, or assay the contribution of blastomere adhesion or tension to morphogenesis, may be valuable to guide the design of future experiments.
Generic designs regulating division positioning
In early embryos of fishes and amphibians, we find that a basal hypothesis in which MTs pull within asters that probe cell shape, sister asters and yolk layers with length-dependent forces may predict cleavage patterns up to the 32- and 16-cell stage respectively. Polarity domains do not appear to be required to polarize development. Rather, the natural deposition of dense yolk at the bottom of large eggs may represent a simple way of polarizing a shape-driven cleavage pattern. Whether yolk granules act as steric obstacles or affect MT growth by molecular means remains an important open question (Dogterom and Yurke, 1997; Wuhr et al., 2010). A significant output of these models is that parameters influencing blastomere shapes and arrangement, such as cortical tension, cell-cell adhesion, and fertilization membranes, are key to define cleavage patterns in these embryos (Minc et al., 2011; Minc and Piel, 2012; Mitchison et al., 2012; Wuhr et al., 2010). Further experimental work focusing on the factors controlling these shape-regulating elements shall bring important insights into early embryogenesis in these systems.
Geometrical cues alone, however, are not sufficient to account for the patterns of echinoderms and ascidians. In both systems, our modelling analysis suggests that the effect of polar domains are super-imposed on the default geometrical contribution (Negishi et al., 2007; Tanaka, 1976). In asymmetrically dividing C. elegans zygotes, inhibition of the PAR polarity system yields a symmetric division with a division aligned along the cell long axis (Tsou et al., 2003). This suggests that the competition between MT forces exerted in bulk cytoplasm and those localized at cortical sites may be a conserved feature of many cell divisions. How this competition may be titrated in different systems remains an important question to address experimentally (Minc and Piel, 2012; Mitchison et al., 2012).
Our analysis of the contribution of polar domains to division patterns in echinoderms indicates how cortical domains may contribute to produce not only asymmetric but also symmetric divisions, oriented parallel or perpendicular to the domain. We propose that overlapping contributions of dynein-based MT sliding/pulling at the surface, and a system limited by the number of MT tips touching the domain, for instance involving depolymerizing activities, may account for these diverse phenotypes (Kozlowski et al., 2007). These findings are in agreement with recent evidence showing that both systems act in concert to orient spindles in mammalian adherent cells (Kwon et al., 2015). Given that these division orientation phenotypes have been reported in a wide range of cell types and situations, we expect our model to be valuable beyond embryonic cleavage.
Self-organization vs. determinism for embryonic development
Finally, we demonstrate that simple self-organization rules for MT forces may predict diverse events of 3D division positioning in developing embryos. The near constant biochemistry of early embryos and their rapid cell cycle may explain why those systems may rely more on self-organization, in contrast with more regulated deposition of cortical layers in somatic cells (Bosveld et al., 2016; Thery et al., 2007). In considering different cleavage patterns studied over the years, we note, however, that more ancestral protostome species such as worms or mollusks exhibit cleavage patterns that are highly specified from the onset of fertilization (Gilbert, 2010; Wilson, 1925). Those patterns exhibit large variations between closely-related species, and some of them may have even evolved to improve the fitness of an organism to a given niche (Gilbert, 2010; Hejnol, 2010; Schierenberg, 2006). In contrast, cleavages of deuterostomes, which include those of vertebrate and some marine invertebrate species, are invariant and more labile, relying more on self-organization than determinism (Mitchison et al., 2012; Wennekamp et al., 2013). More quantitative studies of the generic designs that regulate cleavage may unravel where and how self-organization has been selected over determinism in evolution.
Experimental Procedures
Model for predicting division position and orientation in 3D
The model predicting division position and orientation consists in computing the net force and torque created by a pair of MT asters. Forces and torques are calculated from summing the contribution of all MTs in the aster pairs, based on hypotheses on single astral MT forces detailed in the main text. The search for the mechanical equilibrium is achieved by using a directed search of force and torque minima, to minimize computing times. The model is coded in Matlab (Mathworks), and inputs a 3D binary matrix that defines cell shape and another one for polarity domains, when relevant. The shape matrix is generated from a binary stack, in which the cell volume is labeled. This stack is created from “The Surface Evolver”: the coordinates of the surface vertices in the output file of “The Surface Evolver” serve to generate a binary stack in which the cell surface is labeled, via a Matlab script. The volume of the cell is then filled with ImageJ. The polarity matrix comes from binary stacks created with ImageJ. A yolk gradient 3D matrix is directly generated in the Matlab program.
The directed search for the mechanical equilibrium loop is initiated from the center of mass of the shape matrix, with a random orientation. At each iteration of this loop, one of the coordinates x, y, z, θ or φ, randomly chosen, is changed according to the force/torque direction calculated at the previous iteration, with a step size of 1 pixel for x, y or z and 1 ° for θ and φ. If the force/torque does not change sign (or is smaller), the new position/orientation is kept. In order to avoid local minima due to pixel noise, a non-zero probability of keeping the new position anyways was set.
Details of the parameters used, how they are varied and may influence the results of simulations throughout this study are provided in great details in Supplemental Information. Briefly, the relevant parameters for this model are:
The aster extension ψ, the distance between centrosomes Dc, and the scaling exponent δ, which are the sole parameters used for the length-dependent contribution of MTs. For simulation accounting for yolk gradients, the parameters μ. which represents the sharpness of the gradient and ε its offset from egg center serve to generate yolk gradients, and an additional parameter η is used to compute the sensitivity of MTs to yolk. Finally to incorporate a contribution from surface polarity domains, a parameter Δpol is used to represent the size of the domain, and the parameters β, γ and a are used for the laws which account for the contribution of polarity to MTs forces, as described in the main text.
Model to compute blastomere shapes and rearrangements
Blastomere shapes and arrangement were computed with “The Surface Evolver” (Brakke, 1992). Input files include the topology of the embryo (coordinates of faces and edges that define cell-cell contacts), the target volumes, which are both inferred from the previous division prediction, surface tensions values (γext and γint) and confinement parameters. The calculations performed by the software are iterative, starting from cubic-like shapes (Movie S1). The calculation is stopped when the cells stop changing shapes, but before their complete rearrangement, to account for the effect of adhesion. Fast rearrangements and neighbor exchanges are however permitted.
Details of parameters used and how they are varied in simulations throughout this study are provided in great details in Supplemental Information. Briefly those are: the surface tension of the cell-medium interface γext, the surface tension of the cell-cell interface γint, and the envelope confinement geometry R.
A starter package with models and brief notes on how to use them is included in Supplemental Information (Supplementary Item S1).
Immunostaining
Detailed protocols for fixation and immunostaining for Xenopus, and sea urchin are provided in (Minc et al., 2011; Wuhr et al., 2008). The protocol for sea urchin was modified to include the addition of an antibody against Dishevelled, kindly provided by Pr Wikramanayake, used at 1/2000 (Peng and Wikramanayake, 2013). Zebrafish embryos expressing the microtubules marker EMTB-3×GFP, Tg(actb2:Hsa.MAP7-EGFP) (Wuhr et al., 2011), were fixed with (0.25 to 0.50% FA, 0.1% GA, 80 mM K Pipes, pH 6.8, 1 mM MgCl2, 5 mM EGTA, 0.2% Triton X-100) (slightly modified from (Becker and Gard, 2006)). Embryos were cleared with 40% Quinoline, 32% glycerol, 28% water, 1% 2M Amonium Sulfate and stained with 1 μg/mL of Rhodamine-Phalloidin and 5 μg/mL ToPro3.
SDS detergent experiments
To test the effect of detergent on the coplanarity of divisions at the 2-cell stage in sea urchins, eggs were placed in a solution of 4.10-6 % SDS in sea water (40 ng/mL), from the end of sperm aster centration (10-15 min after fertilization). Embryos were fixed at the 2-cell stage interphase, and stained for Dishevelled, MTs and DNA.
Image Analysis
Correlation between Yolk and MT density
Intensity profiles were taken within the asters, from the yolk and MT channels of immunostaining images of 2-cell stage Xenopus embryos (from 149 to 160 min pf). Profiles were averaged on a 5 pixels width to reduce noise. For each profile, the correlative yolk and MT intensity ratios were plotted along the distance to the nucleus L, using a Matlab script.
Interphase aster branching
MT density was measured from immunostaining images of 1 to 8-cell stage sea urchin embryos, stained for MTs. Intensity profiles were taken from the centrosome to the maximum of MT intensity near the cell cortex (to circumvent staining artefacts that lower MT intensity close to the cell cortex), in several directions. Profiles were averaged on a 5 pixels width and on 1 to 4 z-slices (spaced by 2 μm) to reduce noise. They were corrected for size of the embryo and mean intensity of the image, averaged and fitted by I = b 2L/a / L2 + c in Matlab. L < 5 μm and L > 25 μm ranges were excluded from the fit, because of averaging and staining artifacts respectively.
Supplementary Material
Highlights.
A 3D model iteratively infers blastomere division positions and arrangements
The model can predict the embryonic cleavage patterns in multiple species
Cell shape is a default cue orienting division, biased by yolk or maternal polarity
Self-organization strongly contributes to pattern early embryo development
Acknowledgments
We thank present and past members of the Minc Laboratory for discussions, as well as our colleagues Yohanns Bellaiche, Michel Bornens, Arezki Boudaoud and Kimberley Laband for critical reading of the manuscript. A.P. was supported by an ASN fellowship from ENS Cachan. MW was supported by NIH grants HD073104 and GM39565. This work was supported by the CNRS, and grants from the “Mairie de Paris emergence” program, the FRM “amorçage” grant AJE20130426890 and the European Research Council (CoG FORCASTER N° 647073).
Footnotes
Author Contribution: A.P. developed and performed models. A.P, J.S, M.W and N.M performed experiments. A.P. and N.M designed the research and wrote the manuscript.
Publisher's Disclaimer: This is a PDF file of an unedited manuscript that has been accepted for publication. As a service to our customers we are providing this early version of the manuscript. The manuscript will undergo copyediting, typesetting, and review of the resulting proof before it is published in its final citable form. Please note that during the production process errors may be discovered which could affect the content, and all legal disclaimers that apply to the journal pertain.
References
- Bjerknes M. Physical theory of the orientation of astral mitotic spindles. Science. 1986;234:1413–1416. doi: 10.1126/science.3787253. [DOI] [PubMed] [Google Scholar]
- Bosveld F, Markova O, Guirao B, Martin C, Wang Z, Pierre A, Balakireva M, Gaugue I, Ainslie A, Christophorou N, et al. Epithelial tricellular junctions act as interphase cell shape sensors to orient mitosis. Nature. 2016;530:495–498. doi: 10.1038/nature16970. [DOI] [PMC free article] [PubMed] [Google Scholar]
- Boveri T. Verhandl d Phys-Med Gesellschaft. Vol. 34 Würzburg: 1901. Über die Polarität des Seeigel-Eies. [Google Scholar]
- Brakke KA. The Surface Evolver. Experimental Mathematics. 1992;1:141–165. [Google Scholar]
- Conklin EG. The development of centrifuged eggs of ascidians. The Journal of Experimental Zoölogy. 1931;60:1–120. [Google Scholar]
- Dan K. Studies on unequal cleavage in sea urchins I. Migration of the nuclei to the vegetal pole. Development, Growth and Differentiation. 1979;21:527–535. doi: 10.1111/j.1440-169X.1979.00527.x. [DOI] [PubMed] [Google Scholar]
- Dan K. Studies on unequal cleavage in sea urchins III. Micromere formation under compression. Development, Growth and Differentiation. 1987;29:503–515. doi: 10.1111/j.1440-169X.1987.00503.x. [DOI] [PubMed] [Google Scholar]
- Dan K, Ikeda M. On the system controlling the time of micromere formation in sea urchin embryos. Development Growth and Differentiation. 1971;13 doi: 10.1111/j.1440-169X.1971.00285.x. [DOI] [PubMed] [Google Scholar]
- Danilchik MV, Brown EE, Riegert K. Intrinsic chiral properties of the Xenopus egg cortex: an early indicator of left-right asymmetry? Development. 2006;133:4517–4526. doi: 10.1242/dev.02642. [DOI] [PubMed] [Google Scholar]
- Desnitskiy AG. On the classification of the cleavage patterns in amphibian embryos. Russian Journal of Developmental Biology. 2014;45:1–10. [PubMed] [Google Scholar]
- Dogterom M, Yurke B. Measurement of the force-velocity relation for growing microtubules. Science. 1997;278:856–860. doi: 10.1126/science.278.5339.856. [DOI] [PubMed] [Google Scholar]
- Drechsel DN, Hyman AA, Hall A, Glotzer M. A requirement for Rho and Cdc42 during cytokinesis in Xenopus embryos. Curr Biol. 1997;7:12–23. doi: 10.1016/s0960-9822(06)00023-6. [DOI] [PubMed] [Google Scholar]
- Gilbert S. Developmental Biology. 9th. Sunderland (MA): Sinauer Associates; 2010. Vol 9th Ed. [Google Scholar]
- Goldstein B. Cell contacts orient some cell division axes in the Caenorhabditis elegans embryo. J Cell Biol. 1995;129:1071–1080. doi: 10.1083/jcb.129.4.1071. [DOI] [PMC free article] [PubMed] [Google Scholar]
- Gonczy P. Mechanisms of asymmetric cell division: flies and worms pave the way. Nat Rev Mol Cell Biol. 2008;9:355–366. doi: 10.1038/nrm2388. [DOI] [PubMed] [Google Scholar]
- Grill SW, Hyman AA. Spindle positioning by cortical pulling forces. Dev Cell. 2005;8:461–465. doi: 10.1016/j.devcel.2005.03.014. [DOI] [PubMed] [Google Scholar]
- Hamaguchi MS, Hiramoto Y. Analysis of the Role of Astral Rays in Pronuclear Migration in Sand Dollar Rggs by the Colcemid-UV Method. Develop Growth and Differ. 1986;28:143–156. doi: 10.1111/j.1440-169X.1986.00143.x. [DOI] [PubMed] [Google Scholar]
- Heier J, Takle KA, Hasley AO, Pelegri F. Ploidy manipulation and induction of alternate cleavage patterns through inhibition of centrosome duplication in the early zebrafish embryo. Dev Dyn. 2015;244:1300–1312. doi: 10.1002/dvdy.24315. [DOI] [PMC free article] [PubMed] [Google Scholar]
- Hejnol A. A twist in time--the evolution of spiral cleavage in the light of animal phylogeny. Integr Comp Biol. 2010;50:695–706. doi: 10.1093/icb/icq103. [DOI] [PubMed] [Google Scholar]
- Hertwig O. Ueber den Werth der ersten Furchungszellen fuer die Organbildung des Embryo. Experimentelle Studien am Frosch- und Tritonei. Arch mikr Anat. 1893;xlii:662–807. [Google Scholar]
- Hörstadius S. Über die Determination des Keimes bei Echinodermen. Acta Zoologica Stockholm. 1928;9 [Google Scholar]
- Hörstadius S. The mechanics of sea urchin development, studied by operative methods. Biological Reviews. 1939;14:132–179. [Google Scholar]
- Iseto T, Nishida H. Ultrastructural studies on the centrosome-attracting body: electron-dense matrix and its role in unequal cleavages in ascidian embryos. Dev Growth Differ. 1999;41:601–609. doi: 10.1046/j.1440-169x.1999.00457.x. [DOI] [PubMed] [Google Scholar]
- Kimmel CB, Ballard WW, Kimmel SR, Ullmann B, Schilling TF. Stages of embryonic development of the zebrafish. Dev Dyn. 1995;203:253–310. doi: 10.1002/aja.1002030302. [DOI] [PubMed] [Google Scholar]
- Kozlowski C, Srayko M, Nedelec F. Cortical microtubule contacts position the spindle in C. elegans embryos. Cell. 2007;129:499–510. doi: 10.1016/j.cell.2007.03.027. [DOI] [PubMed] [Google Scholar]
- Kwon M, Bagonis M, Danuser G, Pellman D. Direct Microtubule-Binding by Myosin-10 Orients Centrosomes toward Retraction Fibers and Subcortical Actin Clouds. Dev Cell. 2015;34:323–337. doi: 10.1016/j.devcel.2015.06.013. [DOI] [PMC free article] [PubMed] [Google Scholar]
- Leonard JD, Ettensohn CA. Analysis of dishevelled localization and function in the early sea urchin embryo. Dev Biol. 2007;306:50–65. doi: 10.1016/j.ydbio.2007.02.041. [DOI] [PMC free article] [PubMed] [Google Scholar]
- Maitre JL, Niwayama R, Turlier H, Nedelec F, Hiiragi T. Pulsatile cell-autonomous contractility drives compaction in the mouse embryo. Nat Cell Biol. 2015;17:849–855. doi: 10.1038/ncb3185. [DOI] [PubMed] [Google Scholar]
- Minc N, Burgess D, Chang F. Influence of cell geometry on division-plane positioning. Cell. 2011;144:414–426. doi: 10.1016/j.cell.2011.01.016. [DOI] [PMC free article] [PubMed] [Google Scholar]
- Minc N, Piel M. Predicting division plane position and orientation. Trends Cell Biol. 2012;22:193–200. doi: 10.1016/j.tcb.2012.01.003. [DOI] [PubMed] [Google Scholar]
- Mitchison T, Wuhr M, Nguyen P, Ishihara K, Groen A, Field CM. Growth, interaction, and positioning of microtubule asters in extremely large vertebrate embryo cells. Cytoskeleton (Hoboken) 2012;69:738–750. doi: 10.1002/cm.21050. [DOI] [PMC free article] [PubMed] [Google Scholar]
- Neff AW, Wakahara M, Jurand A, Malacinski GM. Experimental analyses of cytoplasmic rearrangements which follow fertilization and accompany symmetrization of inverted Xenopus eggs. J Embryol Exp Morphol. 1984;80:197–224. [PubMed] [Google Scholar]
- Negishi T, Takada T, Kawai N, Nishida H. Localized PEM mRNA and protein are involved in cleavage-plane orientation and unequal cell divisions in ascidians. Curr Biol. 2007;17:1014–1025. doi: 10.1016/j.cub.2007.05.047. [DOI] [PubMed] [Google Scholar]
- Nishida H. Localization of determinants for formation of the anterior-posterior axis in eggs of the ascidian Halocynthia roretzi. Development. 1994;120:3093–3104. [Google Scholar]
- Nishida H. Vegetal egg cytoplasm promotes gastrulation and is responsible for specification of vegetal blastomeres in embryos of the ascidian Halocynthia roretzi. Development. 1996;122:1271–1279. doi: 10.1242/dev.122.4.1271. [DOI] [PubMed] [Google Scholar]
- Nishikata T, Hibino T, Nishida H. The centrosome-attracting body, microtubule system, and posterior egg cytoplasm are involved in positioning of cleavage planes in the ascidian embryo. Dev Biol. 1999;209:72–85. doi: 10.1006/dbio.1999.9244. [DOI] [PubMed] [Google Scholar]
- Olivier N, Luengo-Oroz MA, Duloquin L, Faure E, Savy T, Veilleux I, Solinas X, Debarre D, Bourgine P, Santos A, et al. Cell lineage reconstruction of early zebrafish embryos using label-free nonlinear microscopy. Science. 2010;329:967–971. doi: 10.1126/science.1189428. [DOI] [PubMed] [Google Scholar]
- Pelegri F, Dekens MP, Schulte-Merker S, Maischein HM, Weiler C, Nusslein-Volhard C. Identification of recessive maternal-effect mutations in the zebrafish using a gynogenesis-based method. Dev Dyn. 2004;231:324–335. doi: 10.1002/dvdy.20145. [DOI] [PubMed] [Google Scholar]
- Pelegri F, Knaut H, Maischein HM, Schulte-Merker S, Nusslein-Volhard C. A mutation in the zebrafish maternal-effect gene nebel affects furrow formation and vasa RNA localization. Curr Biol. 1999;9:1431–1440. doi: 10.1016/s0960-9822(00)80112-8. [DOI] [PubMed] [Google Scholar]
- Peng CJ, Wikramanayake AH. Differential regulation of disheveled in a novel vegetal cortical domain in sea urchin eggs and embryos: implications for the localized activation of canonical Wnt signaling. PLoS One. 2013;8:e80693. doi: 10.1371/journal.pone.0080693. [DOI] [PMC free article] [PubMed] [Google Scholar]
- Raff RA. Constraint, flexibility, and phylogenetic history in the evolution of direct development in sea urchins. Dev Biol. 1987;119:6–19. doi: 10.1016/0012-1606(87)90201-6. [DOI] [PubMed] [Google Scholar]
- Roegiers F, Djediat C, Dumollard R, Rouviere C, Sardet C. Phases of cytoplasmic and cortical reorganizations of the ascidian zygote between fertilization and first division. Development. 1999;126:3101–3117. doi: 10.1242/dev.126.14.3101. [DOI] [PubMed] [Google Scholar]
- Sachs J. Relations between growth and cell-division in the embryonic tissues. Oxford, UK: Clarendon Press; 1887. Lecture XXVII. [Google Scholar]
- Sawada T, Schatten G. Microtubules in ascidian eggs during meiosis, fertilization, and mitosis. Cell Motil Cytoskeleton. 1988;9:219–230. doi: 10.1002/cm.970090304. [DOI] [PubMed] [Google Scholar]
- Schierenberg E. Embryological variation during nematode development. WormBook. 2006:1–13. doi: 10.1895/wormbook.1.55.1. [DOI] [PMC free article] [PubMed] [Google Scholar]
- Summers RG, Morrill JB, Leith A, Marko M, Piston DW, Stonebraker AT. A stereometric analysis of karyokinesis, cytokinesis and cell arrangements during and following fourth cleavage period in he sea urchin, lytechinus variegatus. Development, Growth and Differentiation. 1993;35:41–57. doi: 10.1111/j.1440-169X.1993.00041.x. [DOI] [PubMed] [Google Scholar]
- Tanaka Y. Effects of the surfactants on the cleavage and further development of the sea urchin embryos 1. The inhibition of micromere formation at the fourth cleavage. Development, Growth and Differentiation. 1976;18:113–122. doi: 10.1111/j.1440-169X.1976.00113.x. [DOI] [PubMed] [Google Scholar]
- Tanimoto H, Kimura A, Minc N. Shape-motion relationships of centering microtubule asters. J Cell Biol. 2016;212:777–787. doi: 10.1083/jcb.201510064. [DOI] [PMC free article] [PubMed] [Google Scholar]
- Tassy O, Dauga D, Daian F, Sobral D, Robin F, Khoueiry P, Salgado D, Fox V, Caillol D, Schiappa R, et al. The ANISEED database: digital representation, formalization, and elucidation of a chordate developmental program. Genome Res. 2010;20:1459–1468. doi: 10.1101/gr.108175.110. [DOI] [PMC free article] [PubMed] [Google Scholar]
- Thery M, Jimenez-Dalmaroni A, Racine V, Bornens M, Julicher F. Experimental and theoretical study of mitotic spindle orientation. Nature. 2007;447:493–496. doi: 10.1038/nature05786. [DOI] [PubMed] [Google Scholar]
- Tsou MF, Ku W, Hayashi A, Rose LS. PAR-dependent and geometry-dependent mechanisms of spindle positioning. J Cell Biol. 2003;160:845–855. doi: 10.1083/jcb.200209079. [DOI] [PMC free article] [PubMed] [Google Scholar]
- Urven LE, Yabe T, Pelegri F. A role for non-muscle myosin II function in furrow maturation in the early zebrafish embryo. J Cell Sci. 2006;119:4342–4352. doi: 10.1242/jcs.03197. [DOI] [PubMed] [Google Scholar]
- Webb SE, Lee KW, Karplus E, Miller AL. Localized calcium transients accompany furrow positioning, propagation, and deepening during the early cleavage period of zebrafish embryos. Dev Biol. 1997;192:78–92. doi: 10.1006/dbio.1997.8724. [DOI] [PubMed] [Google Scholar]
- Wennekamp S, Mesecke S, Nedelec F, Hiiragi T. A self-organization framework for symmetry breaking in the mammalian embryo. Nat Rev Mol Cell Biol. 2013;14:452–459. doi: 10.1038/nrm3602. [DOI] [PubMed] [Google Scholar]
- Wilson EB. The cell in development and heredity. New-York: Macmillan; 1925. [Google Scholar]
- Wuhr M, Dumont S, Groen AC, Needleman DJ, Mitchison TJ. How does a millimeter-sized cell find its center? Cell Cycle. 2009;8:1115–1121. doi: 10.4161/cc.8.8.8150. [DOI] [PMC free article] [PubMed] [Google Scholar]
- Wuhr M, Tan ES, Parker SK, Detrich HW, 3rd, Mitchison TJ. A model for cleavage plane determination in early amphibian and fish embryos. Curr Biol. 2010;20:2040–2045. doi: 10.1016/j.cub.2010.10.024. [DOI] [PMC free article] [PubMed] [Google Scholar]
- Xiong F, Ma W, Hiscock TW, Mosaliganti KR, Tentner AR, Brakke KA, Rannou N, Gelas A, Souhait L, Swinburne IA, et al. Interplay of cell shape and division orientation promotes robust morphogenesis of developing epithelia. Cell. 2014;159:415–427. doi: 10.1016/j.cell.2014.09.007. [DOI] [PMC free article] [PubMed] [Google Scholar]
- Yokota H, Neff AW, Malacinski GM. Altering the position of the first horizontal cleavage furrow of the amphibian (Xenopus) egg reduces embryonic survival. Int J Dev Biol. 1992;36:527–535. [PubMed] [Google Scholar]
Associated Data
This section collects any data citations, data availability statements, or supplementary materials included in this article.