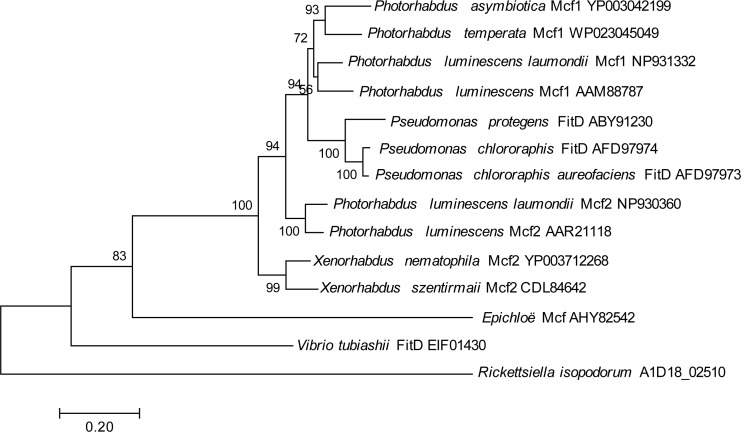
Figure 4. Mcf phylogeny.
Phylogenetic tree showing inferred relationships among Mcf-like genes, obtained via maximum likelihood using the JTT matrix-based model. Numbers indicate bootstrap support using 100 replicates. No outgroup was specified in this analysis; instead, the tree was rooted at the longest branch.

