

Abstract
Background
The aim of this study was to observe the effects of genetic polymorphism of CYP2C19 on inhibitory effects of ticagrelor (Tic) and clopidogrel (Clo) towards post-percutaneous coronary intervention (PCI) platelet aggregation (IPA) and major cardiovascular events (MACE) in patients with acute coronary syndromes (ACS).
Material/Methods
From August 2013 to March 2014, 166 patients with ACS undergoing PCI were selected. The patients were randomly grouped into the Tic group and the Clo group. IPA was detected by thromboelastography (TEG) at 1 week after taking the pills. Genotyping of CYP2C19 gene was determined by analysis of gene sequence detection. Patients were followed up for 1 month and MACE was observed.
Results
The total IPA in the Clo group was significantly increased compared with the Tic group (P<0.05). The IPAs in the 3 subgroups of Clo group were all significantly increased compared with the 3 subgroups of the Tic group (all P<0.05). MACE was not significantly different between Clo and Tic groups (P>0.05). MACE had no significant difference among the 3 subgroups of the Tic group (P>0.05). MACE in the low metabolism subgroup of the Clo group was significantly increased compared with the fast metabolism subgroup and middle metabolism subgroup of Clo group (P<0.05). MACE was not significant different between the fast metabolism subgroup and the middle metabolism subgroup of the Clo group (P>0.05). MACE in the low metabolism subgroup of the Tic group was significantly decreased compared with the low metabolism subgroup of the Clo group (P<0.05).
Conclusions
Ticagrelor has a better effect on inhibition platelet aggregation than Clopidogrel in ACS patients undergoing PCI.
MeSH Keywords: Acute Coronary Syndrome, Percutaneous Coronary Intervention, Platelet Aggregation Inhibitors
Background
The acute coronary syndrome (ACS) is a clinical syndrome with the rupture, hemorrhage, and thrombosis of coronary atherosclerotic plaques as the pathological basis, which can lead to different degrees of coronary arterial stenosis or occlusion, thus further inducing myocardial ischemia or infarction [1]. Percutaneous coronary intervention (PCI) is one of the main methods used to restore coronary blood flow, but the stenting increases incidence of intimal injuries and inflammations, can promote thrombosis, and may lead to in-stent restenosis [2]. The activation and aggregation of platelets plays an important role in the occurrence and development of ACS and post-PCI secondary cardiovascular events. Therefore, when ACS patients are treated using PCI, the application of anti-platelet agents is essential for the successful implementation of PCI and reducing postoperative thromboembolic complications [3]. However, the impacts of factors such as environment and genetic variation lead to the heterogeneity of anti-platelet reactivity, which is particularly obvious in Clo [4]. Clo is a second-generation thienopyridine P2Y12 receptor antagonist, with long-term dominant status in the antithrombotic therapy of ACS, but it also has many shortcomings and defects. Clo is a prodrug that needs to be metabolized into the active form in the liver before it can exert anti-platelet effects; therefore, the onset of Clo is slow. Furthermore, the metabolic enzymes, especially the genetic polymorphism of CYP2C19, can lead to significant individual differences in the anti-platelet activities of Clo, and nearly 30% patients do not achieve the desired platelet inhibition effects [5,6]. Tic is a potent new anti-platelet agent, exhibiting superior effects in ACS patients [7]. Previous studies have mainly focused on comparing the efficacies; there has been little attention to inhibition of platelet aggregation, and even less attention to the genetic polymorphism of CYP2C19. Th present study observed the changes in post-PCI platelet aggregation inhibition rate and MACE in ACS patients with CYP2C19 gene polymorphism after treatment with Tic and Clo, aiming to provide a basis for promotion and application of Tic.
Material and Methods
Study subjects
We selected 166 patients who were hospitalized and diagnosed with ACS, and successfully performed PCI in the Department of Interventional Cardiovascular Medicine of our hospital from August 2013 to March 2014. Inclusion criteria were: age ≥18 years and ≤75 years, the diagnosis was in line with 2013 ESC/ACC/AHA diagnostic criteria; the patients and their families agreed with the study protocol and signed the informed consent; exclusion criteria (who met any 1 of the following conditions would be excluded): age <18 or >75 years; PCI contraindications; contraindications of strengthened antithrombotic therapy; active pathological bleeding or history of intracranial hemorrhage; pregnant women; warfarin treatment; cardiogenic shock; unsuccessful PCI; STEMI mechanical complications such as ventricular septal perforation or papillary muscle rupture; the infarcted vessel was the left main artery; refused clinical follow-up or the clinical follow-up could not be performed [8,9].
Clinical data
The clinical data included basic clinical data, intervention data, and hospitalization data. The basic clinical data included sex, age, race, risk factors, myocardial infarction site, heart function Killip grading, clinical data during treatment, diagnosis-balloon dilatation (DB), time and proportion of tirofiban. The intervention data included the proportions of multiple vascular lesions, infarction-related artery (IRA), blood flow, thrombus grading, and collateral blood flow of thrombolysis in myocardial infarction (TIMI). The clinical data during hospitalization included the peak concentrations of troponin I (TnI) and creatine kinase-Mb (CK-Mb); ST-segment changes of ECG 2 h and 24 h after the blood vessel was made clear, and ventricular ejection fraction (LVEF) 1 week after the surgery.
Research methods and grouping
Before the coronary angiography, the 166 patients were randomly divided into the Tic group (oral loading dose of 180 mg before operation, then 90 mg bid for at least 1 month, a total of 64 cases) and the Clo group (oral loading dose of 600 mg before operation, then 75 mg qd for at least 1 month, a total of 102 cases), the blood was sampled 1 week after the medication, and a thrombelastogram (TEG) was used to record the platelet aggregation inhibition rate (IPA).
All patients had their blood sampled after being admitted to the hospital, and molecular biological methods were used, as well as the Sanger dideoxy chain termination method (CTM). The end of each base was fluorescence labeled, which would result in a series of nucleotides that had different lengths and ended with A, T, C, and G. The above products underwent gel electrophoresis with urea-denatured PAGE to obtain the visible DNA base sequences. The gene sequences of these products were then assessed to determine the existence of gene mutation or sensitive genotype, after which the genotyping of CYP2C19 was analyzed. According to the results of CYP2C19 genotypes in blood samples, the patients in the Tic group and the Clo group were then subgrouped into the normal metabolism subgroup (fast metabolism group, the genotype was CYP2C19*1/*1), the middle metabolism subgroup (genotypes were CYP2C19*1/*2 and *1/*3), and the low metabolism subgroup (genotypes were CYP2C9*2/*2, *3/*3 and *2/*3).
Determination of platelet aggregation rate
One week after the medication, the venous blood was sampled and we measured the adenosine diphosphate (ADP)- induced inhibition of platelet aggregation (IPA) within 2 h using a 5000 thrombelastograph (Haemoscope Co., USA). The TEG software was used to automatically calculate the maximum amplitude (MA) according to the test results using the formula IPA (%)=[(MAADP-MAfibrin)/(MAthrombin-MAfibrin)]×100. MAADP was the ADP-induced clot strength, MAfibrin was the fibrin clot strength, and MAthrombin was the thrombin-induced clot strength showing platelet activity.
MACE
The clinical data were collected, and the clinical follow-up was performed 1 month later. The endpoint was MACE. MACE within 30 days included death, myocardial infarction, emergency revascularization, and stroke.
Statistical analysis
SPSS 20.0 software was used for the statistical analysis. The test revealed that age, DB time, TnI, CK-Mb, and LVEF of the 2 groups did not meet criteria for normal distribution, and thus are expressed as the median and interquartile [M (Q)], and the difference is expressed by the rank sum test. IPA is expressed by mean ± minus standard deviation. The multi-group means were compared with the analysis of variance and the pairwise comparison used the LSD-t test. Count data are expressed as percentages (%). We used the Wilcoxon test for comparison of rank count data such as heart function Killip grading, and we used the chi-square test for comparison of non-hierarchical count data such as sex. The significance level α was set at 0.05.
Results
Clinical data of patients
The results are shown in Tables 1–3. Basic clinical data of the 2 groups included sex, age, infarction site, DB time, heart function Killip grading, various major risk factors of coronary heart disease (e.g., CHD, hypertension, high cholesterol, diabetes, and smoking). Angiographic and interventional treatment data included presence of multi-vessel lesions accompanied with left main-stem lesion, infarct-related vessel site, preoperative TIMI flow, TIMI thrombus grading, and collateral blood flow, as well as final angiographic results after removed the guiding wire. Clinical data during hospitalization included the peak concentrations of cardiac markers TnI and CK-Mb, changes in ECG ST-segment at 2 and 24 h after the blood vessel was reopened, and postoperative 1-week LVEF. The differences between the 2 groups showed no significance.
Table 1.
Comparison of basic clinical data between the 2 groups [%, M(Q)].
| Basic clinical data | Tic group (N=64) | Clo group (N=102) | χ2/Z | P | |
|---|---|---|---|---|---|
| Sex | M | 52 (81.2) | 80 (78.4) | 0.192 | 0.661 |
| F | 12 (18.8) | 22 (21.6) | |||
| Age (years) | 67 (15) | 67 (12) | −0.787 | 0.431 | |
| Infarction site | 1 | 37 (57.8) | 52 (51.0) | 0.738 | 0.390 |
| 2 | 27 (42.2) | 50 (49.0) | |||
| DB Time | 80 (19) | 80 (16) | −1.211 | 0.226 | |
| Hypertension | None | 33 (51.6) | 49 (48.0) | 0.195 | 0.659 |
| Yes | 31 (48.4) | 53 (52.0) | |||
| High cholesterol | None | 33 (51.6) | 46 (45.1) | 0.659 | 0.417 |
| Yes | 31 (48.4) | 56 (54.9) | |||
| Diabetes | None | 43 (67.2) | 71 (69.6) | 0.107 | 0.743 |
| Yes | 21 (32.8) | 31 (30.4) | |||
| Smoke | None | 18 (28.1) | 36 (35.3) | 0.921 | 0.337 |
| Yes | 46 (71.9) | 66 (64.7) | |||
| Killip grade of cardiac function | Grade I | 53 (82.8) | 83 (81.4) | −0.161 | 0.872 |
| Grade II | 6 (9.4) | 13 (12.7) | |||
| Grade III | 5 (7.8) | 6 (5.9) | |||
Table 2.
Comparison of angiographical and interventional data of the 2 groups (%).
| Angiographical and interventional data | Tic group (N=64) | Clo group (N=102) | χ2/Z | P | |
|---|---|---|---|---|---|
| Multivessel lesions | None | 29 (45.3) | 42 (41.2) | 0.275 | 0.600 |
| Yes | 35 (54.7) | 60 (58.8) | |||
| Combined with left main stem lesion | None | 58 (90.6) | 91 (89.2) | 0.085 | 0.771 |
| Yes | 6 (9.4) | 11 (10.8) | |||
| Infarct-related site | 1 | 39 (60.9) | 60 (58.8) | 0.673 | 0.714 |
| 2 | 5 (7.8) | 12 (11.8) | |||
| 3 | 20 (31.2) | 30 (29.4) | |||
| Preoperative TIMI flow | 1 | 25 (39.1) | 33 (32.4) | 1.003 | 0.606 |
| 2 | 25 (39.1) | 41 (40.2) | |||
| 3 | 14 (21.9) | 28 (27.5) | |||
| TIMI thrombus grade | 1 | 24 (37.5) | 34 (33.3) | −0.376 | 0.707 |
| 2 | 25 (39.1) | 44 (43.1) | |||
| 3 | 15 (23.4) | 24 (23.5) | |||
| Collateral blood flow | None | 43 (67.2) | 69 (67.6) | 0.004 | 0.951 |
| Yes | 21 (32.8) | 33 (32.4) | |||
Table 3.
comparison of clinical data during hospitalization between the 2 groups [M(Q)].
| Clinical data during hospitalization | Tic group (N=64) | Clo group (N=102) | Z/χ2 | P | |
|---|---|---|---|---|---|
| TnI | 95.28 (147.62) | 107.82 (151.59) | −0.013 | 0.989 | |
| CK-Mb | 206.59 (224.56) | 184.39 (166.48) | −1.188 | 0.235 | |
| Changes of ST segment | Increased | 22 (34.4%) | 39 (38.2%) | 2.392 | 0.302 |
| Decreased | 28 (43.8%) | 33 (32.4%) | |||
| T wave inversion | 14 (21.9%) | 30 (29.4%) | |||
| LVEF (%) | 60 (20) | 58 (16) | −0.586 | 0.558 | |
IPA of the 2 groups
At 1 week after the medication with Tic and Clo, the IPA of the 2 groups was detected. The results shown in Figure 1 reveal that the total IPA of the Tic group was significantly higher than the Clo group (P<0.05).
Figure 1.
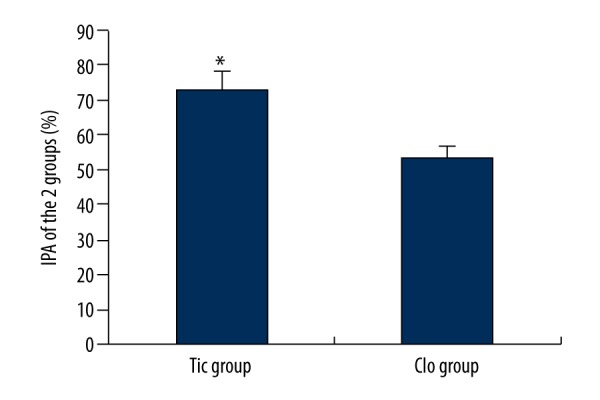
IPA comparison of the 2 groups. * Compared with the Clo group, P<0.05.
IPA of the patients with different genotypes
In the Tic group, the genotyping results of the patients with CYP2C19 gene were 26 cases of fast metabolism type, 28 cases of middle metabolism type, and 10 cases of slow metabolism type, while in the Clo group there were 44 cases, 44 cases, and 14 cases, respectively. The numbers of IPA cases in the 3 genotype subgroups in the Tic group were significantly higher than in the Clo group (all P<0.05), while there was no statistically significant difference in IPA among the 3 genotype subgroups of the Tic group (all P>0.05). In the Clo group, IPA in the slow metabolism group was significantly lower than in the fast metabolism group and the middle metabolism group (P<0.05), while intergroup comparison between the fast metabolism group and the middle metabolism group showed not significant different (P>0.05) (Figure 2).
Figure 2.
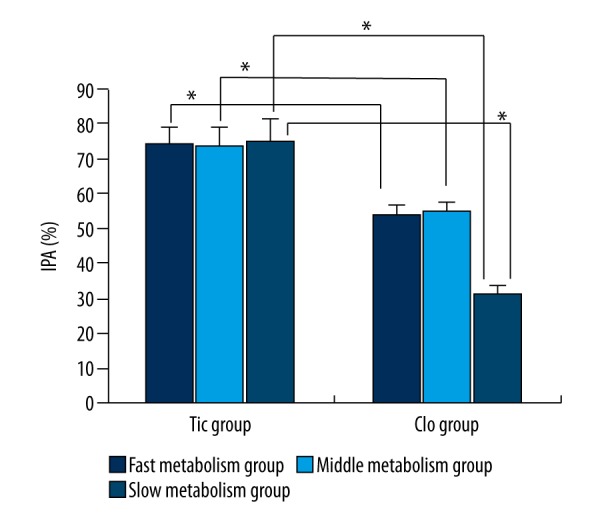
IPA comparison of different genotypes of the 2 groups. * P<0.05 indicates the difference was statistically significant.
Tic and Clo groups of patients with MACE events
The ACS patients were administrated Tic and Clo after PCI, then clinically followed up for 1 month to observe the occurrence of MACE. The results in Table 4 show there were no statistically significant differences (P>0.05) in rates of myocardial infarction, revascularization, and stroke between the 2 groups.
Table 4.
Comparison of MACE between the 2 groups (%).
| MACE | Tic group (N=64) | Clo group (N=102) | χ2 | P | |
|---|---|---|---|---|---|
| Death | None | 60 (93.8) | 92 (90.2) | 0.643 | 0.423 |
| Yes | 4 (6.2) | 10 (9.8) | |||
| Myocardial infarction | None | 60 (93.8) | 92 (90.2) | 0.643 | 0.423 |
| Yes | 4 (6.2) | 10 (9.8) | |||
| Revascularization | None | 59 (92.2) | 89 (87.3) | 0.990 | 0.320 |
| Yes | 5 (7.8) | 13 (12.7) | |||
| Cerebral stroke | None | 58 (90.6) | 90 (88.2) | 0.232 | 0.630 |
| Yes | 6 (9.4) | 12 (11.8) | |||
MACE of different genotypes in the 2 groups
Table 5 shows there were no statistically significant differences in rates of death, myocardial infarction, revascularization, and stroke among different genotype subgroups of the Tic group. Table 6 shows there was a statistically significant difference (P<0.05) in the rates of death, myocardial infarction, revascularization, and stroke among different genotype subgroups of the Clo group. A pairwise comparison showed that the MACE rate of the slow metabolism subgroup was significantly higher than in the fast and middle metabolism subgroups (all P<0.05), while there was no statistical significant difference in the MACE rate between the latter 2 subgroups (P>0.05). The MACE rate in the slow metabolism subgroup of the Tic group was significantly lower than that of the Clo group (P<0.05) (Tables 5, 6).
Table 5.
MACE of different genotype subgroups of the Tic group (%).
| MACE | Fast metabolism group (N=26) | Middle metabolism group (N=28) | Slow metabolism group (N=10) | χ2 | P | |
|---|---|---|---|---|---|---|
| Death | None | 25 (96.2) | 26 (92.9) | 9 (90.0) | 0.537 | 0.765 |
| Yes | 1 (3.8) | 2 (7.1) | 1 (10.0) | |||
| Myocardial infarction | None | 25 (96.2) | 25 (89.3) | 10 (100.0) | 2.380 | 0.304 |
| Yes | 1 (3.8) | 3 (10.7) | 0 (0.0) | |||
| Revascularization | None | 24 (92.3) | 25 (89.3) | 10 (100.0) | 1.923 | 0.382 |
| Yes | 2 (7.7) | 3 (10.7) | 0 (0.0) | |||
| Cerebral stroke | None | 24 (92.3) | 24 (85.7) | 10 (100.0) | 2.756 | 0.252 |
| Yes | 2 (7.7) | 4 (14.3) | 0 (0.0) | |||
Table 6.
MACE of different genotype subgroups of the Clo group (%).
| MACE | Fast metabolism group (N=44) | Middle metabolism group (N=44) | Slow metabolism group (N=14) | χ2 | P | |
|---|---|---|---|---|---|---|
| Death | None | 42 (95.5) | 41 (93.2) | 9 (64.3) | 9.009 | 0.011 |
| Yes | 2 (4.5) | 3 (6.8) | 5 (35.7) | |||
| Myocardial infarction | None | 43 (97.7) | 41 (93.2) | 8 (57.1) | 14.863 | 0.001 |
| Yes | 1 (2.3) | 3 (6.8) | 6 (42.9) | |||
| Revascularization | None | 42 (95.5) | 39 (88.6) | 8 (57.1) | 11.279 | 0.004 |
| Yes | 2 (4.5) | 5 (11.4) | 6 (42.9) | |||
| Cerebral stroke | None | 41 (93.2) | 40 (90.9) | 9 (64.3) | 6.930 | 0.031 |
| Yes | 3 (6.8) | 4 (9.1) | 5 (35.7) | |||
Discussion
Clo is a second-generation thienopyridine; as a prodrug, it has anti-platelet activity only after it is activated by relative enzymatic transformation in vivo. Clo is absorbed in the small intestine, then combines with ATP and is regulated by the B-1-encoded proton pump P-glycoprotein [10]. After that, 85% of the prodrug is metabolized in the liver by carboxylesterase and forms inactive carboxylic esters, while 15% is catalytically generated by the intermediate products CYP2C19, CYP1A2, and CYP2B6, then is metabolized by CYP3A4, CYP2B6, CYP2C19, CYP2C9, and paraoxonase and forms the activated products [11]. These active products irreversibly antagonize P2Y12 and ADP receptor on the platelet surface, thereby inhibiting the binding of fibrinogen and glycoprotein GPIIbIIIa receptors and affecting platelet aggregation.
The distribution of CYP2C19 gene polymorphism, which is the key enzyme regulating the metabolism of Clo, is the most important factor. At least 20 mutations of CYP2C19 gene have been found [12]. CYP2C19 *1 is the wild-type gene with normal functions; CYP2C19 *2 and CYP2C19 *3 are the common genotypes with lost functions and a few relatively rare ones, such CYP2C19 *4/5/8, which can lead to the reduction or absence of CYP2C19 functions. The fast metabolism type (*1/*1) carries homozygous CYP2C19 *1 allele; the middle metabolism type (*1/*2, *1/*3, *1/*4, *1/*8) carries 1 heterozygous allele that loses the CYP2C19 functions and combines with the wild-type gene; and the slow metabolism (*2/*2, *2/*3, *2/*4, *3/*3) carries 2 mutant alleles with functional loss, and is expressed as a homozygote-mutant heterozygote. The distributions of CYP2C19 vary among ethnic groups in humans [13]. CYP2C19 *2/*2, CYP2C19 *2/*3, and CYP2C19 *3/*3, which were most commonly seen, are defined as the slow metabolism type; their incidence in Asians (10–25%) is much higher than in whites and Africans [14]. A genotyping study of TRITON-TIMI 38 observed at least 1 subject carrying the CYP2C19 functional-loss allele (34%), and the plasma level of active metabolites of Clo were decreased by 32.4% compared to the non-carriers. The data of the middle metabolism group and the slow metabolism group show that the risk of MACE combined with endpoint in the patients carrying CYP2C19 allele was increased by 53%, and the risk of in-stent thrombosis was also doubled [35], indicating that the CYP2C19 gene polymorphism showed resistance to Clo (clopidogrel resistance, CR).
There are 3 clinically practical methods for treating CR: the first is to increase the dose of Clo, including the loading dose and the maintenance dose; the second is to combine the application of Cilostazol; and the third is to replace other new anti-platelet drugs. However, a study that increased the Clo loading dose found that when CHD patients carrying genotypes CYP2C19 *1*1, CYP2C19 *1*2, and CYP2C19 *2*2 were given a 300 mg or 900 mg loading dose of Clo, the platelet reactivity was changed, but the CYP2C19 *2*2 patients with homozygous mutation exhibited no improvement of platelet reactivity after receiving an increased the loading dose of Clo [15]. Another study also that showed increasing the maintenance dose of Clo by 2 times or even 3 times did not improve the platelet reactivity of patients with YP2C19 *2*2 genotype. Cilostazol can inhibit the phosphodiesterase activity inside platelets, thus increasing the cAMP concentration of platelets and thereby inhibiting ADP-induced platelet aggregation [16]. Shim, using the VerfiNow method, proved that the anti-platelet triple combination therapy of Cilostazol, aspirin, and Clo can significantly reduce the incidence of post-PCI CR [17]. Suh also proved that anti-platelet triple combination therapy, which was combined with Cilostazol, can improve platelet reactivity, but showed no significant improvement in incidence of adverse cardiovascular events [18].
Prasugrel is a new anti-platelet drug and third-generation thienopyridine prodrug, which also needs to be metabolized in the liver to be transformed into the active metabolites and exert its anti-platelet effects. Its anti-platelet effects were stronger than those of Clo, but the risk of bleeding was also higher. Tic is a new anti-platelet drug; compared with Clo, it had advantages such as rapid onset of effects, strong activities, and rapid recovery after discontinuation. A study has confirmed that Tic is better than Clo in reducing the incidence of cardiovascular death, myocardial infarction, and stroke in ACS patients or patients with PCI [19]. A study found that when 98 patients with stable CHD were given a 300-mg loading dose of Clo once, the platelet function screening revealed 41 patients with low Clo reactivity, and when randomly administrated Clo 600 mg/75 mg or Tic 180 mg/90 mg twice a day, the results showed that the patients with low Clo reactivity had more effective and stable platelet inhibition when treatment was replaced with Tic instead of high-dose Clo [20].
In metabolism in vivo, Tic can be metabolized by CYP3A4, but CYP2C19 does not participate in this metabolism. Wallentin collected genetic samples of 10 285 patients from among the PLATO participants to analyze the effects of CYP2C19 and ABCB1 gene polymorphisms on Tic and Clo, showing that Tic was still improved the functional gene deletion results of CR patients. In addition, during the treatment, the simultaneous application of proton pump inhibitor significantly increased the levels of platelet aggregation in the Clo group, while the Tic group showed no significant changes, suggesting that Tic can effectively solve the CR problem caused by the combination of proton pump inhibitors [21]. Furthermore, a study by Storey used genotype analysis in patients with stable CHD and non-ST-segment elevation myocardial infarction, and confirmed that the gene polymorphisms of P2Y12 receptor, including the mutations of P2RY12, P2RY1, and ITGB3, did not cause Tic to inhibit the platelet aggregation [22]. Our study found that the oral administration of Clo reduced IPA in the ACS patients with CYP2C19 functional loss after PCI, and the clinical prognosis might be worse. The oral administration of Tic can overcome the influence of genetic polymorphisms on Clo, thus better inhibiting platelet aggregation and improving clinical outcomes.
Conclusions
Our study shows that after the ACS patients with CYP2C19 polymorphism underwent PCI, Tic had better inhibitory effects on platelet aggregation compared to Clo, and the use of Tic is superior to Clo in emergency interventions.
Footnotes
Disclosure of conflict of interest
None.
Source of support: Departmental sources
References
- 1.Rajpurohit N, Ayaz SZ, Yee J, et al. Review of acute coronary syndromes: Diagnosis and management of unstable angina and non ST-elevation myocardial infarction. SD Med. 2015;68:71–73. 75. [PubMed] [Google Scholar]
- 2.Clemmensen P, Wiberg S, Van’t Hof A, et al. Acute stent thrombosis after primary percutaneous coronary intervention: insights from the EUROMAX trial (European Ambulance Acute Coronary Syndrome Angiography) JACC Cardiovasc Interv. 2015;8:214–20. doi: 10.1016/j.jcin.2014.11.002. [DOI] [PubMed] [Google Scholar]
- 3.Garg P, Galper BZ, Cohen DJ, et al. Balancing the risks of bleeding and stent thrombosis: A decision analytic model to compare durations of dual antiplatelet therapy after drug-eluting stents. Am Heart J. 2015;169:222–33. doi: 10.1016/j.ahj.2014.11.002. [DOI] [PMC free article] [PubMed] [Google Scholar]
- 4.Garabedian T, Alam S. High residual platelet reactivity on clopidogrel: Its significance and therapeutic challenges overcoming clopidogrel resistance. Cardiovasc Diagn Ther. 2013;3:23–37. doi: 10.3978/j.issn.2223-3652.2013.02.06. [DOI] [PMC free article] [PubMed] [Google Scholar]
- 5.Rai M, Seip RL, Gupta A, et al. CYP2C19 genotype-guided antiplatelet therapy in a patient with clopidogrel resistance. Conn Med. 2012;76:267–72. [PubMed] [Google Scholar]
- 6.Nguyen TA, Diodati JG, Pharand C. Resistance to clopidogrel: A review of the evidence. J Am Coll Cardiol. 2005;45:1157–64. doi: 10.1016/j.jacc.2005.01.034. [DOI] [PubMed] [Google Scholar]
- 7.Lindholm D, Varenhorst C, Cannon CP, et al. Ticagrelor vs. clopidogrel in patients with non-ST-elevation acute coronary syndrome with or without revascularization: results from the PLATO trial. Eur Heart J. 2014;35:2083–93. doi: 10.1093/eurheartj/ehu160. [DOI] [PMC free article] [PubMed] [Google Scholar]
- 8.Mega JL, Close SL, Wiviott SD, et al. Cytochrome p-450 polymorphisms and response to clopidogrel. N Engl J Med. 2009;360:354–62. doi: 10.1056/NEJMoa0809171. [DOI] [PubMed] [Google Scholar]
- 9.Kim LK, Feldman DN, Swaminathan RV, et al. Rate of percutaneous coronary intervention for the management of acute coronary syndromes and stable coronary artery disease in the United States (2007 to 2011) Am J Cardiol. 2014;114:1003–10. doi: 10.1016/j.amjcard.2014.07.013. [DOI] [PubMed] [Google Scholar]
- 10.Azmoon S, Angiolillo DJ. Switching antiplatelet regimens: Alternatives to clopidogrel in patients with acute coronary syndrome undergoing PCI: A review of the literature and practical considerations for the interventional cardiologist. Catheter Cardiovasc Interv. 2013;81:232–42. doi: 10.1002/ccd.24480. [DOI] [PubMed] [Google Scholar]
- 11.Samardzic J, Bozina N, Skoric B, et al. CYP2C19*2 genotype influence in acute coronary syndrome patients undergoing serial clopidogrel dose tailoring based on platelet function testing: Analysis from randomized controlled trial NCT02096419. Int J Cardiol. 2015;186:282–85. doi: 10.1016/j.ijcard.2015.03.171. [DOI] [PubMed] [Google Scholar]
- 12.Sim SC, Risinger C, Dahl ML, et al. A common novel CYP2C19 gene variant causes ultrarapid drug metabolism relevant for the drug response to proton pump inhibitors and antidepressants. Clin Pharmacol Ther. 2006;79:103–13. doi: 10.1016/j.clpt.2005.10.002. [DOI] [PubMed] [Google Scholar]
- 13.Minarik M, Kopeckova M, Gassman M, et al. Rapid testing of clopidogrel resistance by genotyping of CYP2C19 and CYP2C9 polymorphisms using denaturing on-chip capillary electrophoresis. Electrophoresis. 2012;33:1306–10. doi: 10.1002/elps.201100457. [DOI] [PubMed] [Google Scholar]
- 14.Wedlund PJ. The CYP2C19 enzyme polymorphism. Pharmacology. 2000;61:174–83. doi: 10.1159/000028398. [DOI] [PubMed] [Google Scholar]
- 15.Di Sciascio G, Patti G, Pasceri V, et al. ARMYDA-4 RELOAD Investigators. Clopidogrel reloading in patients undergoing percutaneous coronary intervention on chronic clopidogrel therapy: results of the ARMYDA-4 RELOAD (Antiplatelet therapy for Reduction of Myocardial Damage during Angioplasty) randomized trial. Eur Heart J. 2010;31:1337–43. doi: 10.1093/eurheartj/ehq081. [DOI] [PubMed] [Google Scholar]
- 16.Mega JL, Hochholzer W, Frelinger AL, 3rd, et al. Dosing clopidogrel based on CYP2C19 genotype and the effect on platelet reactivity in patients with stable cardiovascular disease. JAMA. 2011;306:2221–28. doi: 10.1001/jama.2011.1703. [DOI] [PubMed] [Google Scholar]
- 17.Shim CY, Yoon SJ, Park S, et al. The clopidogrel resistance can be attenuated with triple antiplatelet therapy in patients undergoing drug-eluting stents implantation. Int J Cardiol. 2009;134:351–55. doi: 10.1016/j.ijcard.2008.02.016. [DOI] [PubMed] [Google Scholar]
- 18.Suh JW, Lee SP, Park KW, et al. Multicenter randomized trial evaluating the efficacy of cilostazol on ischemic vascular complications after drug-eluting stent implantation for coronary heart disease: results of the CILON-T (influence of Cilostazol-based triple antiplatelet therapy ON ischemic complication after drug-eluting stenT implantation) trial. J Am Coll Cardiol. 2011;57:280–89. doi: 10.1016/j.jacc.2010.08.631. [DOI] [PubMed] [Google Scholar]
- 19.Wallentin L, Becker RC, Budaj A, et al. PLATO Investigators. Ticagrelor versus clopidogrel in patients with acute coronary syndromes. N Engl J Med. 2009;361:1045–57. doi: 10.1056/NEJMoa0904327. [DOI] [PubMed] [Google Scholar]
- 20.Gurbel PA, Bliden KP, Butler K, et al. Response to ticagrelor in clopidogrel nonresponders and responders and effect of switching therapies: The RESPOND study. Circulation. 2010;121:1188–99. doi: 10.1161/CIRCULATIONAHA.109.919456. [DOI] [PubMed] [Google Scholar]
- 21.Wallentin L, James S, Storey RF, et al. PLATO Investigators. Effect of CYP2C19 and ABCB1 single nucleotide polymorphisms on outcomes of treatment with ticagrelor versus clopidogrel for acute coronary syndromes: A genetic substudy of the PLATO trial. Lancet. 2010;376:1320–28. doi: 10.1016/S0140-6736(10)61274-3. [DOI] [PubMed] [Google Scholar]
- 22.Storey RF, Husted S, Harrington RA, et al. Inhibition of platelet aggregation by AZD6140, a reversible oral P2Y12 receptor antagonist, compared with clopidogrel in patients with acute coronary syndromes. J Am Coll Cardiol. 2007;50:1852–56. doi: 10.1016/j.jacc.2007.07.058. [DOI] [PubMed] [Google Scholar]