

Synthetic lethality between the clinically approved noncancer drugs metformin and syrosingopine specifically kills cancer cells.
Keywords: metformin, biguanide, syrosingopine, Mitochondria, Cancer, metabolism, synthetic lethality
Abstract
We report that the anticancer activity of the widely used diabetic drug metformin is strongly potentiated by syrosingopine. Synthetic lethality elicited by combining the two drugs is synergistic and specific to transformed cells. This effect is unrelated to syrosingopine’s known role as an inhibitor of the vesicular monoamine transporters. Syrosingopine binds to the glycolytic enzyme α-enolase in vitro, and the expression of the γ-enolase isoform correlates with nonresponsiveness to the drug combination. Syrosingopine sensitized cancer cells to metformin and its more potent derivative phenformin far below the individual toxic threshold of each compound. Thus, combining syrosingopine and codrugs is a promising therapeutic strategy for clinical application for the treatment of cancer.
INTRODUCTION
Metformin, an oral antidiabetic of the biguanide class, is the most widely prescribed drug for type 2 diabetes. It acts as a mild mitochondrial inhibitor, and its impact on key metabolic organs, such as the liver and muscle, results in reduced blood glucose levels and restoration of insulin responsiveness at the whole-body level. Metformin is a well-tolerated drug that can be taken for years with few adverse effects, such as rare cases of lactic acidosis.
There is increasing evidence that metformin, in addition to its antidiabetic effect, has anticancer properties. Epidemiological studies have shown that the incidence of cancer is significantly reduced in diabetic patients on metformin (1–5). Metformin prescription as a neoadjuvant also results in an improved clinical response after operation (6, 7). These observations are corroborated by in vitro studies in which metformin inhibits growth of cancer cell lines from a wide variety of tissue types (8), and in vivo studies where metformin is active in mouse xenograft models (9). Metformin is believed to exert its anticancer effect by an indirect systemic and direct cellular effect (10). The systemic effect of metformin lowers blood glucose levels and, hence, glucose availability to glucose-hungry cancer cells. At the cellular level, metformin inhibits mitochondrial respiration in cancer cells that are already experiencing a shortfall in glucose uptake, leading to lower adenosine 5′-triphosphate (ATP) levels. The resulting activation of AMPK leads to inhibition of mammalian target of rapamycin complex 1 (mTORC1), a major signaling hub for cell growth, translation, and metabolism. Several clinical trials investigating metformin’s antineoplastic activity are currently in progress [www.clinicaltrials.gov, which is reviewed by Pollak and Chae et al. (11, 12)]. Despite this generally favorable picture of metformin as a potential anticancer agent, there is a persistent background of studies where metformin shows little to no effect in cancer (13–16) or no benefit in comparison with other antidiabetics (17, 18).
A resolution to the discrepancy between the studies noted above is that the concentration of metformin used to obtain antineoplastic activity in vitro greatly exceeds the in vivo serum concentration that can be attained with standard antidiabetic prescription (19). Thus, there may be a clinical gray zone, where metformin efficacy is dependent on factors that may vary between different study groups. This suggests that, for the development of metformin as a clinically efficacious anticancer agent, it would be desirable to lower its therapeutic threshold to within a reasonably attainable range in vivo. With this objective, we performed a screening to identify compounds that interact with a low, sublethal concentration of metformin to induce cancer cell killing. We show that the antihypertensive syrosingopine, a derivative of reserpine, is synthetically lethal with metformin and that both compounds interact synergistically to kill a broad variety of cancer cell types while demonstrating no activity against nontransformed cells. Synthetic lethality with syrosingopine was also observed with every inhibitor of the mitochondrial electron transport chain (ETC) tested. The synthetic lethal interaction evoked by syrosingopine and mitochondrial inhibitors occurs at concentrations substantially below the toxic threshold for either compound alone. These results suggest that a combination of syrosingopine with mitochondrial inhibitors represents a novel option for both classes of compounds in cancer therapy. Lowering the therapeutic threshold of metformin, and the related biguanide phenformin, may allow their clinical application as anticancer agents.
RESULTS
Syrosingopine potentiates cell killing by metformin
We screened a drug library (1120 compounds) using murine 6.5 mast cells to identify drugs that are cytotoxic only in the presence of metformin. These are Pten-null, vH-Ras–expressing, and mTORC2-addicted cells that display a transformed phenotype (20). Parallel screens were performed in the absence and presence of metformin. The concentration of metformin used in the screen was determined by a prior titration with metformin; eventually, 4 mM metformin was chosen because it has minimal effect on cell growth (fig. S1A). Syrosingopine was the only compound that fulfilled our selection criteria (>80% growth in the absence of metformin and <10% growth in the presence of metformin; Fig. 1A). Syrosingopine is a semisynthetic derivative of reserpine (fig. S1B), both of which are clinically approved antihypertensives (21).
Fig. 1. Synthetic lethality between syrosingopine and metformin.

(A) Proliferation assay of murine 6.5 cells titrated with increasing amounts of syrosingopine (S) alone and in the presence of 4 mM metformin (S+M). (B and C) Similar titration in various human cancer cell lines: HL60 (promyelocytic leukemia), OPM2 (multiple myeloma), and HT1080 (fibrosarcoma). (D) Titration of ex vivo human leukemic blasts (AML7991) and similar titration with peripheral blood cells (PBC1) from a healthy donor. (E) Annexin V staining for apoptotic cells was performed on HL60 cells after 20 hours of treatment with syrosingopine (Syro; 5 μM), metformin (Met; 5 mM), or in combination. Viable cells are in the lower left quadrant, and early apoptotic and late apoptotic cells are in the lower right and upper right quadrants, respectively. Bottom: Phase-contrast microscopy of the same cells. Ctrl, control. (F) Fluorescence-activated cell sorting (FACS) profile of annexin V–stained CML7359 leukemic blast cells treated for 60 hours with syrosingopine (5 μM), metformin (5 mM), and in combination (S+M). The cells were also treated with staurosporine (Stauro; 1 μM) as a positive control (Con) for apoptosis.
The synthetic lethal interaction was observed in most cell lines tested (35 of 43 lines; table S1, selected lines shown in Fig. 1B, with corresponding metformin titrations in fig. S1A), representing a broad range of histotypes. Notably, some cell lines are nonresponsive to the treatment (Fig. 1C), indicating that the effect is not due to indiscriminate toxicity generated by the drug combination but is selective.
The efficacy of the metformin-syrosingopine combination was tested on ex vivo primary leukemic cells. These cells have limited proliferation and survival in vitro but, nonetheless, provide an opportunity to test drug efficacy on clinically derived material (22, 23). Peripheral blasts were obtained from 15 leukemia patients [14 acute myeloid leukemia (AML) and 1 chronic myeloid leukemia (CML) patients] undergoing blast crisis. Individual patient-derived primary cells showed a wide range of sensitivity to metformin (fig. S2, A and B). Titration of syrosingopine in the presence of 5 mM metformin in 12 samples showed synergistic cell killing in all cases (Fig. 1D and fig. S3A). Blast cells from 3 patients were metformin-sensitive compared to the previous 12 patients (fig. S2B), but in one case (AML8124), it was still possible to perform a cotitration with syrosingopine at a lower metformin concentration (2.5 mM). This also turned out to be responsive to the drug combination (fig. S3A). Thus, all primary leukemic cells tested (13 of 13) responded to syrosingopine-metformin treatment. Peripheral blood cells from healthy blood donors were insensitive to metformin and to syrosingopine-metformin treatment (Fig. 1D and fig. S3B). Two nontransformed cell lines generated from primary human skin fibroblasts, Fib3 and Fib4, were also nonresponsive to the drug combination, suggesting that the effect is specific to transformed cells (fig. S3C).
The mode of cell death occurred via induction of apoptosis, as measured by annexin V staining, an early apoptotic marker, with first indications of cell death observed by 20 hours after treatment (Fig. 1E). This was confirmed with an alternative assay, measuring cell viability, cytoxicity, and caspase activity (fig. S4A). Annexin V staining of blast cells from one leukemic patient (CML7359) confirmed that, in primary human leukemic blasts, the mode of killing was also due to induction of apoptosis (Fig. 1F).
Hepatospheres are three-dimensional (3D) cultures of hepatocytes that more accurately mimic the in vivo conditions of solid tumors compared to conventional monolayer cell culture (24). We generated hepatospheres from the hepatocellular carcinoma lines Huh7 and HepG2, which are responsive to the syrosingopine-metformin combination in monolayer cell culture (table S1). The drug combination, when added 24 hours after sphere formation, caused disaggregation of fully formed hepatospheres and killing of individual cells (Fig. 2A and fig. S4B). However, the amount of syrosingopine and the length of treatment were greater than those required for killing of the cell lines in 2D cultures.
Fig. 2. Efficacy of drug combination in mouse and solid tumor models.
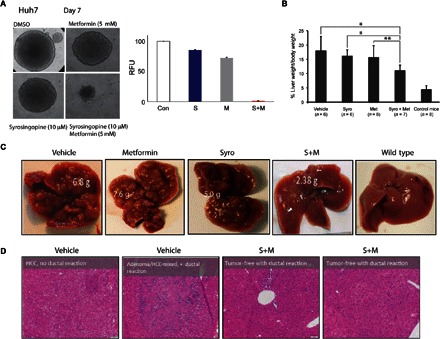
(A) Hepatospheres of Huh7 hepatocellular carcinoma cells treated with syrosingopine and metformin as indicated. Right: Quantitation of surviving cells by resazurin staining. DMSO, dimethyl sulfoxide; RFU, relative fluorescence units. (B) Reduction in the ratio of liver weight/body weight in the mouse liver cancer model treated with syrosingopine-metformin. *P = 0.9 and **P = 0.95. (C) External liver appearance after 2 weeks of drug treatment. (D) Histological sections from vehicle- and drug combination–treated livers and accompanying pathological report. HCC, hepatocellular carcinoma.
The in vivo efficacy of the drug combination was tested in a mouse liver cancer model. Tumor development in these mice is driven by liver-specific deletion of the tumor suppressors Tsc1 and Pten, causing hyperactive mTORC1 and mTORC2 signaling. The liver is greatly enlarged, and tumor nodules develop at multiple foci, starting from 12 weeks of age. Twenty-five 15-week-old Tsc1−/Pten− liver knockout mice were treated on alternate days with syrosingopine (7.5 mg/kg body weight), metformin (200 mg/kg), or in combination, for a total of six treatments. Already after this short treatment, there was a reduction in liver size and the number of visible tumor nodules (Fig. 2, B and C). Histological examination of liver sections showed a reduction in tumor burden. The pathological report classified combination-treated mice as having fewer and smaller nodules with large necrotic areas that were absent in vehicle-treated controls (Fig. 2D). Livers from two combination-treated mice were classified as tumor-free.
Syrosingopine is synthetic lethal with inhibition of the mitochondrial ETC
Metformin inhibits complex I of the mitochondrial ETC to disrupt oxidative phosphorylation and mitochondrial ATP generation (25–27). Complex I inhibition by metformin has been shown to have a direct antitumor effect (28). Phenformin, a more potent analog of metformin, has been proposed as an alternative to metformin in the frame of anticancer therapy (29). Phenformin also synergized strongly with syrosingopine (fig. S5A), suggesting a common mode of action with metformin in eliciting synthetic lethality with syrosingopine, namely, via complex I inhibition.
Next, we tested syrosingopine in combination with an array of pharmacological agents that inhibit the ETC at different points, comprising inhibitors against all four ETC complexes, an inhibitor of the F1FO ATP synthase, and a proton ionophore [carbonyl cyanide p-trifluoromethoxyphenylhydrazone (FCCP)] that dissipates the mitochondrial membrane potential. Cell death was induced in all cases, indicating that synthetic lethality is indeed due to inhibition of mitochondrial ETC activity and not via an extramitochondrial off-target effect of the biguanide drugs metformin and phenformin (Fig. 3A and fig. S5B).
Fig. 3. Syrosingopine is synthetic lethal with mitochondrial ETC inhibition.

(A) Proliferation assay of 6.5 cells treated with syrosingopine alone (blue lines) or in combination (red lines) with various mitochondrial inhibitors: piericidin A (1 nM), sodium malonate (30 mM), antimycin A (5 nM), sodium azide (1 mM), oligomycin (1 nM), and FCCP (10 μM). Data shown are non-normalized, and the y axis intercept shows the effect on cell growth of each mitochondrial inhibitor by itself in the absence of syrosingopine. (B) Immunoblot of 6.5, HL60, and OPM2 parental and ρ0-derived lines for mitochondrial genome–encoded MT-Co1 (mitochondrially encoded cytochrome c oxidase I). GAPDH, glyceraldehyde-3-phosphate dehydrogenase. (C) Proliferation assay of 6.5, HL60, and OPM2 parental cells (blue lines) and ρ0 derivatives (red lines), titrated with increasing concentrations of syrosingopine. Growth was measured after 3 days of treatment.
To independently corroborate these findings, we generated cells lacking the mitochondrial genome. The mitochondrial genome encodes components of the ETC, and cells depleted of mitochondrial DNA (termed ρ0 cells) are consequently devoid of ETC activity, thereby approximating a condition of constitutive ETC inhibition (30). ρ0 cells derived from 6.5, HL60, and OPM2 (Fig. 3B) became exquisitely sensitive to syrosingopine alone compared to their parental cells (Fig. 3C). These results allow us to generalize that syrosingopine is synthetic lethal with inhibition of mitochondrial electron transport.
Syrosingopine potentiates the anticancer efficacy of metformin and other mitochondrial inhibitors
Metformin and its more potent analog phenformin have attracted interest as potential anticancer agents (29). However, the concentrations required for anticancer efficacy in preclinical models are greater than the plasma concentration attained with typical dosing in diabetic patients (19). We performed a titration of metformin, phenformin, and selected mitochondrial inhibitors in HL60 cells in the presence of a fixed concentration of syrosingopine (5 μM) (Fig. 4A). There was a shift in metformin sensitivity of approximately 15-fold [from a median inhibitory concentration (IC50) of ~30 to ~2 mM] in the presence of syrosingopine and 13-fold with phenformin (IC50 from ~400 to 30 μM). Piericidin A was not toxic up to 16 nM but had an IC50 of 2 nM with syrosingopine. Rotenone had a 10-fold shift in potency (IC50 from ~200 to 20 nM with syrosingopine). Antimycin A had an IC50 at ~3 nM with syrosingopine while showing no toxicity at 40 nM. Finally, oligomycin had an IC50 at ~750 pM with syrosingopine while showing no toxicity up to 16 nM in the absence of syrosingopine. Similar titrations for 6.5 cells are shown in fig. S6A.
Fig. 4. Syrosingopine strongly potentiates the effect of mitochondrial inhibitors.
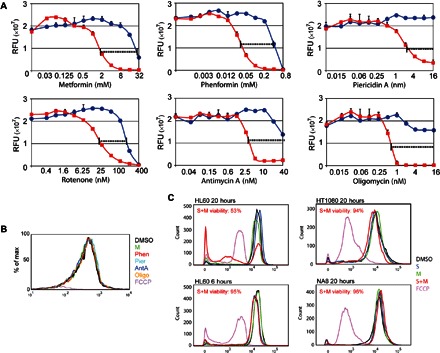
(A) HL60 cells treated with increasing amounts of various mitochondrial inhibitors in the absence (blue lines) or presence of 5 μM syrosingopine (red lines). (B) Determination of mitochondrial membrane potential with TMRM staining. HL60 cells were treated for 20 hours with the following compounds: 5 mM metformin, 100 μM phenformin (Phen), 8 nM piericidin A (Pier), 5 nM antimycin A (AntA), 1 nM oligomycin (Oligo), 10 μM FCCP (positive control), and 5 μM syrosingopine. (C) Mitochondrial membrane potential of cells treated with the indicated drugs for the indicated length of time measured by TMRM staining. Viability of syrosingopine-metformin–treated cells was measured by trypan blue staining, followed by automated cell counting.
The low concentrations at which the abovementioned mitochondrial inhibitors elicit synthetic lethality would be expected to have only a slight impact on mitochondrial function. To confirm this, HL60 cells were treated with the mitochondrial inhibitors at the concentrations used for synergistic killing with syrosingopine, and the mitochondrial membrane potential was measured using the potentiometric dye TMRM (tetramethylrhodamine methyl ester). After 20 hours of treatment, there was no change in membrane potential compared to the untreated control (Fig. 4B), whereas cells treated with the proton ionophore FCCP as a positive control were fully depolarized.
Syrosingopine alone had no effect on the membrane potential in HL60 cells except in combination with metformin, when it resulted in a collapse in the membrane potential after 20 hours of treatment (Fig. 4C). Syrosingopine-metformin treatment for a shorter period (6 hours) in HL60 did not generate a drop in the membrane potential. In nonresponsive HT1080 and NA8 cells, treatment with the syrosingopine-metformin combination had no effect on the membrane potential. Depolarization is correlated with low cell viability, as measured by trypan blue staining (Fig. 4C). Although this may suggest that depolarization is involved in eliciting cell death, it could also be the case that the depolarized cells detected are those already undergoing cell death as a consequence of the combined drug treatment.
It remains possible that syrosingopine is acting by preventing the maintenance of mitochondrial membrane potential. In the presence of respiratory chain inhibition, the function of the F1Fo-ATP synthase is reversed, and it uses cytosolic ATP generated by glycolysis to pump protons across the mitochondrial inner membrane to maintain the membrane potential (31, 32). Thus, any inhibitory effect by syrosingopine on the reverse F1Fo-ATP synthase activity would be sufficient to elicit synthetic lethality in the presence of respiratory chain inhibition. To test this possibility, we permeabilized HL60ρ0 cells to allow uptake of exogenous ATP and measured the effect of syrosingopine on the membrane potential. We observe membrane polarization in the HL60ρ0 cells that is increased when exogenous ATP is added (fig. S6B). This membrane potential is oligomycin-insensitive but azide-sensitive, as has been reported by Appleby et al. (32). However, the membrane is not depolarized by syrosingopine, leading us to discount syrosingopine-dependent inhibition of F1FO-adenosine triphosphatase activity as a potential mechanism for its mode of action.
To summarize, neither syrosingopine nor the mitochondrial inhibitors, when applied singly at the low concentrations used to elicit synthetic lethality, have a detectable effect on mitochondrial function as measured by the membrane potential. Nevertheless, this weak ETC inhibition is potentiated by syrosingopine to generate strong synergistic killing, giving hope that this may be clinically effective in combination with low plasma biguanide concentrations.
Syrosingopine-induced synthetic lethality is unrelated to its antihypertensive properties
Syrosingopine is derived from the potent antihypertensive drug reserpine (fig. S1B). Both drugs inhibit the vesicular monoamine transporters (VMAT1 and VMAT2) to prevent sequestration of monoamines into their storage granule, thus depleting catecholamine stores (33, 34). Syrosingopine is less potent than reserpine, with consequently weaker antihypertensive activity (35, 36). To test whether syrosingopine elicits synthetic lethality via VMAT inhibition, we tested the combination of reserpine with metformin. Despite being a stronger VMAT inhibitor, reserpine only weakly synergized with metformin and was less potent than syrosingopine in inducing synthetic lethality (Fig. 5A). The ρ0 cells were also less sensitive to reserpine in comparison to syrosingopine (Fig. 5B).
Fig. 5. Syrosingopine-elicited synthetic lethality is unrelated to VMAT inhibition.

(A) 6.5 and HL60 cells treated with syrosingopine (S), syrosingopine in the presence of 4 mM metformin (S+M), reserpine (R), and reserpine in the presence of 4 mM metformin (R+M). (B) 6.5ρ0 and HL60ρ0 cells treated with syrosingopine (S) and reserpine (R). (C) 6.5 and HL60 cells treated with tetrabenazine (T), tetrabenazine in the presence of 4 mM metformin (T+M), and ρ0 cells with tetrabenazine alone (gray lines). Growth was measured after 3 days of treatment.
To confirm that synthetic lethality with metformin is not due to VMAT inhibition, we performed a cotitration of metformin with tetrabenazine, a potent VMAT inhibitor structurally unrelated to the reserpine-like compounds (fig. S1C), which binds to VMAT at a distinct site (37). Tetrabenazine had no synthetic lethality with metformin in 6.5 and HL60 cells nor any greater toxicity in the ρ0 cells compared to the respective parental cells (Fig. 5C). Collectively, these data suggest that synthetic lethality with metformin by syrosingopine is unrelated to VMAT inhibition.
Syrosingopine binds the glycolytic enzyme α-enolase
We used DARTS (drug affinity responsive target stability) to identify the binding partners of syrosingopine (38). We observed a prominent band that was protected from proteolytic digestion in the presence of syrosingopine (Fig. 6A). This band was excised and identified by mass spectrometry as the glycolytic enzyme α-enolase (Fig. 6B). Binding of syrosingopine to α-enolase was confirmed in vitro by microscale thermophoresis (39) with an observed Kd of 1.25 × 10⁻⁶ M (Fig. 6C).
Fig. 6. Syrosingopine binds the glycolytic enzyme α-enolase.
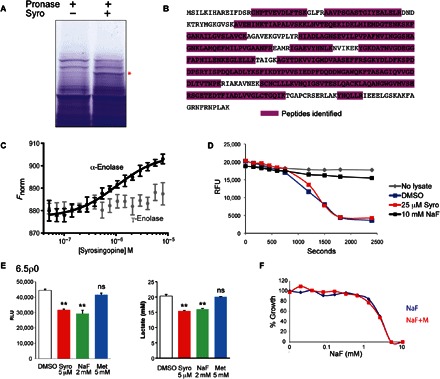
(A) Coomassie-stained SDS–polyacrylamide gel electrophoresis (SDS-PAGE) gels of HL60 cell lysate after a DARTS assay (±50 μM syrosingopine). Band marked with asterisk was excised, and proteins were eluted for mass spectrometry. (B) α-Enolase peptides from the excised band were identified by mass spectrometry. (C) Thermophoretic profile of binding interaction between syrosingopine and recombinant α-enolase (black curve) and γ-enolase (gray curve). (D) Enolase activity assay performed at room temperature for HL60 lysates treated as indicated. (E) Measurement in 6.5ρ0 cells of ATP levels and extracellular lactate after treatment with selected drugs for 7 hours. **P = 0.99. ns, not significant. RLU, relative luminescence units. (F) Proliferation assay of HL60 cells titrated with NaF in the presence or absence of 4 mM metformin for 3 days.
α-Enolase catalyzes the conversion of 2-phosphoglycerate to phosphoenolpyruvate in glycolysis. Enolase activity was measured in HL60 lysates by an in vitro activity assay. However, we could not detect any inhibition of enolase activity by syrosingopine, although it was inhibited by the known enolase inhibitor NaF (Fig. 6D). These assays were repeated under varying conditions (preincubation with syrosingopine and length and temperature of incubation), but no inhibitory effect of syrosingopine on α-enolase activity was observed.
The effect of syrosingopine on glycolysis at the cellular level was monitored using 6.5ρ0 cells. Most cells are metabolically flexible and can switch between glycolysis and mitochondrial oxidative phosphorylation for ATP production, should either one of the pathways be inhibited. Because 6.5ρ0 cells rely exclusively on glycolysis for ATP generation, they provide a simplified system for unambiguous measurement of glycolytic output. As expected, metformin had no effect on glycolytic output in this background (Fig. 6E). Treatment with syrosingopine reduced both ATP and lactate production to levels comparable to those seen with NaF (Fig. 6E). Thus, despite the lack of enolase inhibition seen in the in vitro assay (Fig. 6D), syrosingopine appears to have some impact on glycolysis at the cellular level. To see whether enolase inhibition elicits synthetic lethality with metformin, a NaF-metformin titration was performed (Fig. 6F and fig. S7A). NaF was toxic between 2 and 10 mM, which was not increased by the addition of metformin. The absence of synergy between NaF and metformin suggests that the strong synthetic lethality of syrosingopine in combination with metformin is due to more than just the simultaneous inhibition of glycolytic and mitochondrial ATP-generating pathways.
γ-Enolase is a marker for resistance to syrosingopine-metformin treatment
There are three enolase isozymes in humans: α-enolase (encoded by Eno1; ubiquitously expressed), γ-enolase (Eno2; mainly in the brain), and β-enolase (Eno3; muscle-specific isoform). γ-Enolase overexpression has been observed in cancer and is a tumor marker in non–small cell lung cancer (40, 41) and neuroendocrine tumors (42). We probed a panel of syrosingopine-metformin–responsive and syrosingopine-metformin–nonresponsive cell lines to determine their α-enolase and γ-enolase levels. α-Enolase was expressed in all cell lines, as expected (Fig. 7A). Markedly, most of the nonresponsive or poorly responding cell lines express γ-enolase (syrosingopine-metformin responsiveness shown in fig. S7B). As described above, we could detect binding between syrosingopine and recombinant α-enolase (Fig. 6C). Notably, syrosingopine does not bind recombinant γ-enolase under the same conditions.
Fig. 7. γ-Enolase correlates with syrosingopine-metformin insensitivity.
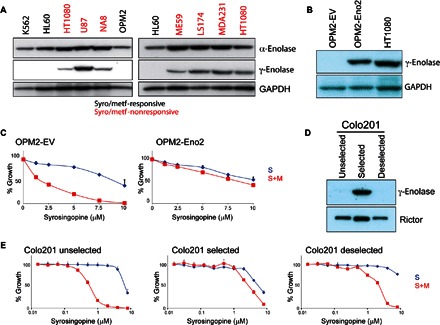
(A) Cell panel of syrosingopine-metformin–responsive and syrosingopine-metformin–nonresponsive cell lines immunoblotted for α-enolase (Eno1) and γ-enolase (Eno2). (B) Immunoblot for γ-enolase expression in OPM2 cells transfected with an Eno2 ORF (open reading frame)–bearing virus. (C) Proliferation assay of OPM2–EV (empty vector) and OPM2-Eno2 cells treated with syrosingopine-metformin for 3 days. (D) Immunoblot for γ-enolase in Colo201 cells undergoing selection with syrosingopine-metformin and with selection removed. (E) Proliferation assay of Colo201 cells titrated with syrosingopine in the presence or absence of 4 mM metformin for 4 days.
Eno2 overexpression in the responsive cell line OPM2 (Fig. 7B) conferred resistance to syrosingopine-metformin treatment (Fig. 7C). Independently, we selected for resistance to the drug combination by passaging human colorectal carcinoma Colo201 cells at a sublethal concentration (1 μM syrosingopine and 4 mM metformin). Selecting for resistant cells enriched for Eno2-expression that are resistant to syrosingopine-metformin treatment (Fig. 7E). The resistant cells had a lower proliferation rate, and removal of selection pressure resulted in loss of high Eno2 expression in the cell pool (Fig. 7D), possibly because of overgrowth by Eno2-nonexpressing cells. This pool of “deselected” cells reverts to syrosingopine-metformin sensitivity (Fig. 7E).
Eno2 was deleted in resistant HT1080 and NA8 cell lines by clustered regularly interspaced short palindromic repeats (CRISPR) using two independent constructs (fig. S8A). However, loss of γ-enolase expression did not sensitize cells to syrosingopine-metformin treatment (fig. S8B). Thus, whereas ectopic Eno2 expression in a previously sensitive background confers resistance to the drug combination, the reverse does not hold, and loss of Eno2 does not render cells insensitive to syrosingopine-metformin treatment.
DISCUSSION
We describe a potent interaction between syrosingopine, an antihypertensive drug, and mitochondrial ETC inhibitors. These two classes of drugs, when combined, elicit a synthetic lethal reaction in most of the cancer cell lines tested, which was specific to transformed cells.
Metformin and phenformin have attracted considerable interest as potential anticancer agents. Although many mitochondrial inhibitors, such as sodium azide, rotenone, and KCN, are notoriously toxic, the mild ETC inhibition afforded by the biguanides allows for their safe usage and generally clean clinical record. This has led to calls for reassessment of the risk-benefit ratio of phenformin for its introduction in anticancer therapy (29, 43). However, the effective concentrations of metformin and phenformin required for anticancer activity in in vitro settings are higher than those attained with typical antidiabetic dosage in vivo. The in vivo efficacy of these low doses for cancer treatment has thus been a matter of debate (19, 44, 45). As noted in the study by Chandel et al. (45), metformin plasma concentration in murine models, given doses comparable to human antidiabetic prescription, overlaps with the concentration sufficient to inhibit oxidative phosphorylation; nevertheless, other factors, such as pharmacokinetics and tumor-related factors, may come into play to influence clinical anticancer efficacy. Sensitizing compounds that lower the therapeutic threshold of the biguanides may help pave the way for their use in anticancer therapy.
Syrosingopine elicits cell death with all ETC inhibitors tested at concentrations orders of magnitude below their cytotoxic threshold. Syrosingopine is thus able to leverage weak ETC inhibition that is practically undetectable (Fig. 3, B and C) into potent cell killing. Oligomycin in particular has an in vitro IC50 of 750 pM with syrosingopine and is nontoxic up to 16 nM in its absence. The low in vitro IC50 values of these nonbiguanide ETC inhibitors suggest that they may be pharmacological alternatives to metformin or phenformin, as well as potential alternatives should biguanide resistance develop in the course of therapy.
The mechanism by which syrosingopine elicits synthetic lethality with metformin remains unknown, although we have established that it is distinct from VMAT inhibition (Fig. 4). The observation that syrosingopine binds α-enolase could provide a clue to the underlying mechanism. Cancer cells are more vulnerable to mitochondrial inhibition when combined with glucose limitation (46) or glycolytic inhibition (47, 48). Syrosingopine-dependent inhibition of enolase activity, and thus glycolysis, is a plausible mechanism for synthetic lethality with concurrent mitochondrial inhibition. However, we do not see any evidence for inhibition of enolase activity by syrosingopine in vitro. It is possible that syrosingopine is a prodrug that requires internalization and metabolization into an active form, thus explaining the lack of activity seen in in vitro assays. We do observe an effect by syrosingopine on glycolysis in intact ρ0 cells, suggesting that this may indeed play some part in the synthetic lethal interaction.
γ-Enolase expression correlates with nonresponsiveness to syrosingopine-metformin, and ectopic γ-enolase expression confers resistance to syrosingopine-metformin treatment. Glioblastomas that are homozygously deleted for ENO1 are viable due to ENO2 expression; however, these cells are more vulnerable to enolase inhibition because of the decrease in total enolase activity (49). Thus, expression of both enolase isoforms is associated with greater resistance to enolase inhibition. The fact that syrosingopine only binds to α- and not to γ-enolase, and presumably impairs its function, lends support to this view. However, it should be noted that knockout of γ-enolase is not sufficient to sensitize resistant cell lines to the drug treatment (fig. S8B).
α-Enolase and γ-enolase have various moonlighting functions unrelated to glycolysis and for which their enzymatic activity is dispensable (41, 50, 51). Some of these functions are significant in the context of cancer. A truncated Eno1 isoform, myc promoter-binding protein 1, transcriptionally regulates the c-myc oncogene (52). Cell surface–bound α-enolase is a plasminogen receptor and is associated with greater invasiveness and metastasis (50, 53, 54). γ-Enolase has also been reported at the plasma membrane (55) but lacks the C-terminal lysine present in α-enolase that serves as a plasminogen receptor. Instead, its C-terminal sequence forms a PDZ-binding motif for protein-protein interaction (41). The γ-enolase C-terminal sequence promotes cell survival by activation of phosphatidylinositol 3-kinase/Akt and mitogen-activated protein kinase/extracellular signal–regulated kinase signaling (56, 57) and inhibition of apoptosis (58). γ-Enolase is required for the import of lysine tRNA acceptor 1 into the mitochondria (59), a moonlighting activity that is conserved from yeast to humans. It remains possible that impairment of one of these moonlighting functions is involved in synthetic lethality.
Two recent publications have shown that inhibition of cytosolic aspartate synthesis is synthetic lethal with ETC inhibition (50, 60), raising the possibility that syrosingopine may be an inhibitor of GOT1 (glutamic-oxaloacetic transaminase 1), the cytosolic enzyme that synthesizes aspartate when the ETC is inhibited. However, this does not appear to be the case because aspartate supplementation was unable to rescue cells from syrosingopine-metformin killing.
Syrosingopine and metformin are approved drugs with well-established clinical records outside cancer therapy. The interaction between these drugs in in vitro and animal models holds out the promise that, when appropriately combined, they may find application in the treatment of cancer.
MATERIALS AND METHODS
Cell culture
Cells were grown in Iscove’s medium supplemented with 10% fetal bovine serum, 2 mM l-glutamine, penicillin (100 U/ml), and streptomycin (100μg/ml) at 37°C and 5% CO2. The 6.5 murine mast cell medium was supplemented with murine interleukin-3 from conditioned medium (20). Mitochondrial genome null ρ0 cells were generated by the addition of ethidium bromide (0.2 μg/ml), uridine (50 μg/ml), and mIL3 (for 6.5ρ0), and outgrowing ρ0 cells were obtained after four to five passages. Primary leukemic blasts were obtained from patients undergoing blast crisis (14 AML and 1 CML patients), with the approval of the ethics committee of Basel, Switzerland, and informed consent in accordance with the Declaration of Helsinki. 3D cultures of Huh7 and HepG2 hepatospheres were performed by seeding 2 × 10⁵ and 1 × 10⁵ cells, respectively, in 1.5 ml of medium (Dulbecco’s modified Eagle’s medium/F12 + GlutaMAX, supplemented with B27, insulin, and epidermal growth factor) in six-well plates (Ultra-Low Attachment surface plates, Costar). Sphere formation was assessed microscopically, and drugs were added 24 hours after seeding, when spheres could already be observed. Medium was changed every 2 days, and fresh compounds were added. Hepatosphere viability was quantified by adding 50 μM resazurin to the medium and measuring the fluorescence. Normal peripheral blood cells were obtained from surplus units at the local blood bank (Blutspendezentrum, University Hospital Basel). Blood cells and leukemic blasts were plated in 96-well plates at 20,000 cells/150 μl of medium and processed in a similar manner to established cell lines.
Cell proliferation assays
Cells were plated in 96-well microtiter plates at a density of 3000 cells/150 μl of medium (suspension cells) or 2000 cells/150 μl of medium (adherent cells), and growth was measured after 3 days (suspension cultures), or 5 days (adherent cell lines) by the addition of 0.1 vol resazurin (final concentration of 50 μM). Fluorescence was read at 535/595 nm (excitation/emission) with a plate reader. Growth was normalized to untreated controls, and each data point was performed in triplicate.
Metformin synthetic lethal drug screen
The 6.5 cells were plated at a density of 3000 cells/150 μl of Iscove’s medium in 96-well plates. Replica plates were set up in parallel, containing 4 mM metformin. The plates were challenged with 1120 drugs (Prestwick Chemical Library) at 2 and 10 μM. A cell proliferation assay was performed after a 3-day incubation with 50 μM resazurin, and growth was normalized to untreated controls. Cytotoxic compounds killed or strongly reduced the proliferation, regardless of whether metformin was present. Metformin-interacting drugs were lethal only in the presence of 4 mM metformin. A cutoff point of >80% growth (normalized to DMSO controls) in the absence of metformin and <10% growth in the presence of 4 mM metformin was set.
FACS analysis
Apoptosis assay
The cells were stained with annexin V (Invitrogen) according to the manufacturer’s protocol, and apoptotic cells were detected by FACS analysis. The cells were also counterstained with propidium iodide (5 μg/ml) as a vital stain, and the proportion of living cells was simultaneously detected in a separate FACS channel.
Mitochondrial membrane potential determination
The potentiometric dye TMRM (100 nM; ImmunoChemistry Technologies) was added to the cells 30 min before FACS analysis, and the cells were directly subjected to FACS. For measurement of the membrane potential in HL60ρ0, the cells were treated with drugs for 30 min in full medium and then spun down and resuspended in mitochondrial assay buffer [250 mM sucrose, 1 mM EGTA, and 10 mM tris (pH 7.4)] containing the respective drugs. Where required, cells were permeabilized with the freshly prepared saponin (120 μg/ml). TMRM was then added for 30 min before proceeding with FACS analysis. FACS data were analyzed using FlowJo software (version 9.6.2).
Immunoblotting
Cells were lysed in RIPA (radioimmunoprecipitation assay) buffer and total protein (20 to 40 μg) loaded on SDS-PAGE gels. Proteins were blotted onto nitrocellulose membranes and probed with commercially available antibodies against α-enolase, γ-enolase (Cell Signaling), and MT-Co1 (Abcam).
Mouse experiments
All animal experiments were performed in accordance with the federal guidelines for animal experimentation and were approved by the Kantonales Veterinäramt of Kanton Basel-Stadt. Liver-specific Pten−/Tsc1− double-knockout mice display tumor development from 10 weeks of age. Treatment was initiated from 15 weeks. Mice were injected intraperitoneally every 2 days with syrosingopine (7.5 mg/kg body weight), metformin (200 mg/kg body weight), or in combination. For the double-treated animals, metformin was injected approximately an hour before the second injection with syrosingopine. After six treatments, mice were sacrificed at roughly 17 weeks of age.
DARTS assay
DARTS assay was performed according to Lomenick et al. (61) with modifications. HL60 cell lysate prepared using DARTS buffer was preabsorbed with 50 μM syrosingopine for 30 min on ice before being subjected to pronase digestion (0, 0.02, 0.05, 0.1, and 0.2 μg/μl) for 30 min at room temperature. Half of the digested lysate was loaded on an SDS-PAGE gel, and bands were visualized with Coomassie staining. Excised bands were taken for mass spectrometric digestion of proteins present.
Microscale thermophoresis
Recombinant α-enolase and γ-enolase (Acris Antibodies) were labeled with Monolith NT Blue dye. The amount of labeled protein to use was empirically determined. Labeled protein was added to syrosingopine (16-step twofold dilution starting from 8 μM in individual tubes) and incubated on ice for 30 min. Each individual dilution was loaded on glass capillaries, and thermophoresis was measured on Monolith NT.115 (NanoTemper Technologies).
Enolase activity assay
Enolase activity assay was conducted according to Muller et al. (62). The reaction volume was scaled down to 100 μl and conducted in 96-well microtiter plates. Cell lysate (0.5 μg) was used, and the change in fluorescence due to the oxidation of NADH (reduced form of nicotinamide adenine dinucleotide) was read using a plate reader at 360/460 nm (excitation/emission). This basic experimental protocol was used with varying conditions: drug pretreatment of cells or incubation at room temperature or on ice. Enolase activity measurements were confirmed using a commercially available kit (Enolase Activity Colorimetric/Fluorometric Assay Kit, BioVision).
Metabolic measurements
ATP levels were measured using CellTiter-Glo reagent. Secreted lactic acid was measured directly in cell culture medium using an ARKRAY Lactate Pro 2 lactate test meter with corresponding test strips.
Eno2 knockout and overexpression
Eno2 was deleted using double-nickase CRISPR plasmids directed against human Eno2 from Santa Cruz (h and h2). Recipient cells were transfected using Lipofectamine 3000, and transfectants were selected with puromycin. OPM2 cells were infected with control lentiviruses (abmGood, catalog no. LVP587) and lentiviruses bearing untagged human Eno2 ORF (abmGood, catalog no. LVP148539) to overexpress Eno2. Eno2 expression was variable, and single-cell cloning and screening were used to identify high Eno2-expressing cells.
Supplementary Material
Acknowledgments
We thank F. Wenzel for normal human fibroblasts, A. Tichelli for clinical material, and A. Thiemeyer and the FACS Core Facility of the Biozentrum for technical assistance. Funding: This work was supported by the Commission for Technology and Innovation, the Swiss Cancer League (Basel), and the Swiss National Science Foundation. Author contributions: D.B., C.M., H.A.L., and M.N.H. performed the experiments and guided the direction of the study and the writing and critical review of the manuscript. M.C., C.B., and M.L. performed critical experiments. S.K.H. performed mouse experiments. S.M. performed mass spectrometry. T.S. performed microscale thermophoresis. L.Q. and L.T. performed pathological analysis. A.W.-F. and M.Y.M.E.-S. provided clinical material and reagents. Competing interests: Work presented in this publication has been filed under patent WO2012/095379 A1. Data and materials availability: All data needed to evaluate the conclusions in the paper are present in the paper and/or the Supplementary Materials. Additional data related to this paper may be requested from the authors.
SUPPLEMENTARY MATERIALS
Supplementary material for this article is available at http://advances.sciencemag.org/cgi/content/full/2/12/e1601756/DC1
fig. S1. Optimization of metformin concentration for codrug screen.
fig. S2. Effect of metformin on cell survival in leukemic blasts.
fig. S3. Syrosingopine-metformin titration in leukemic blasts.
fig. S4. Effect of drug combination on 2D and 3D culture conditions.
fig. S5. Effect of syrosingopine with phenformin and other mitochondrial inhibitors.
fig. S6. Syrosingopine strongly potentiates the effect of mitochondrial inhibitors.
fig. S7. Syrosingopine-metformin titrations of Eno2-expressing and Eno2-nonexpressing cells.
fig. S8. Eno2 knockout does not confer sensitivity to drug combination.
table S1. Panel of cancer cell lines tested for syrosingopine-metformin–induced synthetic lethality.
REFERENCES AND NOTES
- 1.Evans J. M. M., Donnelly L. A., Emslie-Smith A. M., Alessi D. R., Morris A. D., Metformin and reduced risk of cancer in diabetic patients. BMJ 330, 1304–1305 (2005). [DOI] [PMC free article] [PubMed] [Google Scholar]
- 2.Libby G., Donnelly L. A., Donnan P. T., Alessi D. R., Morris A. D., Evans J. M. M., New users of metformin are at low risk of incident cancer: A cohort study among people with type 2 diabetes. Diabetes Care 32, 1620–1625 (2009). [DOI] [PMC free article] [PubMed] [Google Scholar]
- 3.Jiralerspong S., Palla S. L., Giordano S. H., Meric-Bernstam F., Liedtke C., Barnett C. M., Hsu L., Hung M.-C., Hortobagyi G. N., Gonzalez-Angulo A. M., Metformin and pathologic complete responses to neoadjuvant chemotherapy in diabetic patients with breast cancer. J. Clin. Oncol. 27, 3297–3302 (2009). [DOI] [PMC free article] [PubMed] [Google Scholar]
- 4.Decensi A., Puntoni M., Goodwin P., Cazzaniga M., Gennari A., Bonanni B., Gandini S., Metformin and cancer risk in diabetic patients: A systematic review and meta-analysis. Cancer Prev. Res. 3, 1451–1461 (2010). [DOI] [PubMed] [Google Scholar]
- 5.Noto H., Goto A., Tsujimoto T., Noda M., Cancer risk in diabetic patients treated with metformin: A systematic review and meta-analysis. PLOS ONE 7, e33411 (2012). [DOI] [PMC free article] [PubMed] [Google Scholar]
- 6.Niraula S., Dowling R. J. O., Ennis M., Chang M. C., Done S. J., Hood N., Escallon J., Leong W. L., McCready D. R., Reedijk M., Stambolic V., Goodwin P. J., Metformin in early breast cancer: A prospective window of opportunity neoadjuvant study. Breast Cancer Res. Treat. 135, 821–830 (2012). [DOI] [PubMed] [Google Scholar]
- 7.Schuler K. M., Rambally B. S., DiFurio M. J., Sampey B. P., Gehrig P. A., Makowski L., Bae-Jump V. L., Antiproliferative and metabolic effects of metformin in a preoperative window clinical trial for endometrial cancer. Cancer Med. 4, 161–173 (2015). [DOI] [PMC free article] [PubMed] [Google Scholar]
- 8.Zakikhani M., Dowling R., Fantus I. G., Sonenberg N., Pollak M., Metformin is an AMP kinase–dependent growth inhibitor for breast cancer cells. Cancer Res. 66, 10269–10273 (2006). [DOI] [PubMed] [Google Scholar]
- 9.Anisimov V. N., Egormin P. A., Bershtein L. M., Zabezhinskii M. A., Piskunova T. S., Popovich I. G., Semenchenko A. V., Metformin decelerates aging and development of mammary tumors in HER-2/neu transgenic mice. Bull. Exp. Biol. Med. 139, 721–723 (2005). [DOI] [PubMed] [Google Scholar]
- 10.Dowling R. J. O., Goodwin P. J., Stambolic V., Understanding the benefit of metformin use in cancer treatment. BMC Med. 9, 33 (2011). [DOI] [PMC free article] [PubMed] [Google Scholar]
- 11.Pollak M. N., Investigating metformin for cancer prevention and treatment: The end of the beginning. Cancer Discovery 2, 778–790 (2012). [DOI] [PubMed] [Google Scholar]
- 12.Chae Y. K., Arya A., Malecek M.-K., Shin D. S., Carneiro B., Chandra S., Kaplan J., Kalyan A., Altman J. K., Platanias L., Giles F., Repurposing metformin for cancer treatment: Current clinical studies. Oncotarget 7, 40767–40780 (2016). [DOI] [PMC free article] [PubMed] [Google Scholar]
- 13.Stevens R. J., Ali R., Bankhead C. R., Bethel M. A., Cairns B. J., Camisasca R. P., Crowe F. L., Farmer A. J., Harrison S., Hirst J. A., Home P., Kahn S. E., McLellan J. H., Perera R., Plüddemann A., Ramachandran A., Roberts N. W., Rose P. W., Schweizer A., Viberti G., Holman R. R., Cancer outcomes and all-cause mortality in adults allocated to metformin: Systematic review and collaborative meta-analysis of randomised clinical trials. Diabetologia 55, 2593–2603 (2012). [DOI] [PubMed] [Google Scholar]
- 14.Nayan M., Finelli A., Jewett M. A. S., Juurlink D. N., Austin P. C., Kulkarni G. S., Hamilton R. J., Metformin use and kidney cancer outcomes in patients with diabetes: A propensity score analysis. Clin. Genitourin. Cancer, S1558-7673(16)30159-8 (2016). [DOI] [PubMed] [Google Scholar]
- 15.Wu H., Walker J., Damhuis R. A., Brewster D. H., Wild S. H. Scottish Diabetes Research Network Epidemiology Group , Metformin and survival of people with type 2 diabetes and pleural mesothelioma: A population-based retrospective cohort study. Lung Cancer 99, 194–199 (2016). [DOI] [PubMed] [Google Scholar]
- 16.Kordes S., Pollak M. N., Zwinderman A. H., Mathôt R. A., Weterman M. J., Beeker A., Punt C. J., Richel D. J., Wilmink J. W., Metformin in patients with advanced pancreatic cancer: A double-blind, randomised, placebo-controlled phase 2 trial. Lancet Oncol. 16, 839–847 (2015). [DOI] [PubMed] [Google Scholar]
- 17.Home P. D., Kahn S. E., Jones N. P., Noronha D., Beck-Nielsen H., Viberti G. ADOPT Study Group; RECORD Steering Committee , Experience of malignancies with oral glucose-lowering drugs in the randomised controlled ADOPT (A Diabetes Outcome Progression Trial) and RECORD (Rosiglitazone Evaluated for Cardiovascular Outcomes and Regulation of Glycaemia in Diabetes) clinical trials. Diabetologia 53, 1838–1845 (2010). [DOI] [PMC free article] [PubMed] [Google Scholar]
- 18.Tsilidis K. K., Capothanassi D., Allen N. E., Rizos E. C., Lopez D. S., van Veldhoven K., Sacerdote C., Ashby D., Vineis P., Tzoulaki I., Ioannidis J. P. A., Metformin does not affect cancer risk: A cohort study in the U.K. Clinical Practice Research Datalink analyzed like an intention-to-treat trial. Diabetes Care 37, 2522–2532 (2014). [DOI] [PubMed] [Google Scholar]
- 19.Chong C. R., Chabner B. A., Mysterious metformin. Oncologist 14, 1178–1181 (2009). [DOI] [PubMed] [Google Scholar]
- 20.Colombi M., Molle K. D., Benjamin D., Rattenbacher-Kiser K., Schaefer C., Betz C., Thiemeyer A., Regenass U., Hall M. N., Moroni C., Genome-wide shRNA screen reveals increased mitochondrial dependence upon mTORC2 addiction. Oncogene 30, 1551–1565 (2011). [DOI] [PubMed] [Google Scholar]
- 21.Bartels C. C., Syrosingopine—A new rauwolfia preparation. N. Engl. J. Med. 261, 785–788 (1959). [DOI] [PubMed] [Google Scholar]
- 22.Gustavsson A., Olofsson T., Prediction of response to chemotherapy in acute leukemia by in vitro drug sensitivity testing on leukemic stem cells. Cancer Res. 44, 4648–4652 (1984). [PubMed] [Google Scholar]
- 23.Janes M. R., Limon J. J., So L., Chen J., Lim R. J., Chavez M. A., Vu C., Lilly M. B., Mallya S., Ong S. T., Konopleva M., Martin M. B., Ren P., Liu Y., Rommel C., Fruman D. A., Effective and selective targeting of leukemia cells using a TORC1/2 kinase inhibitor. Nat. Med. 16, 205–213 (2010). [DOI] [PMC free article] [PubMed] [Google Scholar]
- 24.van Zijl F., Mikulits W., Hepatospheres: Three dimensional cell cultures resemble physiological conditions of the liver. World J. Hepatol. 2, 1–7 (2010). [DOI] [PMC free article] [PubMed] [Google Scholar]
- 25.El-Mir M.-Y., Nogueira V., Fontaine E., Avéret N., Rigoulet M., Leverve X., Dimethylbiguanide inhibits cell respiration via an indirect effect targeted on the respiratory chain complex I. J. Biol. Chem. 275, 223–228 (2000). [DOI] [PubMed] [Google Scholar]
- 26.Owen M. R., Doran E., Halestrap A. P., Evidence that metformin exerts its anti-diabetic effects through inhibition of complex 1 of the mitochondrial respiratory chain. Biochem. J. 348, 607–614 (2000). [PMC free article] [PubMed] [Google Scholar]
- 27.Bridges H. R., Jones A. J. Y., Pollak M. N., Hirst J., Effects of metformin and other biguanides on oxidative phosphorylation in mitochondria. Biochem. J. 462, 475–487 (2014). [DOI] [PMC free article] [PubMed] [Google Scholar]
- 28.Wheaton W. W., Weinberg S. E., Hamanaka R. B., Soberanes S., Sullivan L. B., Anso E., Glasauer A., Dufour E., Mutlu G. M., Budigner G. S., Chandel N. S., Metformin inhibits mitochondrial complex I of cancer cells to reduce tumorigenesis. eLife 3, e02242 (2014). [DOI] [PMC free article] [PubMed] [Google Scholar]
- 29.Shackelford D. B., Abt E., Gerken L., Vasquez D. S., Seki A., Leblanc M., Wei L., Fishbein M. C., Czernin J., Mischel P. S., Shaw R. J., LKB1 inactivation dictates therapeutic response of non-small cell lung cancer to the metabolism drug phenformin. Cancer Cell 23, 143–158 (2013). [DOI] [PMC free article] [PubMed] [Google Scholar]
- 30.King M. P., Attardi G., Human cells lacking mtDNA: Repopulation with exogenous mitochondria by complementation. Science 246, 500–503 (1989). [DOI] [PubMed] [Google Scholar]
- 31.Buchet K., Godinot C., Functional F1-ATPase essential in maintaining growth and membrane potential of human mitochondrial DNA-depleted ρ° cells. J. Biol. Chem. 273, 22983–22989 (1998). [DOI] [PubMed] [Google Scholar]
- 32.Appleby R. D., Porteous W. K., Hughes G., James A. M., Shannon D., Wei Y.-H., Murphy M. P., Quantitation and origin of the mitochondrial membrane potential in human cells lacking mitochondrial DNA. Eur. J. Biochem. 262, 108–116 (1999). [DOI] [PubMed] [Google Scholar]
- 33.Henry J. P., Botton D., Sagne C., Isambert M. F., Desnos C., Blanchard V., Raisman-Vozari R., Krejci E., Massoulie J., Gasnier B., Biochemistry and molecular biology of the vesicular monoamine transporter from chromaffin granules. J. Exp. Biol. 196, 251–262 (1994). [DOI] [PubMed] [Google Scholar]
- 34.Schuldiner S., Liu Y., Edwards R. H., Reserpine binding to a vesicular amine transporter expressed in Chinese hamster ovary fibroblasts. J. Biol. Chem. 268, 29–34 (1993). [PubMed] [Google Scholar]
- 35.Calesnick B., Reduced sedative effect of a newly synthesized reserpine derivative (syrosingopine): Clinical appraisal in primary hypertension. J. Am. Geriatr. Soc. 7, 648–655 (1959). [DOI] [PubMed] [Google Scholar]
- 36.Furukawa T., Sano T., Kohno Y., Koga M., Nagasaki N., Selective depleting effect of syrosingopine on brain catecholamine levels with relation to morphine analgesia in the rat. Pharmacol. Biochem. Behav. 4, 419–425 (1976). [DOI] [PubMed] [Google Scholar]
- 37.Darchen F., Scherman D., Henry J. P., Reserpine binding to chromaffin granules suggests the existence of two conformations of the monoamine transporter. Biochemistry 28, 1692–1697 (1989). [DOI] [PubMed] [Google Scholar]
- 38.Lomenick B., Hao R., Jonai N., Chin R. M., Aghajan M., Warburton S., Wang J., Wu R. P., Gomez F., Loo J. A., Wohlschlegel J. A., Vondriska T. M., Pelletier J., Herschman H. R., Clardy J., Clarke C. F., Huang J., Target identification using drug affinity responsive target stability (DARTS). Proc. Natl. Acad. Sci. U.S.A. 106, 21984–21989 (2009). [DOI] [PMC free article] [PubMed] [Google Scholar]
- 39.Seidel S. A. I., Dijkman P. M., Lea W. A., van den Bogaart G., Jerabek-Willemsen M., Lazic A., Joseph J. S., Srinivasan P., Baaske P., Simeonov A., Katritch I., Melo F. A., Ladbury J. E., Schreiber G., Watts A., Braun D., Duhr S., Microscale thermophoresis quantifies biomolecular interactions under previously challenging conditions. Methods 59, 301–315 (2013). [DOI] [PMC free article] [PubMed] [Google Scholar]
- 40.Isgrò M. A., Bottoni P., Scatena R., Neuron-specific as a biomarker: Biochemical and clinical aspects. Adv. Exp. Med. Biol. 867, 125–143 (2015). [DOI] [PubMed] [Google Scholar]
- 41.Vizin T., Kos J., Gamma-enolase: A well-known tumour marker, with a less-known role in cancer. Radiol. Oncol. 49, 217–226 (2015). [DOI] [PMC free article] [PubMed] [Google Scholar]
- 42.Tapia F. J., Barbosa A. J. A., Marangos P. J., Polak J. M., Bloom S. R., Dermody C., Pearse A. G. E., Neuron-specific enolase is produced by neuroendocrine tumours. Lancet 317, 808–811 (1981). [DOI] [PubMed] [Google Scholar]
- 43.Rosilio C., Ben-Sahra I., Bost F., Peyron J.-F., Metformin: A metabolic disruptor and anti-diabetic drug to target human leukemia. Cancer Lett. 346, 188–196 (2014). [DOI] [PubMed] [Google Scholar]
- 44.Dowling R. J. O., Lam S., Bassi C., Mouaaz S., Aman A., Kiyota T., Al-awar R., Goodwin P. J., Stambolic V., Metformin pharmacokinetics in mouse tumors: Implications for human therapy. Cell Metab. 23, 567–568 (2016). [DOI] [PubMed] [Google Scholar]
- 45.Chandel N. S., Avizonis D., Reczek C. R., Weinberg S. E., Menz S., Neuhaus R., Christian S., Haegebarth A., Algire C., Pollak M., Are metformin doses used in murine cancer models clinically relevant?. Cell Metab. 23, 569–570 (2016). [DOI] [PubMed] [Google Scholar]
- 46.Menendez J. A., Oliveras-Ferraros C., Cufí S., Corominas-Faja B., Joven J., Martin-Castillo B., Vazquez-Martin A., Metformin is synthetically lethal with glucose withdrawal in cancer cells. Cell Cycle 11, 2782–2792 (2012). [DOI] [PubMed] [Google Scholar]
- 47.Rosilio C., Lounnas N., Nebout M., Imbert V., Hagenbeek T., Spits H., Asnafi V., Pontier-Bres R., Reverso J., Michiels J.-F., Sahra I. B., Bost F., Peyron J.-F., The metabolic perturbators metformin, phenformin and AICAR interfere with the growth and survival of murine PTEN-deficient T cell lymphomas and human T-ALL/T-LL cancer cells. Cancer Lett. 336, 114–126 (2013). [DOI] [PubMed] [Google Scholar]
- 48.Cheng G., Zielonka J., Dranka B. P., McAllister D., Mackinnon A. C. Jr, Joseph J., Kalyanaraman B., Mitochondria-targeted drugs synergize with 2-deoxyglucose to trigger breast cancer cell death. Cancer Res. 72, 2634–2644 (2012). [DOI] [PMC free article] [PubMed] [Google Scholar]
- 49.Muller F. L., Colla S., Aquilanti E., Manzo V. E., Genovese G., Lee J., Eisenson D., Narurkar R., Deng P., Nezi L., Lee M. A., Hu B., Hu J., Sahin E., Ong D., Fletcher-Sananikone E., Ho D., Kwong L., Brennan C., Wang Y. A., Chin L., Depinho R. A., Passenger deletions generate therapeutic vulnerabilities in cancer. Nature 488, 337–342 (2012). [DOI] [PMC free article] [PubMed] [Google Scholar]
- 50.Díaz-Ramos A., Roig-Borrellas A., García-Melero A., López-Alemany R., α-Enolase, a multifunctional protein: Its role on pathophysiological situations. J. Biomed. Biotechnol. 2012, 156795 (2012). [DOI] [PMC free article] [PubMed] [Google Scholar]
- 51.Capello M., Ferri-Borgogno S., Cappello P., Novelli F., α-Enolase: A promising therapeutic and diagnostic tumor target. FEBS J. 278, 1064–1074 (2011). [DOI] [PubMed] [Google Scholar]
- 52.Subramanian A., Miller D. M., Structural analysis of α-enolase. Mapping the functional domains involved in down-regulation of the c-myc protooncogene. J. Biol. Chem. 275, 5958–5965 (2000). [DOI] [PubMed] [Google Scholar]
- 53.Miles L. A., Dahlberg C. M., Plescia J., Felez J., Kato K., Plow E. F., Role of cell-surface lysines in plasminogen binding to cells: Identification of alpha-enolase as a candidate plasminogen receptor. Biochemistry 30, 1682–1691 (1991). [DOI] [PubMed] [Google Scholar]
- 54.Hsiao K.-C., Shih N.-Y., Fang H.-L., Huang T.-S., Kuo C.-C., Chu P.-Y., Hung Y.-M., Chou S.-W., Yang Y.-Y., Chang G.-C., Liu K.-J., Surface α-enolase promotes extracellular matrix degradation and tumor metastasis and represents a new therapeutic target. PLOS ONE 8, e69354 (2013). [DOI] [PMC free article] [PubMed] [Google Scholar]
- 55.Hafner A., Obermajer N., Kos J., γ-1-Syntrophin mediates trafficking of γ-enolase towards the plasma membrane and enhances its neurotrophic activity. Neurosignals 18, 246–258 (2010). [DOI] [PubMed] [Google Scholar]
- 56.Hattori T., Ohsawa K., Mizuno Y., Kato K., Kohsaka S., Synthetic peptide corresponding to 30 amino acids of the C-terminal of neuron-specific enolase promotes survival of neocortical neurons in culture. Biochem. Biophys. Res. Commun. 202, 25–30 (1994). [DOI] [PubMed] [Google Scholar]
- 57.Hafner A., Obermajer N., Kos J., γ-Enolase C-terminal peptide promotes cell survival and neurite outgrowth by activation of the PI3K/Akt and MAPK/ERK signalling pathways. Biochem. J. 443, 439–450 (2012). [DOI] [PubMed] [Google Scholar]
- 58.Pišlar A. H., Kos J., C-terminal peptide of γ-enolase impairs amyloid-β-induced apoptosis through p75NTR signaling. Neuromolecular Med. 15, 623–635 (2013). [DOI] [PubMed] [Google Scholar]
- 59.Baleva M., Gowher A., Kamenski P., Tarassov I., Entelis N., Masquida B., A moonlighting human protein is involved in mitochondrial import of tRNA. Int. J. Mol. Sci. 16, 9354–9367 (2015). [DOI] [PMC free article] [PubMed] [Google Scholar]
- 60.Sullivan L. B., Gui D. Y., Hosios A. M., Bush L. N., Freinkman E., Vander Heiden M. G., Supporting aspartate biosynthesis is an essential function of respiration in proliferating cells. Cell 162, 552–563 (2015). [DOI] [PMC free article] [PubMed] [Google Scholar]
- 61.Lomenick B., Jung G., Wohlschlegel J. A., Huang J., Target identification using drug affinity responsive target stability (DARTS). Curr. Protoc. Chem. Biol. 3, 163–180 (2011). [DOI] [PMC free article] [PubMed] [Google Scholar]
- 62.Muller F., Aquilanti E., DePinho R., In vitro enzymatic activity assay for ENOLASE in mammalian cells in culture. Protoc. Exch. 10.1038/protex.2012.040 (2012). [DOI] [Google Scholar]
Associated Data
This section collects any data citations, data availability statements, or supplementary materials included in this article.
Supplementary Materials
Supplementary material for this article is available at http://advances.sciencemag.org/cgi/content/full/2/12/e1601756/DC1
fig. S1. Optimization of metformin concentration for codrug screen.
fig. S2. Effect of metformin on cell survival in leukemic blasts.
fig. S3. Syrosingopine-metformin titration in leukemic blasts.
fig. S4. Effect of drug combination on 2D and 3D culture conditions.
fig. S5. Effect of syrosingopine with phenformin and other mitochondrial inhibitors.
fig. S6. Syrosingopine strongly potentiates the effect of mitochondrial inhibitors.
fig. S7. Syrosingopine-metformin titrations of Eno2-expressing and Eno2-nonexpressing cells.
fig. S8. Eno2 knockout does not confer sensitivity to drug combination.
table S1. Panel of cancer cell lines tested for syrosingopine-metformin–induced synthetic lethality.