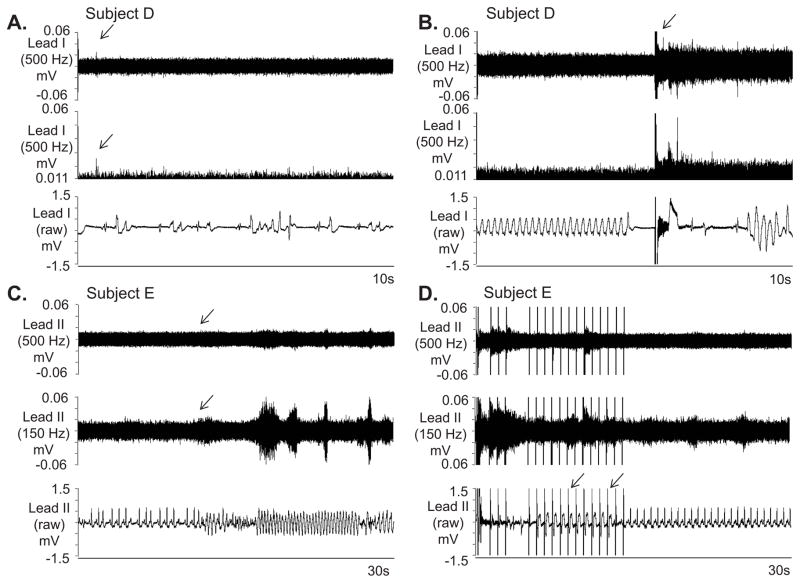
Abstract
Background
Sympathetic nerve activity is important to cardiac arrhythmogenesis.
Objectives
(1) To develop a method for simultaneous noninvasive recording of skin sympathetic nerve activity (SKNA) and electrocardiogram (ECG) using conventional ECG electrodes. (2) This method (neuECG) can be used to adequately estimate the sympathetic tone.
Methods
We recorded neuECG signals from the skin in 56 human subjects. The signals were low pass filtered to show the ECG and high pass filtered to show nerve activity. Protocol (P)-1 included 12 healthy volunteers who underwent cold water pressor test (CPT) and Valsalva maneuver. P-2 included 19 inpatients with epilepsy but without known heart diseases monitored for 24 hours. P-3 included 22 patients admitted with electrical storm and monitored for 39.0±28.2 hours. P-4 included 3 patients who underwent bilateral stellate ganglion blockade with lidocaine injection.
Results
In patients without heart diseases, spontaneous nerve discharges were frequently observed at baseline and were associated with heart rate acceleration. The SKNA recorded from chest leads (V1–V6) during CPT and Valsalva maneuver (P-1) was invariably higher than during baseline and recovery periods (p<0.001). In P-2, the average SKNA correlated with the heart rate acceleration (r=0.73±0.14, p<0.05) and shortening of the QT interval (p<0.001). Among 146 spontaneous ventricular tachycardia episodes recorded in 9 patients of P-3, 106 episodes (73%) were preceded by SKNA within 30 s of onset. P4 showed that bilateral stellate ganglia blockade by lidocaine inhibited SKNA.
Conclusions
SKNA is detectable using conventional ECG electrodes in humans and may be useful in estimating the sympathetic tone.
Keywords: cold water pressor test, microneurography, sympathetic nerve activity, ventricular tachycardia
The standard low pass filter setting of the surface ECG is 150 Hz for adolescents and adults, and 250 Hz for children.1 Higher frequency signals are assumed to be noise and eliminated. The skin is well innervated by sympathetic nerve fibers.2, 3 The skin nerves in the upper extremities and thorax originate in the cervical and stellate ganglia.4, 5 Therefore, it is reasonable to hypothesize that skin sympathetic nerve activity (SKNA) of the thorax or upper limbs can be used to estimate stellate ganglion nerve activity (SGNA). Consistent with the latter hypothesis, our recent canine studies showed that SKNA can be recorded from the thorax by filtering the electrogram with high pass filter setting of 150 Hz. Furthermore, we showed that the morphology and the magnitude SKNA correlated with SGNA and both nerve activities correlated with heart rate (HR) acceleration and preceded the onset of ventricular arrhythmias. These findings indicate that SKNA can be used to estimate SGNA in ambulatory dogs.6–8 Based on the results of those studies, we hypothesize that it is feasible to simultaneously record SKNA and ECG (neuECG) in humans, and that SKNA is useful in estimating the sympathetic tone. To test this hypothesis, we recorded neuECG from 4 different groups of patients. We first tested in a group of normal healthy volunteers if maneuvers known to increase sympathetic tone can increase SKNA. A second protocol was aimed to perform long term continuous neuECG recording from patients without known heart diseases. The data were used to determine if SKNA correlates with HR acceleration and QT interval shortening. A third protocol focused on inpatients with ventricular arrhythmias to demonstrate the association between SKNA and the onset of ventricular arrhythmias. The fourth protocol was used to further confirm the validity of SKNA in estimating SGNA by determining if stellate ganglion blockade can reduce or eliminate the SKNA. The data were analyzed to determine if SKNA can be used to non-invasively estimate sympathetic tone in humans.
Methods
All protocols were approved by the Institutional Review Boards of the Indiana University, Indianapolis, IN, Cedars-Sinai Medical Center, Los Angeles, CA or the Mayo Clinic, Rochester, MN. All 56 subjects gave written informed consent to participate. A detailed description of study methods, including statistical analyses and the technical details of the signal processing techniques used to detect the SKNA, are included in the Online Supplement. Recording conditions for each protocol were listed in Supplement Table 1.
Protocol 1: Provocative Maneuvers
We enrolled healthy volunteers for SKNA recording during the cold water pressor test (CPT) (N=9) and Valsalva maneuver (VM) (N=8).9 We used this protocol to test various ECG lead positions (Supplement Figure 1). The CPT was performed by placing subject’s left hand up to the wrist in iced water for 2 minutes.9 The subjects also performed the VM by blowing into the mouthpiece of a sphygmomanometer aiming to sustain 35 mmHg of pressure for 30 s.10 A two-minute control and recovery period were recorded for both maneuvers.
Protocol 2: Continuous Monitoring
Continuous, 24-hr neuECG recordings were done in 19 patients (12 female, age 36±11 years) with epilepsy but without known heart diseases. The electrode location is shown in Supplement Figure 1.
Protocol 3: Electrical Storm
We recorded neuECG from 22 patients (7 female, age 60.6±14) admitted to the hospital with electrical storm (ES), defined as three or more separate implantable cardioverter-defibrillator (ICD) therapies for ventricular tachycardia (VT) or ventricular fibrillation (VF) over a 24 hour period.11 We also enrolled patients if they had three or more separate episodes of sustained VT or VF over a 24 hour period either prior to ICD insertion or if these fell below the ICD detection limit and required external therapy. Electrode placement was identical to protocol 2.
Protocol-4: Ganglionic Blockade
We studied a 61 man and a 53 year old man with ischemic cardiomyopathy and a 71 year old man with arrhythmogenic right ventricular cardiomyopathy. They underwent bilateral stellate ganglion injection with 2% lidocaine (10 ml) while neuECG was being recorded.
Data Analysis
For quantitative analyses, we integrated all digitized SKNA signals over a time window and divided the total voltage by the number of digitized samples in the same window to obtain the average voltage of SKNA (aSKNA) per sample. For example, if we used a 10-s window and the sampling rate was 10,000 samples/s, then there were a total of 100,000 samples in that 10-s window. Assuming the total voltage of all samples in the same window was 200,000 μV, then the aSKNA was 2 μV. We also rectified and integrated the neurogram every 100-ms and displayed the results over time to simulate the display methods of microneurography.12 The integrated SKNA (iSKNA) was used only to display nerve activity in the figures. They were not used in statistical analyses. Only aSKNA was used in statistical analyses shown in Table 1. The methods of statistical analyses were included in the Online Supplement. Two-sided p values ≤0.05 were considered statistically significant.
Table 1.
Average voltage of skin sympathetic nerve activity in normal healthy volunteers
| Electrode location | CPT | VM | ||||||
|---|---|---|---|---|---|---|---|---|
| Baseline | CPT | Recovery | N | Baseline | VM | Recovery | N | |
| V1 | 0.77±0.07 | 1.2±0.29*,† | 0.79±0.02 | 9 | 1.25±0.20 | 3.66±0.82*,† | 1.21±0.19 | 8 |
| V2 | 0.85±0.08 | 1.21±0.16*,† | 0.86±0.07 | 9 | 1.00±0.17 | 3.91±0.74*,† | 0.95±0.17 | 8 |
| V3 | 1.07±0.38 | 1.24±0.28*,† | 1.15±0.52 | 9 | 1.04±0.17 | 3.56±0.81*,† | 0.96±0.20 | 8 |
| V4 | 0.78±0.01 | 1.04±0.05*,† | 0.84±0.10 | 9 | 0.85±0.06 | 4.01±1.00*,† | 0.85±0.06 | 8 |
| V5 | 1.00±0.40 | 1.44±0.59*,† | 1.13±0.26 | 9 | 1.01±0.15 | 4.28±0.99*,† | 1.04±0.14 | 8 |
| V6 | 0.77±0.04 | 1.37±0.33*,† | 0.84±0.07 | 6 | 0.79±0.15 | 4.69±0.92*,† | 0.78±0.17 | 6 |
| Unipolar wrist (C2) | 3.23±0.81 | 4.21±0.98 | 3.38±0.27 | 3 | 4.89±1.08 | 4.96±0.07 | 1.67±0.21 | 2 |
| Bipolar RA-LA (C1) | 1.50±0.20 | 4.68±0.10*,† | 2.07±0.25 | 4 | 2.06±0.66 | 4.59±0.74*,† | 2.62±1.14 | 4 |
| Bipolar Finger-finger (C2) | 1.27±0.01 | 1.28±0.01ǂ | 1.28±0.01 | 3 | 1.29±0.01 | 1.30±0.00 | 1.30±0.02 | 2 |
| Bipolar Arm-arm (C3) | 2.36±0.77 | 2.90±0.83 | 2.58±0.68 | 2 | 2.60±1.03 | 3.24±1.06*,† | 2.44±1.06 | 2 |
| Bioplar RA-LL (C1) | 0.95±0.02 | 1.56±0.08* | 1.18±0.09 | 4 | 1.48±0.67 | 4.58±1.23*,† | 1.74±0.95 | 4 |
| Bioplar RA-LL (C2) | 1.32±1.46 | 2.08±0.30*,† | 1.35±0.07 | 3 | 1.59±0.13 | 2.19±0.24 | 1.92±0.35 | 2 |
| Bioplar RA-LL (C3) | 1.72±0.13 | 2.41±0.12*,† | 2.04±0.15 | 2 | 0.93±0.65 | 3.13±2.25 | 1.00±0.72 | 2 |
All data expressed as average SKNA in μV± standard error. The filter setting was 500 Hz high pass.
N=number of patients studied in the lead configuration for the particular maneuver
C1–C3, configuration 1–3 as shown in Figure 1 of the online supplement
p<0.001 vs baseline,
p<0.001 vs recovery,
p<0.05 vs baseline.
Results
Protocol 1
During the CPT, the average mean arterial pressure increased from 87±7 to 105±8 and returned to 85±13 mmHg in recovery (p<0.001). Average HR increased from 66±5 to 78±17 and returned to 61±7 beats per minute (bpm) in recovery (p=0.023). During the VM, the average mean arterial pressure increased from 93±7 to 101±12 and returned to 88±8 mmHg in recovery (p=0.001). Average HR increased from 67±6 to 85±25 and returned to 65±5 bpm in recovery (p=0.025). In the two subjects in whom the impedance was recorded, the average impedance for each individual electrode was 37±8 kΩ (range: 28–52 kΩ). Table 1 shows that the average SKNA measured in leads tested in ≥ 4 subjects (leads V1–V6 and 2 bipolar leads) significantly increased during the CPT and VM, and then reduced significantly during recovery.
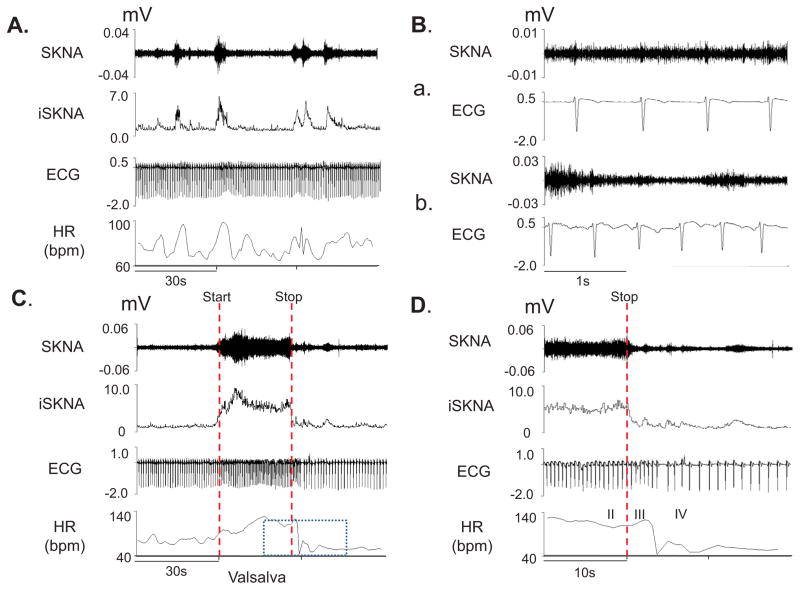
Figure 1 shows the tracing of a subject at baseline (Panels A and B) and during the VM (Panels C and D). Figure 1A shows that spontaneous bursts of nerve activity were associated with elevated heart rate. Figure 1B shows basal state nerve discharges. Figure 1C and 1D show effects of VM on SKNA.
Figure 1.
neuECG recordings from subject 12 of Protocol 1. Signals from Lead V1 were bandpass filtered between 500 Hz and 1000 Hz to detect SKNA and bandpass filtered between 0.5 Hz and 150 Hz to detect ECG. Integrated SKNA (iSKNA) was calculated over 100 ms window. A: Increased SKNA was associated with heart rate (HR) acceleration. B: Higher magnification of SKNA showing baseline spontaneous nerve activities (a) and large variations of nerve discharges associated with tachycardia (b). C: increased SKNA and HR were evident during Valsalva maneuver (VM); dotted red lines mark the start and the stop of the maneuver. D shows the magnified boxed segment from C, showing phases II–IV of the VM and demonstrating that the SKNA is not synchronous with the QRS complex.
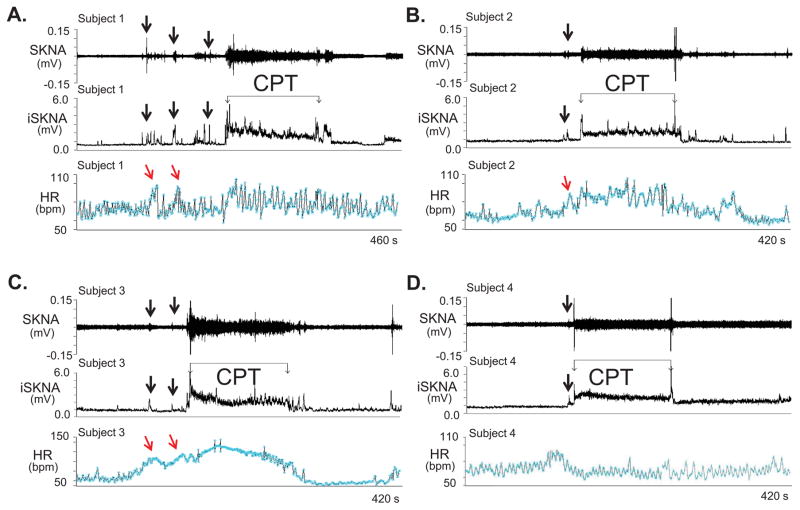
Figure 2 shows CPT tracings from subjects 1–4 (Panels A–D). SKNA increased prior to CPT (arrows), likely due to the anticipation of the impending cold water immersion. Massive elevation of SKNA was observed immediately after immersion and remains elevated throughout the test, but the HR responses did not always correlate with SKNA. A weak correlation between HR and sympathetic nerve activity has also been observed in microneurography studies.9, 13 As fingertips do not have skeletal muscles, to address the possibility that muscle contraction contributed to signal increase when electrodes were placed on or across the chest wall, for subjects 5–7 we placed the two electrodes in a bipolar montage with electrodes on the 2nd and 3rd digits, respectively, of the non-immersed hand (Supplement Figure 1, Protocol 1-Configuration 2). The reference was on the ipsilateral thumb. While there was an increase in average SKNA during CPT, the magnitude was smaller than in most other electrode positions (Table 1). Placing the electrodes further apart on the non-immersed arm of subjects 11 and 12 (Supplement Figure 1, Protocol 1-Configuration 3) generated visible and statistically significant increase (Table 1).
Figure 2.
neuECG recordings during the cold water pressor test (CPT) in Protocol 1. The electrode location was on the right and left arm for ECG Lead I recording. A–D: Increased skin sympathetic nerve activity (SKNA) was detected in subjects 1–4, respectively, during the CPT. Black downward arrows point to increased SKNA prior to CPT, likely due to the anticipation of the impending cold water immersion. The increased SKNA was associated with heart rate acceleration in patients 1–3, but not in patient 4. Integrated SKNA (iSKNA) shows the total SKNA over 100 ms windows after applying 500 Hz high pass filter. HR= heart rate, bmp=beats per minute.
Protocol 2
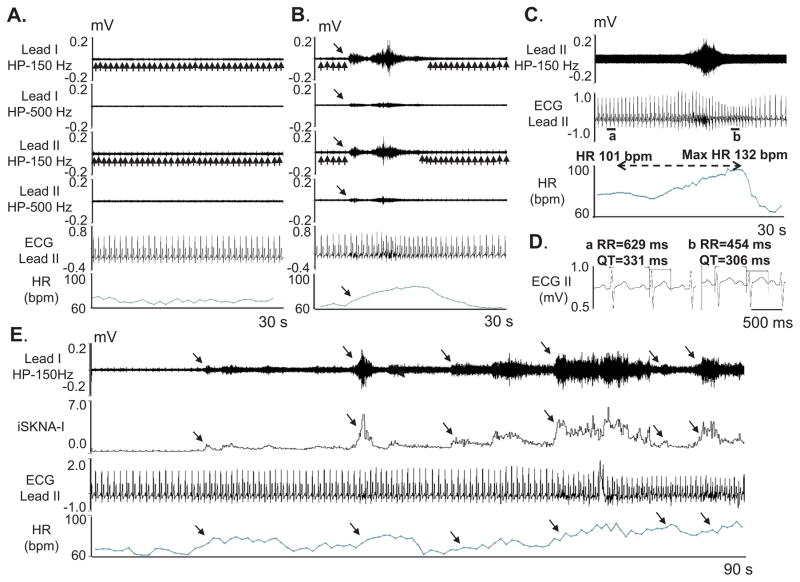
Out of 190 SKNA discharges, 189 were followed by HR acceleration (Figure 3A and 3B). The average HR increased by 12.36±0.48 bpm [95% CI 11.43–13.30 bpm] from 71.38±0.67 bpm to 83.74±0.77 bpm (p<0.05). The average Pearson’s correlation coefficient between average SKNA in leads I and II was 0.83±0.13, between lead I average SKNA and the HR was 0.73±0.14 and between lead II average SKNA and the HR was 0.67±0.13 (p<0.05 for all). Data for each individual patient is included in Supplement Table 2. Compared to the 10 s before the beginning of the SKNA discharge, a significant increase in average SKNA was noted in both leads (by 1.15±0.86 [95% CI 1.02–1.27 μV] in lead I and by 0.96±0.88 [95% CI 0.84–1.09 μV] in lead II, p<0.05 for both) in the 10 s window after the onset of SKNA discharge. We randomly selected additional 190 episodes of SKNA. The SKNA was associated with QT interval shortening from 387±24 ms to 369±24 ms (p<0.001) but with increased QTc from 420±25 ms to 458±27 ms (p<0.001) (Figure 3C). These findings were consistent with the QT interval responses of normal subjects to sympathetic stimulation.14
Figure 3.
neuECG recording in patients without known heart diseases in Protocol 2. The neuECG electrodes were placed on the chest to form Lead I and Lead II. A shows baseline recording in leads I and II filtered at either 150 Hz or 500 Hz high pass to display SKNA and low pass filtered at 10 Hz to display the ECG. B shows an episode of SKNA associated with heart rate (HR) acceleration (downward arrows). The 150 Hz high pass filter resulted in better signal to noise ratio and higher amplitude of SKNA, but some ECG signals remained (upward arrows). High pass filter at 500 Hz largely eliminated the ECG signals, but also reduced nerve amplitude and the signal to noise ratio. The baseline artifact on the surface ECG occurred after the onset of SKNA, suggesting motion artifacts induced by muscle movement. C shows SKNA (500 Hz high pass, Lead II) and ECG tracings (125 Hz low pass) from a different patient. There was abrupt increase of HR from 101 beats per minute (bpm) to a maximum (max) of 132 bpm after SKNA activation, along with QT interval shortening. D shows the enlarged ECG from line segments a and b in C. Both the RR and the QT interval shortened after SKNA. E shows a 90 s recording at baseline, illustrating spontaneous SKNA episodes and their relationship with HR. HP=high pass, LP=low pass, bpm=beats per minute.
Protocol 3
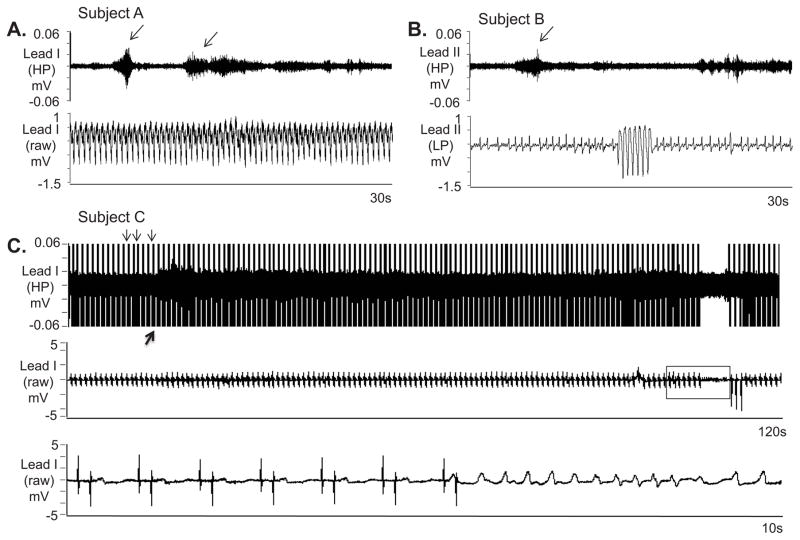
The characteristics of all electrical storm patients are listed in Supplemental Table 3. The recordings lasted for 39.0±28.2 hours. Ten of the 22 patients had recurrent VT on the recording, one of which was predominantly in incessant hemodynamically stable VT and had over 400 non-sustained monomorphic VT episodes with HR around 120 bpm. The first 400 non-sustained VT episodes in the patient with incessant VT while on the recording were selected and all of them were preceded by SKNA discharges in both leads I and II. This patient also had 2 episodes of VT lasting ≥30 s and many nerve discharges were observed during VT (Figure 4A). The other 9 patients accounted for 146 separate VT episodes with a HR of 208±68 bpm and duration of 34±253 s (range 1–2983 s). The majority of those episodes were non-sustained (34% non-sustained monomorphic VT, 58% non-sustained polymorphic VT) with sustained (> 30 s or requiring therapy) VT representing only 8%. A total of 73% of VT episodes were preceded by discharges in lead I (Figure 4B, subject B) and 38% were preceded by discharges in lead II. By using generalized linear mixed model, the odds ratio of having discharge 30 s before the VT versus during the 30 s control periods (109 episodes, 12±13, range:1–33 per patient) 20 min after the VT episodes for a specific patient as detected by lead I was 7.45 [95% CI 3.14–17.72], p<0.0001). No significant difference was noted for lead II. While there was an association between SKNA in Lead I and VT, these findings alone did not prove that SKNA caused VT episodes.
Figure 4.
SKNA during sustained VT and before nonsustained VT. The neuECG electrodes were placed on the chest to form Lead I and Lead II. A: Nerve discharges (arrows) are noted throughout monomorphic ventricular tachycardia (VT). Signals simultaneously obtained from ECG lead I with the top panel representing the signal after 500 Hz high pass (HP) filter and the bottom panel displaying the raw signal. B: Similar discharges are observed in another patient preceding non-sustained VT. Signal simultaneously obtained from ECG lead II, the top panel is filtered at 500 Hz high pass and the bottom ECG is filtered at 10 Hz low pass. C: Pacing artifacts (downward arrows) are observed despite 500 Hz high pass filtering. Increased high frequency SKNA is still evident (upward arrow) beginning 90 s prior to VT. The bottom panel shows the boxed segment from the middle panel and the onset of VT. VT=ventricular tachycardia, ECG=electrocardiogram, HP=500 Hz high pass filter, LP=10 Hz low pass filter, SKNA=skin sympathetic nerve activity.
Similar to prior canine studies,7 pacemaker spikes could not be completely filtered despite 500 Hz high pass filtering (Figure 4C). In half of the patients the signal to noise ratio was poor with the nerve discharges reaching a signal to noise ratio ≥ 2:1 only for several ms (Figure 5A). External defibrillation (Figure 5B) and anti-tachycardia pacing (Figure 5C and 5D) increased SKNA. High pass filtering at 150 Hz (middle panel) improves the signal to noise ratio (Figure 5C and 5D).
Figure 5.
Further examples of SKNA and VT. A: Increased nerve activity, including a large spike (arrow) is noted in lead I in a intubated and sedated patient with electrical storm after 500 Hz high pass filtering. The signal is better appreciated in the middle panel after rectification and baseline adjustment. The simultaneous raw electrocardiogram (ECG) is displayed in the bottom panel and shows both premature ventircular contractions and a brief run of polymorphic VT. B displays similar simultaneous recordings in the same patient during sustained VT requiring external defibrillation (arrow, top panel). The defibrillation was followed immediately by large SKNA. The shock was only transiently successful, followed by recurrences of VT. Recordings from C and D are from another patient with VT and are continuous. In this recording after high pass filtering, the signal to noise ratio of SKNA prior to VT in C, top and middle panel does not reach 2:1. High pass filtering at 150 Hz again improves the signal to noise ratio (downward arrows, C). However as the arrhythmia continues in D and the patient’s device delivers successful burst of anti-tachycardia pacing (downward arrows, bottom panel), incraesed SKNA is detected both with 500 Hz high pass filter and 150 Hz high pass filter. VT=ventricular tachycardia, ECG=electrocardiogram, SKNA=skin sympathetic nerve activity.
Protocol-4
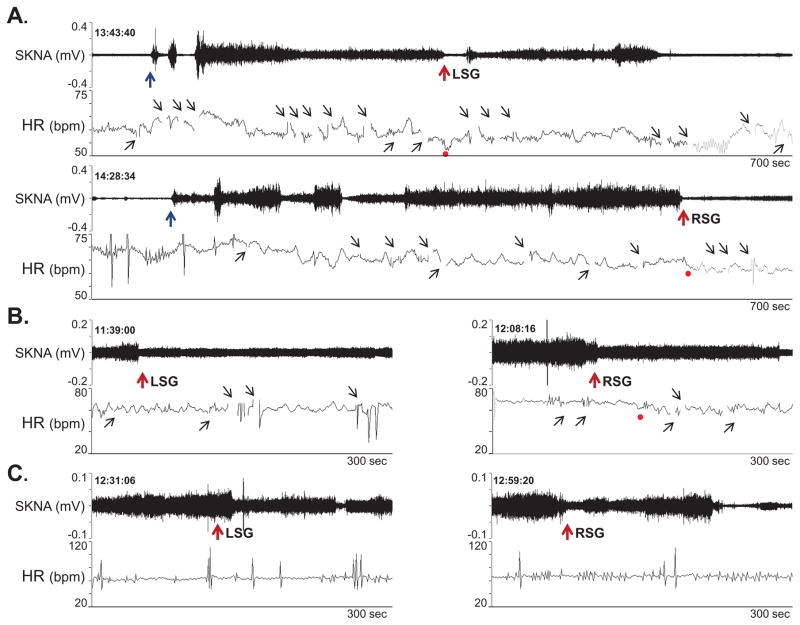
The injection protocol included inserting needles under fluoroscopic guidance and local contrast injection to ascertain the location of the needle. During these procedures, the patient had significant SKNA activation. Lidocaine injection into the stellate ganglia reduced SKNA in all 3 patients studied (Figure 6).
Figure 6.
Effects of lidocaine (10 ml, 2 %) stellate ganglion block on SKNA continuously recorded from the right arm. A shows patient 1. Needle insertion (black arrows) was followed by activation of SKNA. Lidocaine injection (red arrows) into the LSG transiently reduced SKNA. However, RSG injection was followed by a significant reduction of SKNA. Panels B and C show responses to lidocaine injection in the remaining 2 patients. The gaps in tachogram (small black upward arrows) occurred because artifacts prevented automated selections of the R waves.
Discussion
In this manuscript we report a new method to record sympathetic nerve activity from the surface of the skin. Chest wall SKNA showed temporal patterns of response to CPT and VM that closely resemble those of microneurographic recordings of subcutaneous sympathetic nerve activity: a) anticipatory bursts immediately preceding performance of these provocative maneuvers; b) rapid onset and rapid peak of the increase in SKNA which progressively lessens during continued performance of the maneuver; c) lack of pulse-synchronous sympathetic bursts and lack of reciprocal changes to fluctuations in blood pressure, indicating lack of arterial baroreflex regulation. The latter is also evident during spontaneous premature ventricular contractions (the falling diastolic blood pressure during the compensatory pause did not trigger a large burst of SKNA). We found that spontaneous bursts of chest wall SKNA were followed by an abrupt increase of heart rate at basal state in patients without heart diseases and preceded 73% of spontaneous VT episodes in 9 VT patients. Lidocaine injection into the stellate ganglia suppressed SKNA. Taken together, these data strongly suggest that SKNA may be useful in estimating sympathetic tone. Because skin is easily accessible, this new method of SKNA recording may be useful to a broad spectrum of physiological and pathophysiological investigations.
SGNA and SKNA
Stellate ganglion was a major source of cardiac innervation. While it was difficult to record stellate ganglion nerve activity (SGNA) in humans, we had successfully recorded SGNA from ambulatory animals.15 The SGNA was broad based and not pulse synchronous,16 thus was morphologically more similar to subcutaneous sympathetic nerve activity than muscle sympathetic nerve activity as recorded by microneurography.17–19 Subsequently we were able to use bipolar electrodes to simultaneously record SGNA, SKNA and subcutaneous nerve activity (SCNA) in ambulatory dogs.6, 8 The results showed that the morphology and magnitude of SCNA and SKNA indeed resembled that of the SGNA. Both SGNA and SCNA preceded the heart rate acceleration in basal state and the onset of spontaneous ventricular arrhythmias in a canine model of sudden death.7 However, we do not have actual SGNA recordings from humans to confirm the correlation between SKNA and SGNA in this study.
Effects of ganglionic blockade and activation
When microneurography techniques were initially invented, the investigators confirmed the sympathetic origin of these high frequency signals by performing either local or ganglionic blockade procedures.20 In the present study, we also showed that ganglionic blockade inhibited the SKNA, indicating that SKNA contains post-ganglionic sympathetic nerve activity. We previously showed in a canine model that local injection of apamin into the stellate ganglion can directly result in simultaneous activation of SGNA and SKNA, indicating that the stellate ganglion is a source of both electrical activities.8 More recent study from our laboratory showed that in ambulatory rats, peritoneal injection of neurotoxic 6-hydroxydopamine resulted in a progressive and significant reduction of SCNA, again indicating the sympathetic origin of these signals.21 Putting these data together, we propose that SKNA recording provides a useful non-invasive estimation of sympathetic tone.
Filter settings
Like all diagnostic tests, specificity can be increased only at the cost of reduction in sensitivity and vice versa. A high pass filter setting of 150 Hz eliminates ECG but not all muscle noise. While most muscle activity had a frequency of <100 Hz,22 small amount of muscle activities could reach 400 Hz.23 A 500 Hz high pass filter setting is thus more specific for recording neurogram, but a large majority of the nerve signals are filtered out (thus lowers the sensitivity). In comparison, the high pass filter settings of the microneurography studies typically ranged between 400 Hz to 700 Hz.12, 24 In addition to low frequency noise, the patient care areas may have electrical equipment that emits high frequency noise. When high frequency noise is present, high pass filtering the signals alone may be insufficient. Bandpass filtering might be needed to optimize the signal to noise ratio. Figure 2 in the Online Supplement illustrates the relationship between filter setting and the signal to noise ratio.
Limitations of the study
Microneurography studies can selectively record from muscle and skin sympathetic nerves. On the other hand, SKNA recordings use skin patch electrodes, which might simultaneously detect both skin and muscle sympathetic nerve activities. Further studies will be needed to determine how much of these two different types of signals are represented in the SKNA recordings.
Conclusions
We conclude that SKNA is detectable using conventional ECG electrodes in humans and may be useful in estimating the sympathetic tone.
Supplementary Material
Acknowledgments
We thank Roxanne Kovacs, RN, MSN for her assistance.
Sources of Funding
Supported by a fellowship award from the American Heart Association (Dr Doytchinova), NIH grants R41 HL124741, R42 DA043391 (Dr Everett), P01 HL78931, R01 HL71140 (Dr Chen), R01 HL117983 (Dr Victor), Indiana University School of Medicine Biomedical Research Grant, a Charles Fisch Cardiovascular Research Award endowed by Dr Suzanne B. Knoebel of the Krannert Institute of Cardiology (Dr Everett), Burns and Allen Chair in Cardiology Research of the Cedars-Sinai Medical Center (Dr Victor), a Medtronic-Zipes Endowment and the Indiana University Health-Indiana University School of Medicine Strategic Research Initiative (Dr Chen).
Footnotes
Disclosures
Shien-Fong Lin and Peng-Sheng Chen have equity interest in Arrhythmotech, LLC. Medtronic, St Jude and Cyberonics Inc. donated research equipment to Dr Chen’s research laboratory.
Publisher's Disclaimer: This is a PDF file of an unedited manuscript that has been accepted for publication. As a service to our customers we are providing this early version of the manuscript. The manuscript will undergo copyediting, typesetting, and review of the resulting proof before it is published in its final citable form. Please note that during the production process errors may be discovered which could affect the content, and all legal disclaimers that apply to the journal pertain.
References
- 1.Kligfield P, Gettes LS, Bailey JJ, et al. Recommendations for the standardization and interpretation of the electrocardiogram. Part I: The electrocardiogram and its technology.A scientific statement from the American Heart Association Electrocardiography and Arrhythmias Committee, Council on Clinical Cardiology; the American College of Cardiology Foundation; and the Heart Rhythm Society. Heart Rhythm. 2007;4:394–412. doi: 10.1016/j.hrthm.2007.01.027. [DOI] [PubMed] [Google Scholar]
- 2.Chakravarthy Marx S, Kumar P, Dhalapathy S, Anitha Marx C. Distribution of sympathetic fiber areas in the sensory nerves of forearm: an immunohistochemical study in cadavers. Rom J Morphol Embryol. 2011;52:605–611. [PubMed] [Google Scholar]
- 3.Donadio V, Nolano M, Provitera V, Stancanelli A, Lullo F, Liguori R, Santoro L. Skin sympathetic adrenergic innervation: an immunofluorescence confocal study. Ann Neurol. 2006;59:376–381. doi: 10.1002/ana.20769. [DOI] [PubMed] [Google Scholar]
- 4.Baron R, Janig W, With H. Sympathetic and afferent neurones projecting into forelimb and trunk nerves and the anatomical organization of the thoracic sympathetic outflow of the rat. J Auton Nerv Syst. 1995;53:205–214. doi: 10.1016/0165-1838(94)00171-f. [DOI] [PubMed] [Google Scholar]
- 5.Taniguchi T, Morimoto M, Taniguchi Y, Takasaki M, Totoki T. Cutaneous distribution of sympathetic postganglionic fibers from stellate ganglion: A retrograde axonal tracing study using wheat germ agglutinin conjugated with horseradish peroxidase. J Anesth. 1994;8:441–449. doi: 10.1007/BF02514624. [DOI] [PubMed] [Google Scholar]
- 6.Robinson EA, Rhee KS, Doytchinova A, et al. Estimating Sympathetic Tone by Recording Subcutaneous Nerve Activity in Ambulatory Dogs. J Cardiovasc Electrophysiol. 2014;26:70–78. doi: 10.1111/jce.12508. [DOI] [PMC free article] [PubMed] [Google Scholar]
- 7.Doytchinova A, Patel J, Zhou S, Chen H, Lin S-F, Shen C, Everett TH, IV, Lin SF, Chen P-S. Subcutaneous Nerve Activity and Spontaneous Ventricular Arrhythmias in Ambulatory Dogs. Heart Rhythm. 2015;122:612–620. doi: 10.1016/j.hrthm.2014.11.007. [DOI] [PMC free article] [PubMed] [Google Scholar]
- 8.Jiang Z, Zhao Y, Doytchinova A, et al. Using Skin Sympathetic Nerve Activity to Estimate Stellate Ganglion Nerve Activity in Dogs. Heart Rhythm. 2015;12:1324–1332. doi: 10.1016/j.hrthm.2015.02.012. [DOI] [PMC free article] [PubMed] [Google Scholar]
- 9.Victor RG, Leimbach WN, Jr, Seals DR, Wallin BG, Mark AL. Effects of the cold pressor test on muscle sympathetic nerve activity in humans. Hypertension. 1987;9:429–436. doi: 10.1161/01.hyp.9.5.429. [DOI] [PubMed] [Google Scholar]
- 10.Salmanpour A, Frances MF, Goswami R, Shoemaker JK. Sympathetic neural recruitment patterns during the Valsalva maneuver. Conf Proc IEEE Eng Med Biol Soc. 2011;2011:6951–6954. doi: 10.1109/IEMBS.2011.6091757. [DOI] [PubMed] [Google Scholar]
- 11.Gatzoulis KA, Andrikopoulos GK, Apostolopoulos T, Sotiropoulos E, Zervopoulos G, Antoniou J, Brili S, Stefanadis CI. Electrical storm is an independent predictor of adverse long-term outcome in the era of implantable defibrillator therapy. Europace. 2005;7:184–192. doi: 10.1016/j.eupc.2005.01.003. [DOI] [PubMed] [Google Scholar]
- 12.White DW, Shoemaker JK, Raven PB. Methods and considerations for the analysis and standardization of assessing muscle sympathetic nerve activity in humans. Auton Neurosci. 2015;193:12–21. doi: 10.1016/j.autneu.2015.08.004. [DOI] [PMC free article] [PubMed] [Google Scholar]
- 13.Fagius J, Karhuvaara S, Sundlof G. The cold pressor test: effects on sympathetic nerve activity in human muscle and skin nerve fascicles. Acta Physiol Scand. 1989;137:325–334. doi: 10.1111/j.1748-1716.1989.tb08760.x. [DOI] [PubMed] [Google Scholar]
- 14.Viskin S, Postema PG, Bhuiyan ZA, et al. The response of the QT interval to the brief tachycardia provoked by standing: a bedside test for diagnosing long QT syndrome. J Am Coll Cardiol. 2010;55:1955–1961. doi: 10.1016/j.jacc.2009.12.015. [DOI] [PMC free article] [PubMed] [Google Scholar]
- 15.Chen PS, Chen LS, Fishbein MC, Lin SF, Nattel S. Role of the autonomic nervous system in atrial fibrillation: pathophysiology and therapy. Circ Res. 2014;114:1500–1515. doi: 10.1161/CIRCRESAHA.114.303772. [DOI] [PMC free article] [PubMed] [Google Scholar]
- 16.Hellyer J, Akingba A, Rhee K-S, Tan AY, Lane KA, Shen C, Patel J, Fishbein M, Chen P-S. Autonomic Nerve Activity and Blood Pressure in Ambulatory Dogs. Heart Rhythm. 2013;11:307–313. doi: 10.1016/j.hrthm.2013.11.022. [DOI] [PMC free article] [PubMed] [Google Scholar]
- 17.Sundlof G, Wallin BG. Human muscle nerve sympathetic activity at rest. Relationship to blood pressure and age. J Physiol. 1978;274:621–637. doi: 10.1113/jphysiol.1978.sp012170. [DOI] [PMC free article] [PubMed] [Google Scholar]
- 18.Wallin BG, Delius W, Sundlof G. Human muscle nerve sympathetic activity in cardiac arrhythmias. Scand J Clin Lab Invest. 1974;34:293–300. doi: 10.3109/00365517409049883. [DOI] [PubMed] [Google Scholar]
- 19.Mano T. Microneurographic research on sympathetic nerve responses to environmental stimuli in humans. Jpn J Physiol. 1998;48:99–114. doi: 10.2170/jjphysiol.48.99. [DOI] [PubMed] [Google Scholar]
- 20.Vallbo AB, Hagbarth KE, Wallin BG. Microneurography: how the technique developed and its role in the investigation of the sympathetic nervous system. J Appl Physiol. 2004;96:1262–1269. doi: 10.1152/japplphysiol.00470.2003. [DOI] [PubMed] [Google Scholar]
- 21.Zhao Y, Chen NX, Shirazi JT, Shen C, Lin SF, Fishbein MC, Moe SM, Chen PS. Subcutaneous nerve activity and mechanisms of sudden death in a rat model of chronic kidney disease. Heart Rhythm. 2015;13:1105–1112. doi: 10.1016/j.hrthm.2015.12.040. [DOI] [PMC free article] [PubMed] [Google Scholar]
- 22.McAuley JH, Rothwell JC, Marsden CD. Frequency peaks of tremor, muscle vibration and electromyographic activity at 10 Hz, 20 Hz and 40 Hz during human finger muscle contraction may reflect rhythmicities of central neural firing. Exp Brain Res. 1997;114:525–541. doi: 10.1007/pl00005662. [DOI] [PubMed] [Google Scholar]
- 23.Komi PV, Tesch P. EMG frequency spectrum, muscle structure, and fatigue during dynamic contractions in man. Eur J Appl Physiol Occup Physiol. 1979;42:41–50. doi: 10.1007/BF00421103. [DOI] [PubMed] [Google Scholar]
- 24.Vongpatanasin W, Mansour Y, Chavoshan B, Arbique D, Victor RG. Cocaine stimulates the human cardiovascular system via a central mechanism of action. Circulation. 1999;100:497–502. doi: 10.1161/01.cir.100.5.497. [DOI] [PubMed] [Google Scholar]
Associated Data
This section collects any data citations, data availability statements, or supplementary materials included in this article.


