

Abstract
Several xenobiotic agents (e.g. metals, polycyclic aromatic hydrocarbons, nanoparticles, etc.) commonly involve the generation of reactive oxygen species (ROS) and oxidative stress as part of their toxic mode of action. Among piscine models, the zebrafish is a popular vertebrate model to study toxicity of various xenobiotic agents. Similarly to other vertebrates, zebrafish possess an extensive antioxidant system, including the reduced form of glutathione (GSH), which is an important antioxidant that acts alone or in conjunction with enzymes, such as glutathione peroxidase (GPx). Upon interaction with ROS, GSH is oxidized, resulting in the formation of glutathione disulfide (GSSG). GSSG is recycled by an auxiliary antioxidant enzyme glutathione reductase (GR). This article outlines detailed methods to measure the concentrations of GSH and GSSG, as well as the activities of GPx and GR in zebrafish larvae as robust and economical means to assess oxidative stress. The studies that have assessed these endpoints in zebrafish and alternative methods are also discussed. We conclude that the availability of these robust and economical methods support the use of zebrafish as a model organism in studies evaluating redox biology, as well as the induction of oxidative stress following exposure to toxic agents.
Keywords: Zebrafish; Oxidative stress; Glutathione (GSH, GSSG); Glutathione peroxidase (GPx); Glutathione reductase (GR)
1. Introduction
All aerobic organisms naturally produce reactive oxygen species (ROS). The primary contributors of cellular ROS are mitochondria, where oxygen acts as the final electron acceptor within the electron-transport chain (ETC). Approximately 0.1–0.4% of this oxygen is transformed into the oxygen radical superoxide anion (O2·−) due to a ‘leaky’ ETC (Hermes-Lima, 2005). The conversion of O2·− into other ROS, such as hydrogen peroxide (H2O2) and hydroxyl radical (HO·), occurs within the reductive environment of the cellular milieu (Davies, 1995). An imbalance between oxidants (ROS) and antioxidants in favor of the oxidants, or oxidative stress, can disrupt redox signalling and damage cellular components (Sies and Jones, 2007). Not surprisingly, there are several defense systems against oxidative stress and damage; these include antioxidant compounds (e.g. glutathione) and enzymes (e.g. glutathione peroxidase), as well as systems to repair or replace damaged cellular components (Davies, 2000).
Among the numerous endpoints that can be assessed to estimate oxidative stress in a biological system, glutathione-associated measurements are often a primary choice. Reduced glutathione (GSH) is a tripeptide that protects against ROS and ROS-generated byproducts. It acts as an independent antioxidant or in conjunction with enzymes, including glutathione peroxidase (GPx; EC 1.11.1.9), whose action reduces hydroperoxides and lipid peroxides into water and corresponding alcohols, respectively. Upon interaction with ROS (mainly H2O2 and lipid peroxides), GSH is converted into its disulfide or oxidized form (GSSG) (Di Giulio and Meyer, 2008). GSSG is recycled back into GSH by an auxiliary antioxidant enzyme – glutathione reductase (GR; EC 1.8.1.7) (Mannervik, 1987).
A kinetic method to measure GSH and GSSG was first described in Griffith (1980). This method is based on enzymatic recycling procedure, in which GSH is sequentially oxidized by 5,5′-dithiobis-2-nitrobenzoic acid (DTNB) and reduced by NADPH in the presence of GR. The activity of GPx and GR can also be assessed. A kinetic method for measuring the activity of GPx was first described in Strauss et al. (1980). This two-step method involves i) neutralization of H2O2 by GPx in the presence of GSH and ii) recycling of resulting GSSG by GR in the presence of NADPH; consumption of NADPH is then used as a proxy for GPx activity. A kinetic method to measure GR activity was first reported in Racker (1955). The method involves the second part of the aforementioned GPx assay. Although quite old, these methods are still used today; the appearance of 96-well microplate readers and the easy access to the relatively inexpensive reagents certainly helped to simplify and increase the throughput of these assays.
Traditionally, murine models have been used to assess the potential of certain compounds to act as pro- or antioxidants, as well as to study the involvement of oxidative stress in disease. However, due to similarities across the antioxidant defense systems of mammalian and piscine organisms, piscine models are increasingly recognized for their importance in understanding oxidative stress not only as it relates to pollutant-mediated toxicity, but also as means to better understand mammalian-related phenomena (Kelly et al., 1998).
Across the various piscine models, the zebrafish (Danio rerio) is a common model of choice. Zebrafish have been mostly used in developmental biology and molecular genetics, but have also been proposed as a model for human disease (Lieschke and Currie, 2007) and recognized as a valuable vertebrate model for toxicology and drug discovery (Fako and Furgeson, 2009; Hill et al., 2005; Yang et al., 2009). With regards to oxidative stress, various parts of the zebrafish antioxidant system, including antioxidant enzyme activities and glutathione concentrations, were assessed previously (e.g. Massarsky et al., 2013; 2015). Given the importance of glutathione within the antioxidant defense system, this manuscript aims to outline detailed protocols to assess GSH and GSSG concentrations, as well as GPx and GR activities in zebrafish larvae. The methods described herein are specific, high-throughput, and cost-effective – putting forward zebrafish as a valuable model for the study of oxidative stress.
2. Materials and methods
2.1. Chemicals
All reagents were purchased from Sigma-Aldrich.
2.2. Zebrafish processing
Typically in toxicological studies, zebrafish are exposed to various compounds up to 3–5 days post-fertilization (dpf). At the end of the exposure the larvae are collected into 1.5 mL Eppendorf tubes and rinsed with ice-cold medium. The medium is then removed and the larvae are snap-frozen in liquid nitrogen and stored at −80°C until analyzed. This manuscript demonstrates the assays using 4 dpf zebrafish larvae (15 larvae per tube) that were not exposed to any chemicals. Note: these methods can easily be adapted for zebrafish embryos and/or larvae at other developmental stages, as well as isolated tissues or cells by adjusting the number/amount of embryos/larvae/tissue/cells used for each sample, with a target mass of ~5–10 mg.
2.3. Glutathione concentrations
2.3.1. Solution preparation
Several solutions are needed to perform the assay. Please see section 2.3.2 step 16 for a note on solution preparation.
-
1
Sulfosalicylic acid (SA). Prepare 5% solution by dissolving 5 g SA in double distilled water (ddH2O) and completing to 100 mL, using a volumetric flask or a graduated cylinder. Prior to use, 5% SA should be bubbled with nitrogen (or argon) gas for 20 min, in order to replace oxygen; this step is necessary to prevent auto-oxidation of GSH in the samples. Keep 5% SA on ice until used for standard/sample preparations. When not in use, 5% SA should be kept at 4°C.
-
2
Solutions A and B. Solution A is 1000 mM KH2PO4 (dissolve 6.12 g KH2HPO4 in ddH2O in a final volume of 45 mL). Solution B is 1000 mM K2HPO4 (dissolve 7.83 g K2HPO4 in ddH2O in a final volume of 45 mL). These solutions can be kept separately at room temperature and should be refreshed every several months.
-
3
EDTA. Prepare 134 mM EDTA (disodium dihydrate salt) solution (dissolve 1 g EDTA in ddH2O in a final volume of 20 mL). EDTA solution can be kept at room temperature and refreshed every six months.
-
4
Potassium phosphate buffered solutions (KPB-100 and KPB-500). To prepare KPB-100, mix 4 mL Solution A, 6 mL Solution B, and 0.82 mL EDTA solution, complete to 100 mL with ddH2O, and adjust to pH 7.0. To prepare KPB-500, mix 2 mL Solution A, 3 mL Solution B, and 0.074 mL EDTA solution, complete to 10 mL with ddH2O, and adjust to pH 7.0. KPB-100 and KPB-500 can be kept at 4°C for up to 1 week.
-
5
2-vinylpyridine. Prepare a 28 μL/mL 2-vinylpyridine solution by mixing 28 μL commercially available 2-vinylpyridine stock solution with 1 mL KPB-500. 2-vinylpyridine solution should be thoroughly vortexed (white cloudy solution) prior to use.
-
6
NaOH. Prepare 125 mM NaOH, by mixing 100 μL 5 M NaOH with KPB-100 in a final volume of 4 mL.
-
7
Glutathione reductase (GR). Prepare a 2 U/mL GR solution by mixing 40 μL commercially available GR stock solution (Sigma G3664) in 4 mL KPB-100.
-
8
Assay solution. The Assay solution contains 0.7 mM DTNB and 0.3 mM NADPH. Combine 21 mg DTNB, 18 mg NADPH, and 80 mL KPB-100. NADPH is quite expensive; thus, it is recommended to adjust the volume of this solution according to the total number of samples (please remember that each sample or standard will be run in duplicate and that the same Assay solution will be used to assess both TGSH and GSSG concentrations).
-
9
GSH standards. Prepare a 10 mM GSH stock solution by adding 3 mg GSH to 1 mL 5% SA. Perform serial dilution to prepare the standard curve 100, 50, 25, 12.5, 6.25, and 0 μM.
-
10
GSSG standards. Prepare 10 mM GSSG stock solution by adding 6.1 mg GSSG to 1 mL 5% SA. Perform serial dilution to prepare the standard curve 10, 5, 2.5, 1.25, 0.625, and 0 μM. Ensure that there is 50 μL of each GSSG standard.
2.3.2. Sample preparation
-
11
Transfer the preserved samples from −80°C onto dry ice or liquid nitrogen.
-
12
Add 200 μL of 5% SA to a sample and sonicate for 5–10 s. A homogenous grey suspension should be apparent at this stage (Fig. 1). Place the sample on ice and continue with the next sample.
Note: samples can also be homogenized using glass-glass homogenizer in the absence of a sonicator.
-
13
Centrifuge the sonicated samples at 5000 g for 5 min at 4°C.
-
14
Collect the supernatant into fresh 0.5 mL tube. Keep the samples on ice. These samples will be used to measure total GSH (TGSH = GSH + 2GSSG).
-
15
Transfer a 50 μL aliquot of each sample from step 14 into a fresh 0.5 mL tube. These samples will be used to measure GSSG.
-
16
Add 50 μL of NaOH solution (step 6) and 10 μL of 2-vinylpyridine solution (step 5) to each sample from step 15 and GSSG standards from step 10. Vortex briefly to ensure that the contents are mixed, and spin down to ensure that the contents are at the bottom of the tube. Incubate for 90 min at room temperature.
Note: the 90 min incubation in this step 16 allows for sufficient time to prepare solutions in steps 7–9.
Figure 1.
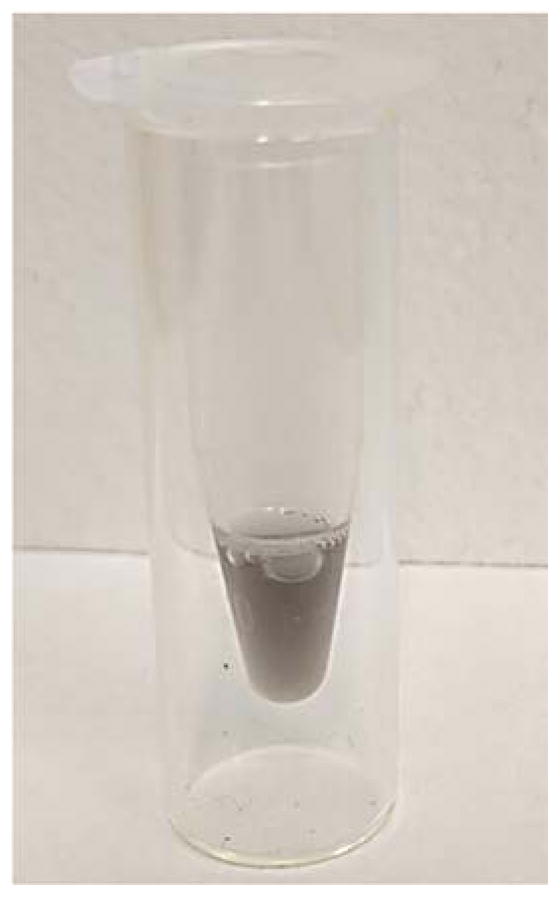
Homogenized larvae appear as a grey suspension. Note: the Eppendorf tube was placed into a plastic tube holder for image purposes.
2.3.3. Performing the assay
-
17
To measure TGSH, add 10 μL of standard (step 9) or sample (step 14) to the bottom of a well on a 96-well plate. It is recommended to add each standard/sample in duplicate. Using a repeater pipette (or a multichannel pipette) add 200 μL Assay solution (step 8) to each well. Lightly tap on the side of plate to mix the contents. Add 10 μL GR solution (step 7). Addition of GR solution will initiate the reaction, so it is important to add it as quickly as possible to each well.
-
18
Read the plate at 412 nm for 15–30 min in a spectrophotometer [in this study SpectraMax M5 Spectrophotometer (Molecular Devices, Sunnyvale, CA) and SOFTmax Pro software (Molecular Devices) were used]. An increase in absorbance should be evident after several seconds especially in the highest standard. Please note that the SOFTmax Pro software refers to the change in absorbance over time as ‘Vmax’; this is not a true ‘Vmax’, but rather ‘V’ under the conditions of the assay. In the following sections ‘Vmax’ is used for simplicity only.
-
19
To measure GSSG, repeat step 17, but this time use the standards/samples from step 16. There is considerably less GSSG and the increase in absorbance will occur slower compared to TGSH.
2.3.4. Calculating glutathione concentrations
-
20
For both TGSH and GSSG, the standard curve allows for conversion of the Vmax (change in absorbance over time) of samples into units of μM. To convert to pmol/larva, multiply the values (μM) by 0.0002 L (this value corresponds to 200 μL of 5% SA), divide by 15 (this is the number of larvae in each tube), multiply by 1000 (to get nmol/larva), and multiply by 1000 (to get pmol/larva).
2.4. Glutathione reductase (GR) activity
2.4.1. Solution preparation
Several solutions are needed to perform the assay.
-
1
KPB-50. To prepare KPB-50, mix 1.9 mL Solution A, 3 mL Solution B, and 0.37 mL EDTA solution, complete to 100 mL with ddH2O, and adjust to pH 7.0. KPB-50 can be kept at 4°C for up to 1 week.
-
2
KPB-50 supplemented with protease inhibitor cocktail (PIC). Mix KPB-50 with PIC stock solution (Sigma P8340) at 100:1 ratio according to the number of samples (each sample will be homogenized in 200 μL; therefore, if there are 10 samples, mix 2 mL KPB-50 with 20 μL PIC). This solution will be used to homogenize the samples.
-
3
Assay solution. The Assay solution contains 0.3 mM NADPH. Combine 4.6 mg NADPH and 20 mL KPB-50. This solution can be prepared after sample preparation, and should be kept on ice until step 9.
-
4
GSSG. Prepare 22 mM GSSG solution by mixing 13.5 mg GSSG in 1 mL ddH2O. This solution can be prepared after sample preparation.
2.4.2. Sample preparation
-
5
Transfer the preserved samples from −80°C onto dry ice or liquid nitrogen.
-
6
Add 200 μL of KPB-50(PIC) to a sample and sonicate for 5–10 s. A homogenous grey suspension should be apparent at this stage (Fig. 1). Place the sample on ice and continue with the next sample. Note: samples can also be homogenized using glass-glass homogenizer in the absence of a sonicator.
-
7
Centrifuge the sonicated samples at 15000 g for 15 min at 4°C.
-
8
Collect the supernatant into fresh 0.5 mL tube. Keep the samples on ice.
2.4.3. Performing the assay
-
9
To measure GR activity, add 10 μL of sample (step 8) to the bottom of a well on a 96-well plate. It is recommended to add each sample in duplicate. Include a blank [10 μL of KPB-50(PIC)]. Using a repeater pipette (or a multichannel pipette) add 200 μL Assay solution (step 3) to each well. Lightly tap on the side of plate to mix the contents. Add 10 μL GSSG solution (step 4). Addition of GSSG solution will initiate the reaction so it is important to add it as quickly as possible to each well.
-
10
Read the plate at 340 nm for 15–30 min in a spectrophotometer. A decrease in absorbance should be evident after several minutes (‘Vmax’, see note in section 2.3.3 step 18). After the reading is complete, measure the path length, using the spectrophotometer. This information is necessary to calculate the enzyme activity.
2.4.4. Calculating GR activity
Several details are needed to calculate the activity of GR: Vmax (obtained during step 10), path length (obtained during step 10), extinction coefficient of NADPH (at 340 nm it is 6.22 mM−1cm−1), dilution factor (total volume in well/sample volume = 22), and protein concentration in the sample (the BCA assay is not covered here).
-
11
Subtract the blank Vmax value from that of all samples. Multiply by −1 to eliminate the minus sign.
-
12
Divide by 1000 to convert ‘mOD/min’ to ‘OD/min’.
-
13
Divide by path length (in units of cm).
-
14
Divide by the extinction coefficient (in units of mM−1cm−1).
-
15
Divide by protein concentration in the sample (in units of mg/mL).
-
16
Multiply by the dilution factor (22).
-
17
The resulting number will give the specific activity of GR in units of ‘μmol/min/mg protein’.
Note: although ‘μmol/min/mg protein’ is the international unit for GR activity according to IUPAC, several studies, including this one report GR activity in units of ‘nmol/min/mg protein’ instead. To convert ‘μmol/min/mg protein’ into ‘nmol/min/mg protein’, multiply by 1000.
2.5. Glutathione peroxidase (GPx) activity
2.5.1. Solution preparation
This assay also uses KPB-50 that has been prepared in section 2.4.1 step 1. Additional solutions include:
-
1
Assay solution. The assay solution contains 5 mM NaN3, 18 mM GSH, and 0.9 U/mL commercially available GR stock solution. Combine 7.8 mg NaN3, 138.3 mg GSH, and 117 μL GR stock solution, add 5 mL ddH2O, and 20 mL KPB-50.
-
2
NADPH. Prepare 6 mM NADPH solution by mixing 5 mg NADPH in 1 mL KPB-50.
-
3
H2O2. Prepare 0.016% H2O2 solution by mixing 0.55 μL commercially available 30% H2O2 solution with 1 mL ddH2O.
2.5.2. Sample preparation
The supernatants obtained in section 2.4.2 step 8 are used in this assay as well.
2.5.3. Performing the assay
-
4
To measure GPx activity, add 10 μL of sample (section 2.4.2 step 8) to the bottom of a well on a 96-well plate. It is recommended to add each sample in duplicate. Include a blank [10 μL of KPB-50(PIC)]. Using a repeater pipette (or a multichannel pipette) add 200 μL Assay solution (step 1) to each well. Lightly tap on the side of plate to mix the contents. Incubate for 5 min at room temperature. Add 10 μL NADPH solution (step 2). Read the absorbance at 340 nm until the curves are flat (~5 min). Add 10 μL H2O2 solution (step 3). Addition of H2O2 solution will initiate the reaction so it is important to add it as quickly as possible to each well.
-
5
Read the plate at 340 nm for ~10 min in a spectrophotometer. A decrease in absorbance should be evident after several minutes (‘Vmax’, see note in section 2.3.3 step 18). Note: the decrease in absorbance in the blank wells is quite high due to oxidation of NADPH by H2O2; however, the activity in the samples should be higher than the blank. After the reading is complete, measure the path length, using the spectrophotometer. This information is necessary to calculate the enzyme activity.
2.5.4. Calculating GPx activity
Several details are needed to calculate the activity of GPx: Vmax (obtained during step 5), path length (obtained during step 5), extinction coefficient of NADPH (at 340 nm it is 6.22 mM−1cm−1), dilution factor (total volume in well/sample volume = 23), and protein concentration in the sample.
-
6
Subtract the blank Vmax value from that of all samples. Multiply by −1 to eliminate the minus sign.
-
7
Divide by 1000 to convert ‘mOD/min’ to ‘OD/min’.
-
8
Divide by path length (in units of cm).
-
9
Divide by the extinction coefficient (in units of mM−1cm−1).
-
10
Divide by protein concentration in the sample (in units of mg/mL).
-
11
Multiply by the dilution factor (23).
-
12
Multiply by 1000 to get to ‘nmol’.
-
13
The resulting number will give the specific activity of GPx in units of ‘nmol/min/mg protein’.
3. Results
3.1. Glutathione concentrations
The typical outcome of the TGSH assay is presented in Figure 2 (the standards and samples are presented in separate panels for convenience). The Figure shows the change in absorbance over time for standards (Fig. 2A) and samples (Fig. 2C). The Vmax values corresponding to the linear region (Fig. 2B, D) can then be used to calculate the standard curve and deduce TGSH concentrations in the samples. To generate a standard curve, plot the Vmax values versus concentration for each standard (Fig. 3A). Use the equation to calculate the concentration of the samples. In this example the corresponding TGSH concentrations for samples 1–3 are 23.5, 24.0, and 21.1 μM. To convert these concentrations into units of fmol/larva, multiply by 0.0002 L, divide by 15 larvae, and multiply twice by 1000. The corresponding TGSH concentrations for samples 1–3 are 314.0, 320.4, and 281.9 fmol/larva.
Figure 2.

Summary of TGSH assay. A, C. Change in absorbance during a 20-minute period for standards (A) and samples (C). The dotted lines represent the linear range of the curves. B, D. Change in absorbance in the linear range for standards (B) and samples (D). The numbers to the right of the lines represent Vmax (mOD/min) and R2 values, respectively.
Figure 3.

Standard curves for TGSH (A) and GSSG (B). The equations and the R2 values are presented in the top left corner.
The typical outcome of the GSSG assay is presented in Figure 4 (the standards and samples are presented in separate panels for convenience). The Figure shows the change in absorbance over time for standards (Fig. 4A) and samples (Fig. 4C). The Vmax values corresponding to the linear region (Fig. 4B, D) are then used to calculate the standard curve and deduce GSSG concentrations in the samples. To generate a standard curve plot the Vmax values versus concentration for each standard (Fig. 3B). Use the equation to calculate the concentration of the samples. In this example the corresponding GSSG concentrations for samples 1–3 are 0.28, 0.28, and 0.23 μM; applying the aforementioned unit conversion results in GSSG concentrations of 3.7, 3.7, and 3.0 fmol/larva for samples 1–3.
Figure 4.

Summary of GSSG assay. A, C. Change in absorbance during a 20-minute period for standards (A) and samples (C). The dotted lines represent the linear range of the curves. B, D. Change in absorbance in the linear range for standards (B) and samples (D). The numbers to the right of the lines represent Vmax (mOD/min) and R2 values, respectively.
The GSH concentrations and GSSG:TGSH ratios can be calculated for additional information. GSH concentration is given by the equation (GSH = TGSH - 2GSSG). Thus, the corresponding GSH concentrations for samples 1–3 are 313.0, 306.6, and 275.8 fmol/larva. The GSSG:TGSH ratios are calculated by dividing the GSSG by TGSH. In the current example the corresponding ratios for samples 1–3 are 0.012, 0.012, and 0.011.
3.2. Glutathione reductase activity
The typical outcome of GR assay is presented in Figure 5A. The Figure shows the change in absorbance over time for the blank and samples. The Vmax values corresponding to the linear region (Fig. 5B) can then be used to calculate the enzyme activity as outlined in section 2.4.4. In the current example, the samples’ Vmax values of 2.00–2.40 translate into specific activities of 5.1–6.9 nmol/min/mg protein (path length ~0.56; protein concentration ~1.4 mg/mL).
Figure 5.

Summary of GR and GPx assays. A, C. Change in absorbance for GR (A) and GPx (C). The dotted lines represent the linear range of the curves. B, D. Change in absorbance in the linear range for GR (B) and GPx (D). The numbers to the right of the lines represent Vmax (mOD/min) and R2 values, respectively.
3.3. Glutathione peroxidase activity
The typical outcome of GPx assay is presented in Figure 5C. The Vmax values corresponding to the linear region (Fig. 5D) can then be used to calculate the enzyme activity as outlined in section 2.5.4. In the current example, the samples’ Vmax values of 29.2–31.0 translate into specific activities of 9.9–18.4 nmol/min/mg protein (path length ~0.60; protein concentration ~1.4 mg/mL).
4. Discussion
This manuscript aims to outline the assays that can be easily employed to measure the concentrations of GSH, GSSG, as a well as the activities of GR and GPx in zebrafish larvae. These cost-effective assays are adapted to a 96-well plate format, allowing for multiple samples to be run simultaneously. The following paragraphs summarize some of the studies that assessed these endpoints in zebrafish. Other methods to assess the aforementioned endpoints are also discussed, in order to further demonstrate the ease and cost-effectiveness of the methods described herein.
GSH is the most abundant antioxidant and is a commonly reported endpoint in zebrafish when assessing oxidative stress. Typically upon induction of oxidative stress, the concentration of GSH decreases. GSH concentration in zebrafish has been shown to decrease in response to arsenic, atrazine (Adeyemi et al., 2015), cadmium, chromium (Jin et al., 2015a), cadmium sulfate, α-naphthoflavone (Yin et al., 2014), chlorpyrifos (Jin et al., 2015b), PCB 126 (Liu et al., 2015), silver nanoparticles (Massarsky et al., 2013), titanium dioxide nanoparticles (Faria et al., 2014), bisphenol A, nonylphenol (Wu et al., 2011), selenomethionine (Arnold et al., 2016), and ion radiation (Si et al., 2013). The decrease in GSH supports its utilization to neutralize ROS; however, not all exposures result in GSH decrease. For example, exposure to antidepressant amitriptyline resulted in a U-shape response, such that lower concentrations decreased GSH concentration, while higher concentrations increased GSH concentration (Yang et al., 2014). Exposures to bacterial lipopolysaccharides (Jaja-Chimedza et al., 2012) and total particulate matter from cigarette smoke (Massarsky et al., 2015) also appeared to elevate GSH, while exposures to β-naphthoflavone and α-naphthoflavone (Timme-Laragy et al., 2009) did not significantly affect GSH concentrations.
Generally, the utilization of GSH to neutralize ROS leads to increased concentration of GSSG. Interestingly, GSSG concentration is reported less frequently. Among the aforementioned studies that assessed GSH, only a few assessed GSSG. In the studies reporting decreased GSH concentration, the concentration of GSSG was increased (Liu et al., 2015 - PCB 126), not significantly affected (Massarsky et al., 2013 – silver nanoparticles; Arnold et al., 2016 – selenomethionine), or decreased (Wu et al., 2011 - bisphenol A and nonylphenol). In the studies reporting increased GSH concentration, the concentration of GSSG was not significantly affected (Jaja-Chimedza et al., 2012 - bacterial lipopolysaccharides) or increased (Massarsky et al., 2015 – total particulate matter). It is noteworthy that the methods described herein allow for the concentrations of GSH and GSSG to be derived from the same sample, which is efficient in terms of cost, reagents, and time.
Additionally, assessment of both GSH and GSSG enables the calculation of the redox status (i.e the ratio of GSSH to GSH), which is traditionally reported as a biomarker of oxidative stress in both human and rodent studies (e.g. Sentellas et al., 2014). Specifically, oxidative stress induction is supported by an increased ratio of GSSG to TGSH (or GSH), or a decreased ratio of TGSH (or GSH) to GSSG. While only four of the aforementioned zebrafish studies reported the ratios, the ratios supported the induction of oxidative stress in all four studies by Arnold et al. (2016), Jaja-Chimedza et al. (2012), and Massarsky et al. (2013; 2015). Notably, the studies by Massarsky et al. (2013; 2015) and Arnold et al. (2016) used the methods described in the present manuscript. This further validates zebrafish as a model organism for oxidative stress studies.
The contrast in GSH and GSSG responses to toxic agents that are suspected inducers of oxidative stress points to the complex dynamics of the glutathione system and early development. Indeed, the role of GSH in early development is yet to be fully understood. Timme-Laragy et al. (2013) reported that several notable changes in GSH and GSSG concentrations occur during embryonic development and that these changes correspond to major developmental effects. The GSH dynamics are important for the maintenance of the redox homeostasis, and suggest that there are critical time periods when embryos could be susceptible to redox perturbations. The authors also identified a set of 34 genes for glutathione synthesis, recycling, and utilization. The expression of these genes over the course of embryos development corresponds to GSH redox dynamics, and supports the hypothesis that the GSH system is tightly regulated during early development (Timme-Laragy et al., 2013). The complexity of the GSH system could explain the variation in GSH responses that were noted in the aforementioned studies, since the start and duration of exposures were not identical. Although induction of oxidative stress is common to many toxic agents, there are often additional mechanisms/effects that could directly or indirectly impact development and/or GSH redox dynamics. It is also important to remember that this is a dynamic system that simultaneously regulates synthesis, utilization, and recycling, and these processes could be also directly/indirectly impacted. Lastly, GSH is an important substrate of glutathione-s-transferase (GST), an important enzyme within phase II xenobiotic metabolism. Therefore, decreases in GSH could also be attributed to induction of phase II metabolism to render certain chemicals more water-soluble.
In addition to glutathione concentrations, the activities of GR and GPx can be assessed to further support the induction of oxidative stress. The activity of GR is expected to increase with oxidative stress in order to recycle the generated GSSG. The activity of GR was increased when zebrafish were exposed to various toxicants, including zinc oxide nanoparticles (Zhao et al., 2013), di-n-butyl phthalate and diethyl phthalate (Xu et al., 2013), and total particulate matter (Massarsky et al., 2015). Some studies reported no significant difference in GR activity when zebrafish were exposed to cyanobacterial lipopolysaccharides (Jaja-Chimedza et al., 2012) and silver nanoparticles (Massarsky et al., 2013). GR activity has also been shown to decrease. For example, zebrafish exposed to bisphenol A and nonylphenol had significantly lower GR activity (Wu et al., 2011), whereas zebrafish exposed to amitriptyline showed decreased GR activity at lower concentrations and increased activity at the higher concentrations (Yang et al., 2014).
The activity of GPx is also expected to increase under conditions of oxidative stress. Among the aforementioned studies, GPx activity was shown to increase in response to bacterial lipopolysaccharides (Jaja-Chimedza et al., 2012). No significant differences in GPx activity were reported for arsenic or atrazine (Adeyemi et al., 2015), silver nanoparticles (Massarsky et al., 2013), and total particulate matter (Massarsky et al., 2015). And three studies reported decreased GPx activity when zebrafish were exposed to cadmium, chromium (Jin et al., 2015a), chlorpyrifos (Jin et al., 2015b), bisphenol A, and nonylphenol (Wu et al., 2011).
Although various responses in GR/GPx activities are reported, it is important to remember that these are not the only antioxidant enzymes that the vertebrates possess. There are several other important antioxidant enzymes that were not discussed here (e.g. superoxide dismutase, catalase) that are helping the organisms to neutralize ROS. Also, GSH can act independently of GPx to neutralize ROS, therefore changes in GSH could occur independently of GPx activity.
Moreover, the variation in the antioxidant responses to some extent can be explained by different intensity of oxidative stress. It is important to note that ROS may induce biosynthesis of antioxidant enzymes and GSH, in order to increase the antioxidant capacity; however, higher ROS levels may lead to inactivation of antioxidant enzymes. A recent review discusses an intensity-based classification of oxidative stress. Basal oxidative stress (BOS) refers to negligible ROS production (i.e. cannot be measured with current methods) that is successfully dealt with by the antioxidant system. Higher ROS production (can be measured) can lead to low intensity oxidative stress (LOS), which is characterized by increased levels of oxidatively-modified components (e.g. increased concentrations of GSSG) and increased levels of ROS-induced ROS-sensitive parameter (e.g. increased activities of GPx, GR). Subsequent increase in ROS production can result in intermediate intensity oxidative stress (IOS), characterized by a further increase in oxidatively-modified components, but a decrease in ROS-induced ROS-sensitive parameter due to enzyme inactivation. Finally, high intensity oxidative stress (HOS) represents a scenario of really high ROS production that results in oxidation of all potential substrates (e.g. GSH depletion) and inactivation of antioxidant enzymes (Lushchak, 2014). Thus, the antioxidant response is dependent on the intensity of oxidative stress, which implies that the activities of antioxidant enzymes could either increase (LOS), not change (transition between LOS and IOS), or even decrease (IOS and HOS). These intensities can potentially be differentiated by using a dose response curve.
Lastly, we thought that it would be worthwhile to briefly discuss some of the other methods to assess the concentrations of GSH and GSSG and activities of GPx and GR. GSH and GSSG concentrations can also be evaluated using commercially available kits from Cayman Chemical Company (Ann Arbor, MI) as in Jaja-Chimedza et al. (2012), Beyotime Institute of Biotechnology (Nantong, China) as in Yin et al. (2014), as well as Nanjing Jiancheng Bioengineering Institute (Nanjing, China) as in Jin et al. (2015a), Jin et al. (2015b), Liu et al. (2015), Si et al. (2013), Wu et al. (2011), and Yang et al. (2014). Several kits are also available through Sigma-Aldrich (St. Louis, MO); however, to the best of our knowledge, these are yet to be used with zebrafish. While commercially available kits are similarly simple and high-throughput, the methods presented herein are more cost-effective, since most of the ingredients are readily found in most labs.
Additionally, glutathione concentrations can be quantified by reverse-phase HPLC with fluorescence detection using γ-glutamylglutamate as an internal standard as in Timme-Laragy et al. (2013). While HPLC represents a gold standard analytical method, providing a highly accurate and direct measurement of the analytes, as well as allowing for calculation of redox potential of the samples, HPLC is extremely cost and time-intensive. Thus, the methods presented herein represent a desirable alternative, particularly when relative measurements between treatment groups are more important than absolute levels
Activities of GPx and GR can also be evaluated using commercially available kits from Sigma-Alrich (St. Louis, MO) as in Jaja-Chimedza et al. (2012), as well as Nanjing Jiancheng Bioengineering Institute (Nanjing, China) as in Wu et al. (2011), Xu et al. 2013, Yang et al. 2014, Jin et al. (2015a), and Jin et al. (2015b). While commercially available kits are similarly easy to use and high-throughput, the methods presented herein are more cost-effective per sample, since most of the ingredients are routinely used in most labs. Notably, gene expression related to antioxidant enzyme activity, measured by qRT-PCR analysis, is often presented in addition to activity results as in Yang et al. (2014), Jin et al. (2015a), and Jin et al. (2015b). While gene expression may serve to validate activity results as well as provide additional mechanistic information, gene expression is a transitionary signature of the oxidative stress phenotype, and the results may be confounded by natural oscillations in gene expression patterns.
In summary, many xenobiotic agents are able to induce oxidative stress, potentially overwhelming the organism’s antioxidant defense system, and resulting in damage to proteins, lipids, and genetic material. Across the various piscine models, the zebrafish is a valuable vertebrate model of choice to study toxicity of various xenobiotic agents. Similarly to other vertebrates, zebrafish possess an extensive antioxidant system, and GSH is one of the main antioxidants that acts as an independent antioxidant or in conjunction with enzymes, such as GPx. GSH is oxidized into GSSG upon interaction with ROS, and an auxiliary antioxidant enzyme GR converts GSSG back into GSH. Given the importance of glutathione, GPx, and GR, this manuscript outlined detailed methods for measuring these endpoints and provided a brief discussion of the studies that assessed these endpoints in zebrafish. We conclude that the availability of these robust and economical methods supports the use of zebrafish as a model organism in studies evaluating redox biology, as well as the induction of oxidative stress following exposure to toxic agents.
Acknowledgments
The authors thank members of the Di Giulio lab (the image in Figure 1 is courtesy of Dr. R. Trevisan). This study was supported by RJR-Leon Golberg Fellowship (A. Massarsky), as well as Duke’s Superfund Research Center (NIEHS P42-ES010356) and Duke’s Program in Environmental Health (ITEHP) Training grant (NIEHS T32-ES021432) (J.S. Kozal).
References
- Adeyemi JA, Martins AdC, Junior, Barbosa F., Jr Teratogenicity, genotoxicity and oxidative stress in zebrafish embryos (Danio rerio) co-exposed to arsenic and atrazine. Comp Biochem Physiol C. 2015;172–173:7–12. doi: 10.1016/j.cbpc.2015.04.001. [DOI] [PubMed] [Google Scholar]
- Arnold MC, Forte JE, Osterberg JS, Di Giulio RT. Antioxidant rescue of selenomethionine-induced teratogenesis in zebrafish embryos. Arch Environ Toxicol. 2016;70:311–320. doi: 10.1007/s00244-015-0235-7. [DOI] [PMC free article] [PubMed] [Google Scholar]
- Davies KJA. Oxidative stress: the paradox of aerobic life. Biochem Soc Symp. 1995;61:1–31. doi: 10.1042/bss0610001. [DOI] [PubMed] [Google Scholar]
- Davies KJA. Oxidative stress, antioxidant defenses, and damage removal, repair, and replacement systems. IUBMB Life. 2000;50:279–289. doi: 10.1080/713803728. [DOI] [PubMed] [Google Scholar]
- Di Giulio RT, Meyer JN. Reactive oxygen species and oxidative stress. In: Di Giulio RT, Hinton DE, editors. The toxicology of fishes. CRC Press, Taylor & Francis Group; Boca Raton, FL, USA: 2008. pp. 273–324. [Google Scholar]
- Fako V, Furgeson D. Zebrafish as a correlative and predictive model for assessing biomaterial nanotoxicity. Adv Drug Deliver Rev. 2009;61:478–486. doi: 10.1016/j.addr.2009.03.008. [DOI] [PubMed] [Google Scholar]
- Faria M, Navas JM, Soares AMVM, Barata C. Oxidative stress effects of titanium dioxide aggregates in zebrafish embryos. Sci Tot Environ. 2014;470–471:379–389. doi: 10.1016/j.scitotenv.2013.09.055. [DOI] [PubMed] [Google Scholar]
- Griffith OW. Determination of glutathione and glutathione disulfide using glutathione reductase and 2-vinylpyridine. Anal Biochem. 1980;106:207–212. doi: 10.1016/0003-2697(80)90139-6. [DOI] [PubMed] [Google Scholar]
- Hermes-Lima M. Oxygen in biology and biochemistry: role of free radicals. In: Storey KB, editor. Functional Metabolism: Regulation Adaptation. John Wiley & Sons, Inc; Hoboken, NJ, USA: 2005. pp. 319–368. [DOI] [Google Scholar]
- Hill AJ, Teraoka H, Heidman W, Peterson RE. Zebrafish as a model vertebrate for investigating chemical toxicity. Toxicol Sci. 2005;86:6–19. doi: 10.1093/toxsci/kfi110. [DOI] [PubMed] [Google Scholar]
- Jaja-Chimedza A, Gantar M, Mayer GD, Gibbs PDL, Berry JP. Effects of cyanobacterial lipopolysaccharides from Microcystis on glutathione-based detoxification pathways in the zebrafish (Danio rerio) embryo. Toxins. 2012;4:390–404. doi: 10.3390/toxins4060390. [DOI] [PMC free article] [PubMed] [Google Scholar]
- Jin Y, Liu Z, Liu F, Ye Y, Peng T, Fu Z. Embryonic exposure to cadmium (II) and chromium (VI) induce behavioral alterations, oxidative stress and immunotoxicity in zebrafish (Danio rerio) Neurotoxicol Teratol. 2015a;48:9–17. doi: 10.1016/j.ntt.2015.01.002. [DOI] [PubMed] [Google Scholar]
- Jin Y, Liu Z, Peng T, Fu Z. The toxicity of chlorpyrifos on the early life stage of zebrafish: a survey on the endpoints at development, locomotor behavior, oxidative stress and immunotoxicity. Fish Shellfish Immunol. 2015b;43:405–414. doi: 10.1016/j.fsi.2015.01.010. [DOI] [PubMed] [Google Scholar]
- Kelly SA, Havrilla CM, Brady TC, Harris Abramo K, Levin ED. Oxidative stress in toxicology: established mammalian and emerging piscine model systems. Environ Health Perspect. 1998;106:375–384. doi: 10.1289/ehp.98106375. [DOI] [PMC free article] [PubMed] [Google Scholar]
- Lieschke GJ, Currie PD. Animal models of human disease: zebrafish swim into view. Nature. 2007;8:353–367. doi: 10.1038/nrg2091. [DOI] [PubMed] [Google Scholar]
- Liu H, Gooneratne R, Huang X, Lai R, Wei J, Wang W. A rapid in vivo zebrafish model to elucidate oxidative stress-mediated PCB126-induced apoptosis and developmental toxicity. Free Radical Biol Med. 2015;84:91–102. doi: 10.1016/j.freeradbiomed.2015.03.002. [DOI] [PubMed] [Google Scholar]
- Lushchak VI. Free radicals, reactive oxygen species, oxidative stress and its classification. Chem Biol Interact. 2014;224:164–75. doi: 10.1016/j.cbi.2014.10.016. [DOI] [PubMed] [Google Scholar]
- Mannervik B. The enzymes of glutathione metabolism: an overview. Biochem Soc Trans. 1987;15:717–718. doi: 10.1042/bst0150717. [DOI] [PubMed] [Google Scholar]
- Massarsky A, Dupuis L, Taylor J, Eisa-Beygi S, Strek L, Trudeau VL, Moon TW. Assessment of nanosilver toxicity during zebrafish (Danio rerio) development. Chemosphere. 2013;92:59–66. doi: 10.1016/j.chemosphere.2013.02.060. [DOI] [PubMed] [Google Scholar]
- Massarsky A, Jayasundara N, Bailey JM, Oliveri AN, Levin ED, Prasad GL, Di Giulio RT. Teratogenic, bioenergetic, and behavioral effects of exposure to total particulate matter on early development of zebrafish (Danio rerio) are not mimicked by nicotine. Neurotoxicol Teratol. 2015;51:77–88. doi: 10.1016/j.ntt.2015.09.006. [DOI] [PMC free article] [PubMed] [Google Scholar]
- Racker E. Glutathione reductase from bakers’ yeast and beef liver. J Biol Chem. 1955;217:855–865. [PubMed] [Google Scholar]
- Sentellas S, Morales-Ibanez O, Zanuy M, Albertí JJ. GSSG/GSH ratios in cryopreserved rat and human hepatocytes as a biomarker for drug induced oxidative stress. Toxicol In Vitro. 2014;28:1006–1015. doi: 10.1016/j.tiv.2014.04.017. [DOI] [PubMed] [Google Scholar]
- Si J, Zhang H, Wang Z, Wu Z, Lu J, Di C, Zhou X, Wang X. Effects of 12C6+ ion radiation and ferulic acid on the zebrafish (Danio rerio) embryonic oxidative stress response and gene expression. Mut Res. 2013;745–746:26–33. doi: 10.1016/j.mrfmmm.2013.03.007. [DOI] [PubMed] [Google Scholar]
- Sies H, Jones D. Oxidative stress. In: Fink G, editor. Encyclopedia of stress. 2. Elsevier; Amsterdam, Netherlands: 2007. pp. 45–48. [Google Scholar]
- Strauss RS, Synder EL, Wallace PD, Rosenberger TG. Oxygen detoxifying enzymes in neutrophils of infants and their mothers. J Lab Clin Invest. 1980;95:897–904. [PubMed] [Google Scholar]
- Timme-Laragy AR, Van Tiem LA, Linney EA, Di Giulio RT. Antioxidant responses and NRF2 in synergistic developmental toxicity of PAHs in zebrafish. Toxicol Sci. 2009;109:217–227. doi: 10.1093/toxsci/kfp038. [DOI] [PMC free article] [PubMed] [Google Scholar]
- Timme-Laragy AR, Goldstone JV, Imhoff BR, Stegeman JJ, Hahn ME, Hansen JM. Glutathione redox dynamics and expression of glutathione-related genes in the developing embryo. Free Radical Biol Med. 2013;65:89–101. doi: 10.1016/j.freeradbiomed.2013.06.011. [DOI] [PMC free article] [PubMed] [Google Scholar]
- Wu M, Xu H, Shen Y, Qiu W, Yang M. Oxidative stress in zebrafish embryos induced by short-term exposure to bisphenol A, nonylphenol, and their mixture. Environ Toxicol Chem. 2011;30:2335–2341. doi: 10.1002/etc.634. [DOI] [PubMed] [Google Scholar]
- Xu H, Shao X, Zhang Z, Zou Y, Wu X, Yang L. Oxidative stress and immune related gene expression following exposure to di-n-butyl phthalate and diethyl phthalate in zebrafish embryos. Ecotoxicol Environ Saf. 2013;93:39–44. doi: 10.1016/j.ecoenv.2013.03.038. [DOI] [PubMed] [Google Scholar]
- Yang L, Ho NY, Alshut R, Legradi J, Weiss C, Reischi M, Mikut R, Liebel U, Müller F, Strähle U. Zebrafish embryos as models for embryotoxic and teratological effects of chemicals. Reprod Toxicol. 2009;28:245–253. doi: 10.1016/j.reprotox.2009.04.013. [DOI] [PubMed] [Google Scholar]
- Yang M, Qiu W, Chen J, Zhan J, Pan C, Lei X, Wu M. Growth inhibition and coordinated physiological regulation of zebrafish (Danio rerio) embryos upon sublethal exposure to antidepressant amitriptyline. Aquat Toxicol. 2014;151:68–76. doi: 10.1016/j.aquatox.2013.12.029. [DOI] [PubMed] [Google Scholar]
- Yin J, Yang J-m, Zhang F, Miao P, Lin Y, Chen M-l. Individual and joint toxic effects of cadmium sulfate and a-naphthoflavone on the development of zebrafish embryo. Biomed Biotechnol. 2014;15:766–775. doi: 10.1631/jzus.B1400091. [DOI] [PMC free article] [PubMed] [Google Scholar]
- Zhao X, Wang S, Wu Y, You H, Lv L. Acute ZnO nanoparticles exposure induces developmental toxicity, oxidative stress and DNA damage in embryo-larval zebrafish. Aquat Toxicol. 2013;136–137:49–59. doi: 10.1016/j.aquatox.2013.03.019. [DOI] [PubMed] [Google Scholar]