

Abstract
Objective
To identify distinct body mass index (BMI) percentile trajectories during early childhood and examine adiposity levels in childhood and early adulthood according to the BMI percentile trajectories.
Methods
Iowa Fluoride Study cohort parents (n=1,093) reported their child’s anthropometric data on average six times between age 0 and 23 months. A subset of the cohort underwent DXA scans at approximately age 8 years (n=495) and again at approximately age 19 years (n=314). Group-based trajectory analysis was conducted to identify distinct BMI percentile trajectories from age 0–23 months. Sex-specific age-adjusted linear regression analyses were conducted to compare fat mass index (FMI) in childhood and early adulthood among subgroups that follow the distinct BMI percentile patterns.
Results
Four BMI percentile patterns were identified: consistently-low (Group1: 9.8%), increase-in-the-second-year (Group2: 33.7%), increase-in-the-first-year (Group3: 23.9%), and consistently-high (Group4: 32.6%). Compared to Group2 females, Groups 3 and 4 females had higher FMI in childhood and early adulthood (P<0.05). However, no significant difference was found in males.
Conclusion
Females who experiences a steep increase of BMI percentile in the first year of life, as opposed to a steep increase in the second year of life, may have higher body fat later in life, but not for males.
Keywords: group-based trajectory analysis, fat mass index, obesity, infants, youth, DXA
Introduction
The prevalence of obesity has increased substantially in the United States over the past few decades.1 Numerous studies have consistently demonstrated that excessive weight gain during infancy and early childhood (birth to 24 months) persists over time.2–8 This suggests that early childhood is critical in the development of obesity later in life (“early programming” of obesity and related behaviors).7,9 The “early programming” hypothesis posits that a stimulus or insult experienced during a critical period of development causes permanent alterations in the development and organization of key tissues and organ systems that lead to irreversible changes in the structure and function of the body.10 Several studies have provided supportive data for the link between more rapid weight gain in infancy and an increased risk of developing obesity in later life.11–22 However, there are knowledge gaps that limit our insight regarding this link. First, most studies have used body mass index (BMI) as an adiposity measure later in life. However, BMI is not measure of adiposity, but a measure of weight that is adjusted for height.23–25 Second, although weight gain trajectory patterns during early childhood may be heterogeneous, most studies have only used analytic approaches (e.g., correlation coefficients or regression analysis for the whole study population) that assume homogeneity of the study population. Therefore, the methodologic advantage of using an accurate adiposity measure along with an analytic approach that recognizes the heterogeneity of the study population will help to improve our understanding of the impact of growth patterns during early life on adiposity development in later life. A group-based trajectory approach offers an empirical method to identify subgroups of the study population that follow distinct developmental trajectory patterns. Group-based trajectory modeling enables the data themselves to divide a study population into subgroups that present distinct patterns and to fit its own trajectory models for each of those subgroups.26 Several studies have applied the group-based trajectory approach to identify distinct weight gain patterns.15–21 However, few studies have examined the association between diverse weight gain trajectory patterns in the first two years of life and adiposity levels later in life. As such, the aims of this study were to (1) identify distinct BMI percentile trajectory patterns from birth to age 23 months, using group-based trajectory analysis, (2) examine adiposity levels in preadolescence (approximately age 8 years) according to the BMI percentile trajectory patterns, and (3) examine adiposity levels in early adulthood (approximately age 19 years) according to the BMI percentile trajectory patterns.
Methods
Study Sample
The Iowa Fluoride Study (IFS) is a birth cohort study that was established to examine the role of fluoride in dental health. The IFS recruited 1,882 families with newborns from eight Iowa hospital postpartum wards between 1992 and 1995.27 These eight hospitals were responsible for approximately 20% of all births in Iowa during this time period. Trained part-time recruiters were employed at each hospital, averaging four hours per week of recruitment per hospital. As many eligible patients as possible were invited to participate. Overall, approximately 50% of invited patients agreed to participate. Detailed information on sampling and recruitment of the IFS has been published elsewhere.28 For the current study, babies with <2500 g of birth weight or gestational age < 35 weeks were excluded.
A subset of the IFS cohort is participating in the Iowa Bone Development Study (IBDS), an ongoing cohort study of bone health during childhood through adulthood. IFS members were invited to participate in the IBDS when they were approximately age 5 years. IBDS has repeated assessments every two or three years. The current analysis used data from IBDS participants who completed an assessment at approximately age 8 years and/or at approximately age 19 years. Additional information about the IBDS can be found in previous publications.29 Written informed parent consent and child assent were obtained. The University of Iowa Institutional Review Board (IRB) approved the IBDS.
Measurements
Anthropometric data during early childhood
Child birth length and weight data were obtained from maternal hospital records. Parents reported child length and weight via mail surveys at age 1.5, 3, 6, 9, 12, 16, 20, and 24 months. Because the assessment time points were similar to the child well-visit schedule, parents reported child height and weight data measured during child well-visits if they were available. BMI percentile was used as a measure of weight in early childhood instead of weight-for-age percentile, weight-for-age Z-score, or BMI Z-score, because BMI percentile is a more commonly used indicator of adiposity/obesity among children older than 2 years in U.S. health care settings.
Dual-energy X-ray absorptiometry (DXA) scans in childhood and early adulthood
The IBDS child participants underwent whole body DXA scans at approximately age 8 years between 2000 and 2004, and at approximately 19 years between 2011 and 2015. Participants visited the University of Iowa Clinical Research Center where trained technicians conducted a DXA scan. The standard quality control procedures were performed daily using spine and step phantoms. DXA machines were upgraded over time. At the age 8 assessments, a Hologic QDR2000 model (Hologic Inc., Bedford, MA) was mostly used, while at the age 19 assessments, a Discovery A model was mostly used. An inter-device difference was characterized and quantified and adjustments were made.30,31 The scans were analyzed using the system’s software version 7.20B at the age 8 assessment and APEX software version 4.0/13.4 and National Health and Nutrition Examination Survey (NHANES) body composition assessment algorithms at the age 19 assessment. Total body fat mass was derived from the DXA scan image analysis. Fat mass index (FMI) was calculated as body fat mass divided by the square of height (kg/m2).
Statistical Analysis
Descriptive analyses of demographic characteristics for IFS cohort members were conducted. Excluding incomplete anthropometric survey responses (no height, no weight, or no measurement date), 7,048 complete anthropometric survey responses from 1,346 IFS cohort members were available. BMI percentiles for the 7,048 responses were calculated using the SAS program for the World Health Organization (WHO) Growth Charts, provided by the Centers for Disease Control and Prevention (http://www.cdc.gov/nccdphp/dnpao/growthcharts/resources/sas-who.htm). Of those, 293 responses (1.8%) which had biologically implausible data for weight-for-age, height-for-age, weight-for-height, or BMI-for-age were excluded, resulting in 6,916 valid BMI percentile data points for 1,344 IFS cohort members. Excluding 58 cohort members whose birthweight was less than 2500 g or whose gestational age was less than 35 weeks and 193 cohort members who had < 3 BMI percentile assessments, a total of 1,093 cohort members were included in the group-based trajectory analysis. The criterion of having ≥ 3 data points allowed for the consideration of quadratic trajectory models.
To achieve the first aim of identifying distinct BMI percentile trajectory groups, group-based trajectory analysis was conducted in STATA TRAJ.32 In the process of determining the number of BMI percentile trajectory groups, a quadratic model was initially used for all groups. The number of groups was determined based on the Bayesian Information Criterion, trajectory shapes for similarity, and the proportion of cohort members in each group (≥5%).33 After determining the number of groups, the degree of the polynomial for each group (i.e., quadratic, linear, or constant) was reduced until the parameter estimate for the highest degree polynomial effect had an associated p-value <0.01. Model adequacy was evaluated using four diagnostic measures: average posterior probability of assignment for each group 0.7 or higher; odds of correct classification 5.0 or higher; the proportion of a sample assigned to a certain group close (<3%) to the proportion estimated from the model; and 99% confidence intervals (CIs) for the estimated proportion reasonably narrow.26 Each participant was assigned to the trajectory group that presented the highest posterior probability.
For the second aim, we conducted an analysis of variance (ANOVA) of fat mass and FMI at age 8 years categorized based on the BMI percentile trajectory groups identified in the first aim. Sex-specific age-adjusted linear regression analysis was conducted to predict FMI at age 8 years by the BMI percentile trajectory groups. For the third aim, the analyses were repeated using the outcome of FMI at age 19 years. Additional analyses of BMI as an outcome, in place of FMI, at age 19 years were conducted. All analyses to address aims two and three were performed in SAS 9.4 (Cary, NC). A significance level was set at 0.05.
Results
The group-based trajectory analysis for BMI percentile among 1,093 IFS cohort members identified four distinct patterns of BMI percentile development (Groups 1 to 4; Figure 1). Group 1 had consistently low BMI percentiles over time (9.8% of the study population). Groups 2 and 3 had similar BMI percentiles at birth as well as at age 23 months. Group 2 had a steep increase in the second year of life (33.7%), while Group 3 had a steep increase in the first year of life (23.9%). Group 4 had consistently high BMI percentiles (32.6%). The mean and median of the actual BMI percentile at birth, 12 moths, and 20 months for the four trajectory groups are presented in Supplement Table S1.
Figure 1.
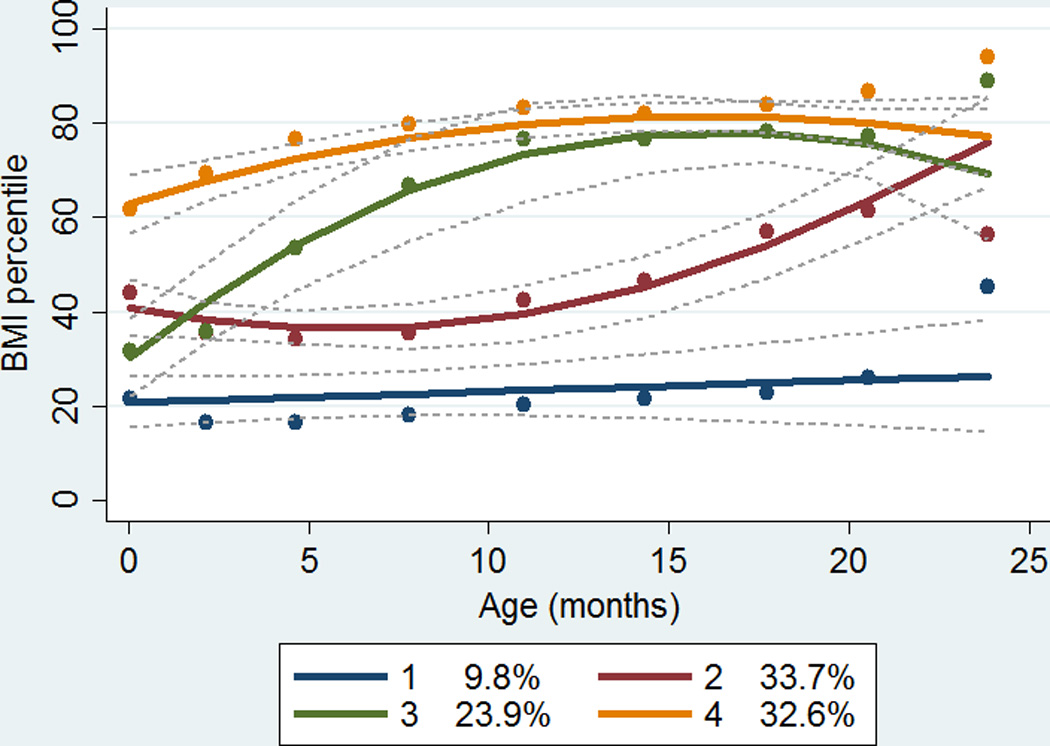
Group-based trajectory analysis of body mass index percentiles from birth to age 23 months among 1,093 Iowa Fluoride Study cohort members
As shown in Table 1, the family sociodemographic characteristics of the IFS cohort members were not significantly different across the trajectory groups. In addition, the average ages of the mother and the father were not significantly different across the trajectory groups (mean age of mothers 28, 29, 29, and 28 years for Groups 1, 2, 3, and 4, respectively; mean age of fathers 31, 32, 31, and 31 years for Groups 1, 2, 3, and 4, respectively).
Table 1.
Characteristics of Iowa Fluoride Study cohort members by early childhood body mass index percentile trajectories
| Total | Trajectory Group 1 |
Trajectory Group 2 |
Trajectory Group 3 |
Trajectory Group 4 |
Chi-square p-value |
|
|---|---|---|---|---|---|---|
| N=1,093 | n=115 | n=409 | n=215 | n=354 | ||
| Total | n (%) | n (%) | n (%) | n (%) | n (%) | -- |
| Child sex | 0.14 | |||||
| Male | 539 (49.3) | 45 (39.1) | 210 (51.3) | 107 (49.8) | 177 (50.0) | |
| Female | 554 (50.7) | 70 (60.9) | 199 (48.7) | 108 (50.2) | 177 (50.0) | |
| Maternal race | 0.62 | |||||
| White | 1,050 (96.3) | 112 (98.2) | 395 (98.6) | 206 (95.8) | 337 (95.7) | |
| Non-White | 40 (3.7) | 2 (1.8) | 14 (3.4) | 9 (4.2) | 15 (4.3) | |
| Maternal 4- year college degree† |
0.48 | |||||
| No | 489 (44.7) | 50 (43.5) | 172 (42.0) | 99 (46.0) | 168 (47.5) | |
| Yes | 604 (55.3) | 65 (56.5) | 237 (58.0) | 116 (54.0) | 186 (52.5) | |
| Annual family income† |
0.60 | |||||
| < $40K | 587 (55.7) | 61 (56.0) | 208 (53.8) | 116 (54.5) | 202 (58.6) | |
| ≥ $40K | 467 (44.3) | 48 (44.0) | 179 (46.2) | 97 (45.5) | 143 (41.4) | |
Assessed between 1992 and 1995.
Trajectory Groups 1 to 4 represent four distinct patterns of body mass index percentile trajectory from birth to age 23 months as shown in Figure 1.
Data for participants with missing data for maternal race (n=3) and for annual family income (n=39) were excluded.
To address the second aim, the subset of 495 of the 1,093 IFS cohort members (45.3%) who completed DXA scans at age 8 years as part of the IBDS (median age of 8.7 years; range of 7.6 to 10.9 years) were included. The 495 participants had similar sociodemographic characteristics to the 598 who did not participate in the IBDS examination at age 8 (Table S2). Of these 495 participants, 10.3% were in Group 1, 37.2% were in Group 2, 18.0% were in Group 3, and 34.5% were in Group 4. FMI at age 8 was significantly different across the four early childhood BMI percentile trajectory groups for both males and females (Table 2). Sex-specific age-adjusted linear regression analysis showed that compared to Group 2, Groups 3 and 4 had significantly higher FMI at age 8 for both males and females (Table 3).
Table 2.
Fat mass and fat mass index at ages 8 and 19 years by early childhood body mass index percentile trajectories.
| Trajectory Group 1 |
Trajectory Group 2 |
Trajectory Group 3 |
Trajectory Group 4 |
ANOVA p- value |
||
|---|---|---|---|---|---|---|
| mean±SD | mean±SD | mean±SD | mean±SD | |||
| Age 8 years | ||||||
| Male (n=239) | ||||||
| Fat mass (kg) | 9.2±4.4 | 8.7±4.5 | 10.8±6.1 | 10.8±5.5 | 0.03 | |
| FMI (kg/m2) | 4.9±1.9 | 4.7±2.0 | 5.7±2.7 | 5.7±2.6 | 0.02 | |
| Female (n=256) | ||||||
| Fat mass (kg) | 8.2±3.0 | 9.4±3.6 | 10.6±4.5 | 12.1±4.9 | <0.01 | |
| FMI (kg/m2) | 4.8±1.6 | 5.2±1.7 | 5.8±2.0 | 6.6±2.4 | <0.01 | |
| Age 19 years | ||||||
| Male (n=138) | ||||||
| Fat mass (kg) | 16.8±7.1 | 20.4±12.0 | 22.4±14.6 | 20.9±9.6 | 0.65 | |
| FMI (kg/m2) | 5.2±1.9 | 6.2±3.5 | 7.0±4.4 | 6.4±3.0 | 0.57 | |
| Female (n=176) | ||||||
| Fat mass (kg) | 21.6±9.4 | 23.5±12.9 | 27.7±11.4 | 28.6±13.4 | 0.04 | |
| FMI (kg/m2) | 7.8±3.2 | 8.5±4.6 | 10.0±4.0 | 10.2±4.5 | 0.04 | |
FMI, fat mass index; SD, standard deviation.
Trajectory Groups 1 to 4 represent four distinct body mass index percentile trajectory patterns from birth to age 23 months as shown in Figure 1.
Table 3.
Multivariable linear regression model of log-transformed fat mass index at ages 8 and 19 years.
| Age 8 | Age 19 | |||||||
|---|---|---|---|---|---|---|---|---|
| Male | Female | Male | Female | |||||
| β±SE | P | β±SE | P | β±SE | P | β±SE | P | |
| Intercept | 1.00±0.30 | <0.01 | 1.45±0.26 | <0.01 | 0.27±0.97 | 0.78 | 0.36±0.87 | 0.68 |
| Age (years) | 0.06±0.03 | 0.11 | 0.02±0.03 | 0.55 | 0.07±0.05 | 0.13 | 0.09±0.04 | 0.05 |
| Trajectory Group 1 |
0.01±0.09 | 0.95 | −0.08±0.06 | 0.22 | −0.14±0.15 | 0.33 | −0.07±0.09 | 0.45 |
| Trajectory Group 2 |
Ref. | Ref. | Ref. | Ref. | Ref. | |||
| Trajectory Group 3 |
0.17±0.07 | 0.01 | 0.11±0.05 | 0.05 | 0.10±0.10 | 0.31 | 0.20±0.09 | 0.02 |
| Trajectory Group 4 |
0.18±0.05 | <0.01 | 0.23±0.05 | <0.01 | 0.05±0.08 | 0.52 | 0.20±0.07 | <0.01 |
β, parameter estimate; P, p-value associated with the parameter; Ref., Reference; SE, standard error.
Trajectory Groups 1 to 4 represent four distinct body mass index percentile trajectory patterns from birth to age 23 months as shown in Figure 1.
In the analysis of the third aim, 314 of the 1,093 IFS cohort members (28.7%) who completed DXA scans at age 19 years (median age of 19.7 years; range of 18.6 to 22.1 years) were included. The 314 participants had similar baseline sociodemographic characteristics to the 779 who did not participate in the IBDS examination at age 19 (Table S3). Of the 314 cohort members, 10.8% were in Group 1, 36.9% were in Group 2, 16.9% were in Group 3, and 35.4% were in Group 4. ANOVA showed that FMI at age 19 was significantly different across the four early childhood BMI percentile trajectory groups among females, but no among males (Table 2). A sex-specific age-adjusted linear regression analysis showed that compared to Group 2, Group 3 and Group 4 had significantly higher FMI at age 19 years for females, but not for males (Table 3). Additional linear regression analyses of BMI at age 19 years revealed consistent results with the FMI analysis.
Discussion
Using group-based trajectory analysis, this study identified four distinct growth trajectory patterns (Groups 1 to 4) during early childhood among this U.S. (mostly) Caucasian population. Group 1 presented a consistently low BMI percentile pattern, whereas Group 4 presented a consistently high BMI percentile pattern. Groups 2 and 3 presented similar levels of BMI percentiles at birth as well as at age 23 months. The distinct difference of the two Groups was the timing of a BMI percentile increase. Group 2 maintained a BMI percentile level in the first years of life, but increased it in the second year of life. Group 3 had a steep increase of BMI percentile in the first year of life. Compared to females in Group 2, females in Group 3 had higher body fat both in childhood and in early adulthood. But, this was not observed among males. As expected, Group 4 presented the highest FMI both in childhood and in early adulthood among females, but not among males. These findings suggest that a female who experiences a substantial increase of BMI percentile in the first year of life or consistently high BMI percentiles in early childhood may have higher adiposity accumulation later in life, but a male who experiences the same progression may not go on to have higher adiposity accumulation.
Our finding of the gender difference suggests that growth patterns established in early childhood may be more persistent among females than males. The gender difference may be partly due to the gender difference in sport participation throughout childhood and adolescence, given that in exploratory analyses, boys in Group 4 were more likely to follow a consistent sport participation pattern than boys in Group 2 (Groups 2 vs. 4: 46% vs. 54% for the consistent sport participation pattern), while girls in Group 4 were less likely to follow a consistent sport participation pattern (Groups 2 vs. 4: 52% vs. 47% for the consistent sport participation pattern).29 Further research is warranted to expalin the potential gender difference.
Quadri et al.34 reported five distinct BMI percentile trajectory patterns from birth to age 23 months, using anthropometric data collected during child-well visits among 692 pediatric patients, the majority of which were Hispanic or Black. Two trajectory groups started with a lower BMI percentile at birth, but one substantially increased their BMI percentile (17.0% of the study population), while the other maintained a lower BMI percentile over time (15.9%). The other two trajectory groups started with a middle-range BMI percentile at birth, but one slighted increased their BMI percentile (27.9%), while the other slightly decreased their BMI percentile (16.5%). The last trajectory group represented a pattern of consistently higher BMI percentiles from birth to age 23 months (22.6%). Although the current study did not identify one of the Quadri’s patterns that presented low BMI percentile at birth and a steep increase of BMI percentile, the other four patterns identified by Quadri seem to share the same four patterns identified by our study. The difference could be partly due to the fact that the current study excluded babies with low birth weight or prematurity who tend to have low birth weight but substantially increase weight in early childhood.
Mebrahtu et al.35 reported three distinct trajectory patterns of a weight-for-age Z-score over the first three years of life among 1,364 white and Pakistani British participants. In their analysis, most participants (95.9%) took on the “normal grower” pattern, where weight-for-age Z score was close to zero throughout. Of the other two patterns with a lower weight-for-age Z- score at birth, one showed an increasing trend of weight-for-age Z score before age 1 year (2.5%), while the other showed a decreasing trend (1.6%). Before comparing the trajectory analysis results, it is important to note the difference in the criteria used to determine the number of trajectory groups between Mebrahtu’s study and our current study. The current study was restricted to including independent trajectory patterns that could represent at least 5% of the study population. While identifying a trajectory pattern that represents <3% of the population may or may not be meaningful depending on the purpose of the study, it is difficult to evaluate whether the trajectory pattern is significantly different from other trajectory patterns without the presentation of 95% confidence intervals for estimated trajectory models. Although it is exciting to apply an innovative analytic method that recognizes the heterogeneity of the development of human biology and behaviors, the model determination process and results presentation for the most appropriate and meaningful use of group-based trajectory analysis has yet to be standardized. In trajectory analysis result comparisons, in addition to the difference in the distribution into identified trajectory patterns, the current study identified a pattern that had consistently higher BMI percentiles, which was not identified by Mebrahtu. This could be partly explained by the fact that the majority of the British cohort was of Pakistani origin, who tend to be leaner in early childhood.
Giles et al.16 reported four distinct BMI Z-score trajectories from birth to age 3 years among 557 Australian participants. These four trajectory groups, which were characterized by birth size and postnatal growth in the first six months of life, were labelled as “low” (lower BMI Z-score at birth and substantial decrease until six months), “intermediate” (lower BMI Z-score at birth and slight decrease until six months), “high” (higher BMI Z-score at birth and maintenance until six months) and “accelerating” (higher BMI Z-score at birth and increase until six months). Between age six months and 3 years, all trajectory groups maintained the BMI Z-score. The subsequent analysis for the association between the four trajectory groups and BMI Z-score at age 9 showed a dose-response relationship (the “low” group had the lowest mean BMI Z-score, and the “accelerating” group had the highest mean BMI Z-score). The main difference related to the identified trajectories in Giles study and the current study is that our findings suggest that sex- and age-adjusted BMI Z-score is somewhat unstable over the first two years of life (which made the trajectory patterns more diverse and distinct), while in Giles’ study population, the sex- and age-adjusted BMI Z-score at birth seemed to be more stable over time until age 3 years and even at age 9 years. When the rank is stable, it is questionable whether the study population can be seen as heterogeneous in growth trajectory, and thus whether a group-based trajectory approach adds further insight to the understanding of early childhood growth, beyond the traditional linear regression approach.
Although the current study did not focus on understanding the characteristics of the subpopulations that represent distinct growth trajectories, this understanding is important to develop intervention strategies. Pre- and perinatal factors, such as maternal weight, gestational diabetes, and prenatal smoking exposure have been shown to be strong predictors of BMI percentile in early childhood.36,37 Genome-wide association studies have identified a novel locus that predicts BMI trajectories during childhood.13 To identify effective obesity prevention strategies that can be implemented during early childhood, parenting styles and feeding practices have also been investigated.38 However, a large knowledge gap still exists in our understanding of early childhood factors that influence the development of obesity and obesogenic behaviors and, as such, further research is warranted.
Several limitations of this study should be acknowledged. First, we relied on parental report of height and weight data during early childhood, which could have resulted in measurement error. However, our additional analysis showed that parent-reported vs. measured BMIs at ages 8, 11, and 13 assessments were highly correlated (Pearson r = 0.95 to 0.97). Second, because a group-based trajectory model assumes that missing data are random, nonrandom missing data could have biased the study findings. Third, IFS cohort members who were not included in the regression analyses may have had different associations between the early childhood BMI percentile trajectories and later FMI compared to the IFS cohort members who were included. Thus, the estimated association could be biased. Fourth, because a majority of the IFS cohort members were Caucasian and came from families with college-educated mothers, the results should be generalizable with caution to other populations. Lastly, because the BMI percentile trajectory group membership was determined based on estimated probabilities from the maximum likelihood analysis that does not account for uncertainty in group classification, it is prone to classification error of the group.39 However, we used this method because the posterior probability-based classification provides a straightforward basis for producing profiles of trajectory members and an easy and transparent communication of the findings.26
Despite these limitations, this study has important strengths. This study used DXA-derived fat mass outcome data, which is accepted as a gold standard of adiposity measurement. This study also applied an innovative analytic approach, group-based trajectory analysis, to identify heterogeneous developmental trajectories of BMI percentiles during early childhood.
Conclusion
The findings from this study suggest that females who experiences a substantial increase of BMI percentile in the first year of life or consistently high BMI percentiles in early childhood may go on to have excess body fat later in life. However, among males, an early childhood BMI percentile trajectory was not associated with body fat later in early adulthood.
Supplementary Material
Important Questions.
What is already known about this subject?
Faster weight gain in early childhood is associated with higher body mass index or obesity later in life.
What does your study add?
Our study identified heterogeneous growth patterns over the first two years of life. Our study provides evidence that the association between growth in early childhood and body fat later in life may differ by gender. Baby girls who increased BMI percentile in the first year of life or maintained higher BMI percentiles during early childhood had higher body fat in childhood and early adulthood, as compared to baby girls who increased BMI percentiles in the second year of life. However, their boy counterparts did not have higher body fat in early adulthood.
Acknowledgments
We thank the children, parents, and staff of the Iowa Fluoride Study and the Iowa Bone Development Study.
FUNDING: This study was supported by the National Institutes of Health R03 HD078966, R01 DE12101, R01 DE09551, UL1 RR024979 and UL1 TR000442, M01 RR00059, the Roy J. Carver Charitable Trust, and Delta Dental of Iowa Foundation. SK had full access to all of the data in the study and takes responsibility for the integrity of the data and the accuracy of the data analysis.
Footnotes
DISCLOSURE: None of the authors has a conflict of interest to declare.
AUTHOR CONTRIBUTIONS: SK conceived of the study, requested the dataset from the IBDS, performed statistical analyses, and drafted the manuscript. KJ helped to draft and critically reviewed the manuscript. EL prepared the dataset and critically reviewed the manuscript. TB and SL critically reviewed the manuscript. All authors were involved in writing the paper and gave final approval for the submitted and published versions.
References
- 1.Ogden C, Carroll M. Prevalence of Obesity Among Children and Adolescents: United States, Trends 1963–1965 Through 2007–2008. [Accessed November 31, 2011];NCHS Health E-Stat. 2010 http://www.cdc.gov/nchs/data/hestat/obesity_child_07_08/obesity_child_07_08.htm.
- 2.Charney E, Goodman HC, McBride M, Lyon B, Pratt R. Childhood antecedents of adult obesity. Do chubby infants become obese adults? N Engl J Med. 1976;295(1):6–9. doi: 10.1056/NEJM197607012950102. [DOI] [PubMed] [Google Scholar]
- 3.Dubois L, Girard M. Early determinants of overweight at 4.5 years in a population-based longitudinal study. Int J Obes (Lond) 2006;30(4):610–617. doi: 10.1038/sj.ijo.0803141. [DOI] [PubMed] [Google Scholar]
- 4.Nader PR, O'Brien M, Houts R, et al. Identifying risk for obesity in early childhood. Pediatrics. 2006;118(3):e594–e601. doi: 10.1542/peds.2005-2801. [DOI] [PubMed] [Google Scholar]
- 5.Baird J, Fisher D, Lucas P, Kleijnen J, Roberts H, Law C. Being big or growing fast: systematic review of size and growth in infancy and later obesity. BMJ. 2005;331(7522):929. doi: 10.1136/bmj.38586.411273.E0. [DOI] [PMC free article] [PubMed] [Google Scholar]
- 6.Monteiro PO, Victora CG. Rapid growth in infancy and childhood and obesity in later life--a systematic review. Obes Rev. 2005;6(2):143–154. doi: 10.1111/j.1467-789X.2005.00183.x. [DOI] [PubMed] [Google Scholar]
- 7.Ong KK, Loos RJ. Rapid infancy weight gain and subsequent obesity: systematic reviews and hopeful suggestions. Acta Paediatr. 2006;95(8):904–908. doi: 10.1080/08035250600719754. [DOI] [PubMed] [Google Scholar]
- 8.Toschke AM, Grote V, Koletzko B, von Kries R. Identifying children at high risk for overweight at school entry by weight gain during the first 2 years. Arch Pediatr Adolesc Med. 2004;158(5):449–452. doi: 10.1001/archpedi.158.5.449. [DOI] [PubMed] [Google Scholar]
- 9.Stettler N, Iotova V. Early growth patterns and long-term obesity risk. Curr Opin Clin Nutr Metab Care. 2010;13(3):294–299. doi: 10.1097/MCO.0b013e328337d7b9. [DOI] [PubMed] [Google Scholar]
- 10.Martin-Gronert MS, Ozanne SE. Early life programming of obesity. Med Wieku Rozwoj. 2013;17(1):7–12. [PubMed] [Google Scholar]
- 11.Besharat Pour M, Bergström A, Bottai M, Magnusson J, Kull I, Moradi T. Age at adiposity rebound and body mass index trajectory from early childhood to adolescence; differences by breastfeeding and maternal immigration background. Pediatr Obes. 2016 doi: 10.1111/ijpo.12111. [DOI] [PubMed] [Google Scholar]
- 12.Roy SM, Chesi A, Mentch F, et al. Body mass index (BMI) trajectories in infancy differ by population ancestry and may presage disparities in early childhood obesity. J Clin Endocrinol Metab. 2015;100(4):1551–1560. doi: 10.1210/jc.2014-4028. [DOI] [PMC free article] [PubMed] [Google Scholar]
- 13.Warrington NM, Howe LD, Paternoster L, et al. A genome-wide association study of body mass index across early life and childhood. Int J Epidemiol. 2015;44(2):700–712. doi: 10.1093/ije/dyv077. [DOI] [PMC free article] [PubMed] [Google Scholar]
- 14.Wen X, Kleinman K, Gillman MW, Rifas-Shiman SL, Taveras EM. Childhood body mass index trajectories: modeling, characterizing, pairwise correlations and socio-demographic predictors of trajectory characteristics. BMC Med Res Methodol. 2012;12:38. doi: 10.1186/1471-2288-12-38. [DOI] [PMC free article] [PubMed] [Google Scholar]
- 15.Ziyab AH, Karmaus W, Kurukulaaratchy RJ, Zhang H, Arshad SH. Developmental trajectories of Body Mass Index from infancy to 18 years of age: prenatal determinants and health consequences. J Epidemiol Community Health. 2014;68(10):934–941. doi: 10.1136/jech-2014-203808. [DOI] [PMC free article] [PubMed] [Google Scholar]
- 16.Giles LC, Whitrow MJ, Davies MJ, Davies CE, Rumbold AR, Moore VM. Growth trajectories in early childhood, their relationship with antenatal and postnatal factors, and development of obesity by age 9 years: results from an Australian birth cohort study. Int J Obes (Lond) 2015;39(7):1049–1056. doi: 10.1038/ijo.2015.42. [DOI] [PubMed] [Google Scholar]
- 17.Stuart B, Panico L. Early-childhood BMI trajectories: evidence from a prospective, nationally representative British cohort study. Nutr Diabetes. 2016;6:e198. doi: 10.1038/nutd.2016.6. [DOI] [PMC free article] [PubMed] [Google Scholar]
- 18.Tu AW, Mâsse LC, Lear SA, Gotay CC, Richardson CG. Body mass index trajectories from ages 1 to 20: Results from two nationally representative canadian longitudinal cohorts. Obesity (Silver Spring) 2015;23(8):1703–1711. doi: 10.1002/oby.21158. [DOI] [PubMed] [Google Scholar]
- 19.Rzehak P, Wijga AH, Keil T, et al. Body mass index trajectory classes and incident asthma in childhood: results from 8 European Birth Cohorts--a Global Allergy and Asthma European Network initiative. J Allergy Clin Immunol. 2013;131(6):1528–1536. doi: 10.1016/j.jaci.2013.01.001. [DOI] [PubMed] [Google Scholar]
- 20.Garden FL, Marks GB, Simpson JM, Webb KL. Body mass index (BMI) trajectories from birth to 11.5 years: relation to early life food intake. Nutrients. 2012;4(10):1382–1398. doi: 10.3390/nu4101382. [DOI] [PMC free article] [PubMed] [Google Scholar]
- 21.Pryor LE, Tremblay RE, Boivin M, et al. Developmental trajectories of body mass index in early childhood and their risk factors: an 8-year longitudinal study. Arch Pediatr Adolesc Med. 2011;165(10):906–912. doi: 10.1001/archpediatrics.2011.153. [DOI] [PubMed] [Google Scholar]
- 22.Gunnarsdottir I, Thorsdottir I. Relationship between growth and feeding in infancy and body mass index at the age of 6 years. Int J Obes Relat Metab Disord. 2003;27(12):1523–1527. doi: 10.1038/sj.ijo.0802438. [DOI] [PubMed] [Google Scholar]
- 23.Freedman DS, Sherry B. The validity of BMI as an indicator of body fatness and risk among children. Pediatrics. 2009;124(Suppl 1):S23–S34. doi: 10.1542/peds.2008-3586E. [DOI] [PubMed] [Google Scholar]
- 24.Freedman DS, Ogden CL, Berenson GS, Horlick M. Body mass index and body fatness in childhood. Curr Opin Clin Nutr Metab Care. 2005;8(6):618–623. doi: 10.1097/01.mco.0000171128.21655.93. [DOI] [PubMed] [Google Scholar]
- 25.Freedman DS, Wang J, Maynard LM, et al. Relation of BMI to fat and fat-free mass among children and adolescents. In J Obes (2005) 2005;29(1):1–8. doi: 10.1038/sj.ijo.0802735. [DOI] [PubMed] [Google Scholar]
- 26.Nagin D. Group-based modeling of development. Cambridge:MA: Harvard University Press; 2005. [Google Scholar]
- 27.Levy SM, Warren JJ, Davis CS, Kirchner HL, Kanellis MJ, Wefel JS. Patterns of fluoride intake from birth to 36 months. J Public Health Dent. 2001;61(2):70–77. doi: 10.1111/j.1752-7325.2001.tb03369.x. [DOI] [PubMed] [Google Scholar]
- 28.Levy SM, Kiritsy MC, Slager SL, Warren JJ. Patterns of dietary fluoride supplement use during infancy. J Public Health Dent. 1998;58(3):228–233. doi: 10.1111/j.1752-7325.1998.tb02998.x. [DOI] [PubMed] [Google Scholar]
- 29.Kwon S, Janz KF, Letuchy EM, Burns TL, Levy SM. Developmental trajectories of physical activity, sports, and television viewing during childhood to young adulthood: Iowa Bone Development Study. JAMA Pediatrics. 2015;169(7):666–672. doi: 10.1001/jamapediatrics.2015.0327. [DOI] [PMC free article] [PubMed] [Google Scholar]
- 30.Kwon S, Janz KF, Burns TL, Levy SM. Effects of Adiposity on Physical Activity in Childhood: Iowa Bone Development Study. Med Sci Sports Exerc. 2011;43(3):443–448. doi: 10.1249/MSS.0b013e3181ef3b0a. [DOI] [PMC free article] [PubMed] [Google Scholar]
- 31.Janz KF, Kwon S, Letuchy EM, et al. Sustained effect of early physical activity on body fat mass in older children. Am J Prev Med. 2009;37(1):35–40. doi: 10.1016/j.amepre.2009.03.012. [DOI] [PMC free article] [PubMed] [Google Scholar]
- 32.Jones B, Nagin D. A Stata plugin for estimating group-based trajectory models. 2012 [Google Scholar]
- 33.Nylund KL, Asparouhov T, Muthen BO. Deciding on the number of classess in latent class analysis and growth mixture modeling: a Monte Carlo Simulation Study. Structural Equation Modeling. 2007;14(4):535–569. [Google Scholar]
- 34.Quadri M, Kwon S, N S, Charicki V, Binns H, Ariza A. Influence of pediatric prevention counseling on infant weight trajectories; Practice-Based Research Network Conference; 2015. [Google Scholar]
- 35.Mebrahtu TF, Feltbower RG, Parslow RC. Effects of birth weight and growth on childhood wheezing disorders: findings from the Born in Bradford Cohort. BMJ Open. 2015;5(11):e009553. doi: 10.1136/bmjopen-2015-009553. [DOI] [PMC free article] [PubMed] [Google Scholar]
- 36.Koletzko B, Brands B, Poston L, Godfrey K, Demmelmair H, Project EN. Early nutrition programming of long-term health. Proc Nutr Soc. 2012;71(3):371–378. doi: 10.1017/S0029665112000596. [DOI] [PubMed] [Google Scholar]
- 37.Oken E, Levitan EB, Gillman MW. Maternal smoking during pregnancy and child overweight: systematic review and meta-analysis. Int J Obes (Lond) 2008;32(2):201–210. doi: 10.1038/sj.ijo.0803760. [DOI] [PMC free article] [PubMed] [Google Scholar]
- 38.Hennessy E, Hughes SO, Goldberg JP, Hyatt RR, Economos CD. Parent behavior and child weight status among a diverse group of underserved rural families. Appetite. 2010;54(2):369–377. doi: 10.1016/j.appet.2010.01.004. [DOI] [PubMed] [Google Scholar]
- 39.Roeder K, Lynch K, Nagin D. Modeling uncertainty in latent class membership: A case study in criminology. JASA. 1999:766–776. [Google Scholar]
Associated Data
This section collects any data citations, data availability statements, or supplementary materials included in this article.