

Abstract
Objective
Exosomes from obese adipose contain dysregulated microRNAs linked to insulin signaling, as compared to lean controls, providing a direct connection between adiposity and insulin resistance. The current study tested the hypotheses that gastric bypass surgery and its subsequent weight loss would normalize adipocyte-derived-exosomal microRNAs associated with insulin signaling and the associated metabolome related to glucose homeostasis.
Methods
African-American female subjects with obesity (N=6; age: 38.5±6.8 years; BMI: 51.2±8.8 kg/m2) were tested before and one year after surgery. Insulin resistance (HOMA), serum metabolomics and global microRNA profiles of circulating adipocyte-derived exosomes were evaluated via ANCOVA and correlational analyses.
Results
One-year post-surgery, patients showed decreased BMI (−18.6±5.1 kg/m2; p<0.001), ameliorated insulin resistance (HOMA: 1.94±0.6 pre-surgery, 0.49±0.1 post-surgery; p<0.001), and altered metabolites including branched chain amino acids. Biological pathways analysis of predicted mRNA targets of 168 surgery-responsive microRNAs (p<0.05) identified the insulin signaling pathway (p=1.27E-10; 52/138 elements), among others, in our dataset. The insulin signaling pathway was also a target of 10 microRNAs correlated to changes in HOMA (p<0.05; r>0.4), and 48 microRNAs correlated to changes in BCAA levels.
Conclusions
These data indicate that circulating adipocyte-derived exosomes are modified following gastric bypass surgery and correlate to improved post-surgery insulin resistance.
Keywords: bariatric surgery, insulin resistance, molecular mechanisms, adipose tissue
INTRODUCTION
Insulin resistance in patients with obesity significantly contributes to the pathogenesis of chronic metabolic diseases such as Type II diabetes mellitus (T2DM). Adipose is a key modulator of systemic insulin resistance and metabolic dysregulation, exerting effects via mechanisms such as releasing pro-inflammatory cytokines into circulation (1, 2, 3, 4). Central adiposity is strongly linked to the pathogenesis of obesity-related comorbidities like insulin resistance in peripheral tissues (5, 6). However, large variations exist in the individual’s response to obesity as some patients with high body mass index (BMI) can have normal glucose homeostasis while others with normal BMI can have frank diabetes (7). Clearly the volume of adipose tissue alone does not portend systemic disease, suggesting adipose function must also play a critical role.
Adipose tissue is an active endocrine organ, which synthesizes and releases adipokines (such as leptin, resistin and adiponectin) that act as autocrine, paracrine and endocrine factors to modulate metabolism locally and at distant sites (3, 8). Ectopic adipose accumulation can significantly compromise insulin sensitivity by interfering with insulin signaling (9). However, variability in the relationship between BMI and overall insulin resistance highlights a major gap in our understanding of how adipose accumulation may affect overall glucose regulation.
One potential mechanism that could link adipose accumulation to overall glucose regulation is inter-organ signaling from adipose tissue via exosomes. Deng et al. (10) was the first study to suggest adipocyte-derived exosomes could affect insulin resistance, finding that obesity-related microRNAs targeted key biological pathways that impact insulin signaling using an animal model. Exosomes are nanoparticle-sized endocytic vesicles that transport lipids, sugars, nucleic acids, and proteins between cells (11, 12). Exosomal signaling is largely determined by their microRNA content, which can control gene expression in target cells by inhibiting mRNA translation or enhancing mRNA degradation (13, 14).
We recently described obesity-related differences in the microRNA content of exosomes derived from human obese visceral adipose tissue as compared to those from lean subjects (15) and identified adipocyte-derived exosomal signaling as a mediator linking adiposity and insulin resistance in peripheral tissues (15, 16). While these previous experiments showed the chronic effects of obesity on adipocyte-derived exosomal microRNA contents, the ability of significant weight loss to reverse these changes and the potential for cardiometabolic health gains are yet to be determined.
There is ample evidence that bariatric surgery leads to weight loss and improved glucose regulation, though the mechanisms by which surgery produces these effects, and their interdependence, are unclear (17). The overall goal of this project was to determine if gastric bypass bariatric surgery changes circulating adipocyte-derived exosomal microRNAs in obese subjects. We hypothesized that surgery-responsive microRNA levels one-year post-gastric bypass would be involved in insulin signaling pathways and that miRNA levels would correlate to clinical improvements in insulin sensitivity.
METHODS
Study Participants
Subjects were adult African-American females (age range 27–49) recruited from a bariatric surgery program at Vidant Medical Center (Greenville, NC). All study protocols were approved by Institutional Review Boards at both East Carolina University and Children's National Health System and written informed consent was obtained from all participants. Inclusion criteria included age between 25–60, BMI between 35–65, negative pregnancy test, and a willingness to comply with study requirements. Subjects were excluded if they were taking thiazolidinediones or if they had previous bariatric surgery. Diabetes was diagnosed at enrollment in accordance with the criteria of the NIH Consortium for the Longitudinal Assessment of Bariatric Surgery (LABS).
Surgery and Clinical Data Collection
Each subject was enrolled in the standard clinical protocol for gastric bypass surgery at Vidant Medical Center. Two weeks prior to surgery and one-year post-surgery, anthropometric measurements (age, height, weight) and blood samples (via antecubital venipuncture) were collected using standard clinical methods. Whole blood was fractionated into serum and plasma components for further study. Body mass index was calculated as kg/m2. Insulin was measured by immunoassay (Access Immunoassay System, Beckman Coulter, Fullerton, CA), and glucose with an oxidation reaction (YSI 2300, Yellow Springs, OH). The Homeostasis Model Assessment (HOMA2) was calculated from plasma glucose and insulin levels (www.dtu.ox.ac.uk/homacalculator).
Circulating Adipocyte-Derived Exosome Isolation
Fatty acid binding protein 4 (FABP4) was used as a sensitive and specific marker for adipocyte-derived exosomes isolated from 500 uL plasma and serum samples (18). First, exosomes were pelleted using Exoquick TC (Systems Bioscience, Palo Alto, CA) and then pellets were resuspended in 100 uL PBS. We then used commercially-available antibody complexes and dextran-coated magnetic particles (StemCell Technologies, Vancouver, BC, Canada) to target FABP4+ exosomes in plasma and serum. The anti-FABP4-antibody (mouse monoclonal) complexes link targeted exosomes to magnetic particles. Labeled exosomes were then pulled to the sides of the tube when the sample was placed in a magnet. Magnetically-labeled exosomes remained in the tube while other exosomes were poured off into a new tube. The exosomes were then prepared for RNA studies as described below.
RNA Extraction and Amplification
We extracted adipocyte-exosomal total RNA using mirVana microRNA Isolation Kits (Life Technologies) and amplified total RNA with the Complete Seramir Exosome RNA Amplification Kit from Media and Urine (System Biosciences, Mountain View, CA) according to manufacturer’s instructions. We used the Agilent 2100 Bioanalyzer RNA Pico Chip (Agilent Technologies, Santa Clara, CA) to assess RNA quality at each step.
RNA Expression and Statistical Analyses
We labeled 1000 ng RNA with Affymetrix® FlashTag™ Biotin HSR RNA Labeling Kit (Affymetrix, Santa Clara, CA) according to standard procedures. Labeled RNA was hybridized to Affymetrix GeneChip microRNA 4.0 arrays and run using a Fluidics Station 450 Protocol (FS450_002) (Affymetrix, Santa Clara, CA). Data discussed in this publication have been deposited in NCBI's Gene Expression Omnibus and are accessible through GEO Series accession GSE74083 (http://www.ncbi.nlm.nih.gov/geo/).
Resulting data were analyzed in Expression Console using RMA+DMBG (Affymetrix) and then exported to Partek Genomics Suite for analyses. Only mature human microRNAs were retained for statistical comparison between groups. Repeated measures ANCOVA (time; age covariate) was used to compare microRNA expression from pre- to post-surgery, using p≤0.05 as a filter. Rather than use a False Discovery Rate on the initial microRNA dataset, we carried all microRNAs that met the unadjusted p<0.05 cutoff into biological pathway analysis and used more stringent cutoffs during the pathway identification process (as described below). The relationship between insulin resistance (HOMA) and microRNA changes from baseline to one-year post-surgery was also assessed using Pearson correlation coefficients.
Biological Pathway Analyses
microRNAs found to be differentially regulated from pre- to post-surgery were uploaded into Ingenuity Pathway Analysis Suite (Ingenuity Inc., Redwood City, CA) for further analyses. First, targets of microRNAs were determined using IPA’s microRNA Target Filter, which identifies experimentally validated microRNA-mRNA interactions from TarBase, miRecords, and the peer-reviewed biomedical literature, as well as predicted microRNA-mRNA interactions from TargetScan. We used a conservative filter at this point, using only experimentally validated and highly conserved predicted mRNA targets for each microRNA. We carried these mRNA targets through to Core Pathway Analyses, which identified relationships among the mRNAs in our dataset. The p-values represented by the pathway analyses reduce the risk of false positive findings from the original repeated measures ANOVA, as false positive findings occur at random, while pathways are created only using biologically related elements (i.e. non-random). Canonical pathways, novel networks and common upstream regulators were then queried for overlap with our differentially expressed microRNA gene target list.
Plasma Metabolites
Targeted analysis of 42 amine-containing metabolites consisting of 20 major amino acids, and secondary metabolites of arginine and cysteine that are sensitive to inflammation and oxidative stress were performed as described previously (19, 20). Briefly, plasma was acidified with 5% perchloric acid containing eight stable isotope internal standards. Acid-soluble supernatant was used for strong-cation exchange solid-phase extraction to capture cationic amine-containing metabolites. Extracted metabolites were further derived with isopropylchloroformate. Derivatives of metabolites were resolved using Agilent 1260 ultra-high pressure liquid chromatography and eluted with a gradient of water and isopropanol (65% v/v). An Agilent 6490 triple quadrupole mass spectrometer coupled with Agilent 1200 UPLC system was used to detect resolved analytes and quantified using authenticated external and internal standards.
RESULTS
Subjects
Six obese African-American female subjects completed the study. Mean BMI at the time of surgery was 51.2±8.8 kg/m2 (±SD), which decreased by 36.3±8.3% at one-year post-surgery. All subjects completed the surgical standard of care protocol without complication. Subject demographics are reported in Table 1.
Table 1.
Cohort Demographics and Clinical Values.
| Characteristic | Mean±SD | p-value (Time) |
|
|---|---|---|---|
| Baseline | Post- Surgery |
||
| N | 6 | 6 | |
| Age(years) | 38.5±6.8 | 39.5±6.8 | <0.001 |
| Height (cm) | 164.8±5.3 | 164.8±5.3 | NS |
| Weight (kg) | 138.6±27.1 | 89.1±24.1 | <0.001 |
| BMI (kg/m2) | 51.2±8.8 | 32.6±8.1 | <0.001 |
| Fasting plasma glucose(mg/dL) | 98.8±7.3 | 83.9±4.9 | 0.012 |
| Fasting plasma insulin(µU/mL) | 14.8±4.3 | 3.8±1.1 | <0.01 |
| HOMA2 | 1.94±0.6 | 0.49±0.1 | <0.01 |
HOMA2 calculated using HOMA2 calculator (www.dtu.ox.ac.uk/homacalculator/).
Gastric Bypass Surgery Decreases Insulin Resistance
Changes from baseline to the one-year post-surgery time point included a 15.1±8.7% reduction in fasting plasma glucose and a 74±4.3% reduction in fasting plasma insulin (Table 1).
Pre- vs. Post-Bypass Surgery microRNA Comparisons
168 known mature human microRNAs were differentially expressed after surgery in circulating adipocyte-derived exosomes compared with pre-surgery baseline. Once a conservative filter was applied (only microRNAs with experimentally confirmed or highly conserved predicted targets), 56 microRNAs remained, which collectively putatively target 7,143 mRNAs.
Using the 7,143 mRNA targets of the 56 surgery-responsive microRNAs, we used Ingenuity Pathway Analysis Suite to identify enriched biological pathways. Using a p-value filter for pathway significance of p<0.01, 36 canonical pathways were identified as enriched in the surgery-responsive dataset. Table 2 presents the top 15 canonical pathways by IPA pathway rank score that had >25 elements in our dataset and are related to metabolism. This last filter was used to screen out ubiquitous cancer-specific pathways.
Table 2.
Canonical Pathways from Biological Pathway Analyses.
| Surgery-Responsive (ANCOVA) |
Correlated to HOMA |
|||||||
|---|---|---|---|---|---|---|---|---|
| Ingenuity Canonical Pathway |
−log (p- value) |
Ratio | Genes in Dataset |
Total Genes in Pathway |
−log(p- value) |
Ratio | Genes in Dataset |
Total Genes in Pathway |
| B Cell Receptor Signaling |
5.50 | 0.27 | 47 | 176 | 4.78 | 0.36 | 64 | 176 |
| ERK/MAPK Signaling |
4.22 | 0.24 | 46 | 190 | 7.86 | 0.41 | 77 | 190 |
| IGF-1 Signaling | 4.00 | 0.28 | 28 | 99 | 5.19 | 0.42 | 42 | 99 |
| Wnt/Beta-catenin Signaling |
3.97 | 0.25 | 41 | 167 | 4.35 | 0.36 | 60 | 167 |
| AMPK Signaling | 3.88 | 0.25 | 37 | 194 | 4.16 | 0.35 | 67 | 194 |
| Apoptosis Signaling* |
3.67 | 0.28 | 25 | 88 | NS* | |||
| SAPK/JNK Signaling |
3.59 | 0.28 | 26 | 94 | 5.01 | 0.43 | 40 | 94 |
| FGF Signaling | 3.58 | 0.28 | 25 | 89 | 2.93 | 0.37 | 33 | 89 |
| HGF Signaling | 3.38 | 0.26 | 28 | 107 | 9.21 | 0.50 | 53 | 107 |
| Cardiac Hypertrophy Signaling |
3.35 | 0.22 | 50 | 229 | 5.63 | 0.36 | 82 | 229 |
| 14-3-3-mediated Signaling |
3.34 | 0.25 | 30 | 118 | 2.85 | 0.35 | 41 | 118 |
| Tight Junction Signaling |
3.09 | 0.23 | 38 | 166 | 3.84 | 0.35 | 58 | 166 |
| Corticotropin Releasing Hormone Signaling |
3.06 | 0.25 | 29 | 117 | 2.93 | 0.35 | 41 | 117 |
| p38 MAPK Signaling |
3.06 | 0.25 | 29 | 117 | 4.22 | 0.39 | 45 | 117 |
| Insulin Receptor Signaling |
3.02 | 0.24 | 32 | 134 | 4.90 | 0.39 | 52 | 134 |
One of the top canonical pathways identified as enriched was the WNT-Beta Catenin pathway (41 molecules in our dataset/167 molecules in pathway; pathway p value = 1.41E−12), similar to what we found when analyzing the adipose-derived exosomes isolated directly from the visceral adipose itself (15). Another top predicted canonical pathway for the pre- to post-surgery analysis was Insulin Receptor Signaling (Figure 1), with 32/134 elements represented in the affected mRNA target set (pathway p value=5.65E−07). Specific microRNA-mRNA pairs in this pathway are listed in Table 3.
Figure 1.

Insulin Receptor Signaling Pathway Targeted by Surgery-Responsive microRNAs. The canonical pathway for Insulin Receptor Signaling was highly ranked as a target for surgery-responsive microRNAs. Green color indicates predicted downregulation of target transcripts by differentially expressed microRNAs (i.e. upregulated microRNAs that inhibit mRNA target production), and red color indicates predicted upregulation of mRNA targets. Specific fold changes and microRNA-mRNA pairings are detailed in Table 3. The pathway was generated using QIAGEN’s Ingenuity Pathway Analysis (IPA®, QIAGEN Redwood City, www.qiagen.com/ingenuity).
Table 3.
Surgery-responsive microRNAs with mRNA Targets Related to Insulin Signaling.
| Symbol | Seed | p-value | microRNA Fold Change ± SD |
# Targets in Insulin Signaling |
Targets in Insulin Signaling Pathway |
|---|---|---|---|---|---|
| miR-1227-3p | GUGCCAC | 0.02 | 2.23 ± 0.35 | 2 | PRKC1, SOCS3 |
| miR-4691-5p | UCCUCCA | 0.03 | 1.98 ± 0.09 | 2 | PIK3C3, PRKAG1 |
| miR-219a-5p | GAUUGUC | 0.02 | 1.80 ± 0.19 | 8 | GSK3B, OCRL, PIK3C3G, PPP1R14B, PRKCI, RAPGEF1, RHOQ, SHC1 |
| miR-4728-3p | AUGCUGA | 0.02 | 1.64 ± 0.20 | 2 | EIF4E, MAPK1 |
| miR-103-3p | GCAGCAU | 0.02 | 1.59 ± 0.25 | 8 | CRKL, IRS2, JAK1, PDE3B, PIK3R1, PRKCI, SOS1, SYNJ1 |
| miR-3622a-3p | CACCUGA | 0.04 | 1.54 ± 0.21 | 1 | PIK3R6 |
| miR-4749-3p | GCCCCUC | 0.03 | 1.53 ± 0.31 | 2 | PRKACA, RAPGEF1 |
| miR-125b-5p | CCCUGAG | 0.01 | 1.50 ± 0.28 | 10 | ASIC1, EIF2B2, EIF4EBP1, GRB10, PIK3C2B, PIK3CD, PIK3R5, PPP1CA, RAF1, RHOQ |
| miR-3926 | GGCCAAA | 0.01 | −1.52 ± 0.31 | 1 | PRKAR2B |
| miR-224-5p | AAGUCAC | 0.01 | −1.53 ± 0.12 | 5 | CBL, CRKL, GSK3B, IRS2, PIK3R3 |
| miR-4723-5p | GGGGGAG | 0.01 | −1.58 ± 0.08 | 6 | AKT1, FOXO4, PIK3R2, PRKACA, RRAS, VAMP2 |
| miR-16-5p | AGCAGCA | 0.02 | −1.59 ± 0.11 | 27 | AKT3, CRKL, EIF2B5, EIF4E, FOXO1, GRB10, INSR, IRS1, IRS2, KRAS, LIPE, MAP2L1, MAPK3, MRAS, OCRL, PIK2C3A, PIK3R1, PPP1R11, PRKAR2A, RAF1, RAPGEF1, SGK1, SOS1, SOS2, SYNJ1, TRIP10, TSC1 |
| miR-3690 | CCUGGAC | 0.01 | −1.73 ± 0.08 | 2 | PIK3R5, SCNN1G |
| miR-208a-3p | UAAGACG | 0.01 | −1.82 ± 0.10 | 3 | IRS2, PRKAR1A, SOS2 |
| miR-4716-3p | AGGGGGA | 0.04 | −1.87 ± 0.12 | 3 | AKT2 PRKACA, STXBP4 |
| miR-4525 | GGGGGAU | 0.04 | −1.91 ± 0.07 | 2 | PRKACA, VAMP2 |
| miR-2355-5p | UCCCCAG | 0.02 | −1.93 ± 0.12 | 4 | CBL, FOXO4, PIK3CD, PPP1R3C |
| miR-4782-5p | UCUGGAU | 0.02 | −2.29 ± 0.16 | 1 | GYS1 |
microRNAs listed limited to those with ≥ |1.5| fold change from baseline.
Pre- vs. Post-Bypass Surgery microRNA Changes Correlated to Insulin Resistance
Using Pearson correlational analyses between change in all microRNA levels and change in HOMA from baseline to one-year post-surgery, change in 46 known mature microRNAs were significantly correlated to change in HOMA. Once a conservative filter was applied (only experimentally confirmed or highly conserved predicted targets), 29 microRNA remained, which together putatively target 4,266 mRNAs.
Using the 4,266 mRNA targets of the 29 microRNAs that correlated to HOMA changes after surgery, we again used Ingenuity Pathway Analysis Suite to identify enriched biological pathways. Despite having fewer microRNAs and mRNA targets in the experimental gene set, the correlational analyses generated more significant pathways than the ANOVA comparison, with 132 pathways having p-value scores of p<0.01. All but one of the top 15 pathways from the ANOVA comparison were also significantly represented in the correlational gene set (Table 2), with the exception of the apoptosis pathway.
Insulin Receptor Signaling (Figure 2) was again identified as being enriched in our dataset, with 52/134 elements represented in the HOMA-correlated mRNA target set (pathway p value=1.27E-10). Specifically, 10 microRNAs that correlated to HOMA each contained ≥3 target mRNAs within the Insulin Receptor Signaling canonical pathway and are listed in Table 4.
Figure 2.

mRNA Targets of microRNAs Correlated to Altered Insulin Resistance after Surgery. Green color indicates predicted negative correlation of mRNA transcripts (i.e. positive correlation of microRNAs) to HOMA change following surgery, while red color indicates the reverse relationship (r>0 for mRNA targets and r<0 for microRNAs). Genes in gray and marked with an asterisk (*) represent targets of multiple microRNAs that have different correlational directions in relation to HOMA change. Specific r values and microRNA-mRNA pairs are detailed in Table 4. The pathway was generated using QIAGEN’s Ingenuity Pathway Analysis (IPA®, QIAGEN Redwood City, www.qiagen.com/ingenuity).
Table 4.
microRNAs Correlated to Change in HOMA with >3 Insulin Signaling Targets.
| Symbol | Seed | p- value |
HOMA r |
# Targets in Insulin Signaling |
Targets in Insulin Signaling Pathway |
|---|---|---|---|---|---|
| miR-155-5p | UAAUGCU | 0.021 | 0.88 | 11 | CBL, FOXO3, GSK3B, INPP5D, KRAS, PIK3R1, PRKAR1A, PRKCI, RHOQ, RPTOR, SOS1 |
| miR-503-5p | AGCAGCG | 0.045 | 0.82 | 10 | EIF4E, INSR, MAP2K1, OCRL, PIK3C2A, PIK3R1, PPP1R11, RAF1, SGK1, SLC2A4 |
| miR-199a-5p | CCAGUGU | 0.005 | 0.94 | 7 | CBL, GRB10, GSK3B, PIK3CD, PPP1R12A, SLC2A4, SOS2 |
| miR-539-5p | GAGAAAU | 0.005 | 0.94 | 7 | AKT3, EIF4E, FOXO3, INPP5D, MAPK1, PPP1CB, PRKAG2 |
| miR-874-3p | UGCCCUG | 0.012 | 0.91 | 4 | CRK, GSK3B, INPP5B, PPP1CA |
| miR-4664-5p | GGGGUGC | 0.029 | −0.86 | 4 | ACLY, INPP5D, OCRL, PRKAR2A |
| miR-4747-5p | GGGAAGG | 0.030 | −0.86 | 4 | ASIC1, GRB2, RRAS2, SCNN1A |
| miR-516b-5p | UCUGGAG | 0.038 | 0.84 | 3 | CBL, GYS1, PIK3R5 |
| miR-126-3p | CGUACCG | 0.041 | 0.83 | 4 | CRK, CRKL, IRS1, PIK3R2 |
| miR-122-5p | GGAGUGU | 0.047 | 0.82 | 4 | AKT3, CBL, FOXO3, GYS1 |
Bypass Surgery-Induced Weight-loss and Metabolic Improvements
To further investigate metabolic changes in patients following gastric bypass, metabolomic profiles of amine-containing metabolites were quantified at baseline (2 weeks prior to surgery) and one year following gastric bypass surgery. Metabolites were assessed by ANCOVA over time, and were correlated to HOMA levels and changes in exosomal microRNAs.
At one-year post-surgery, there were significant rises in asparagine (+55%; p=0.035), citrulline (+59%; p=0.008), glutamine (+30%; p=0.014; Figure 3A), glycine (+91%; p<0.001; Figure 3F) and histidine (+47%; p=0.027). Significant reductions were found in cysteinylglycine (−19%; p=0.006), glutamic acid (−27%; p=0.038; Figure 3B), leucine/isoleucine (−15%; p=0.034; Figure 3D), total branched chain amino acids (−31%; p=0.033; Figure 3E), and the Glu/Gln ratio (−45%; p=0.008, Figure 3C).
Figure 3.
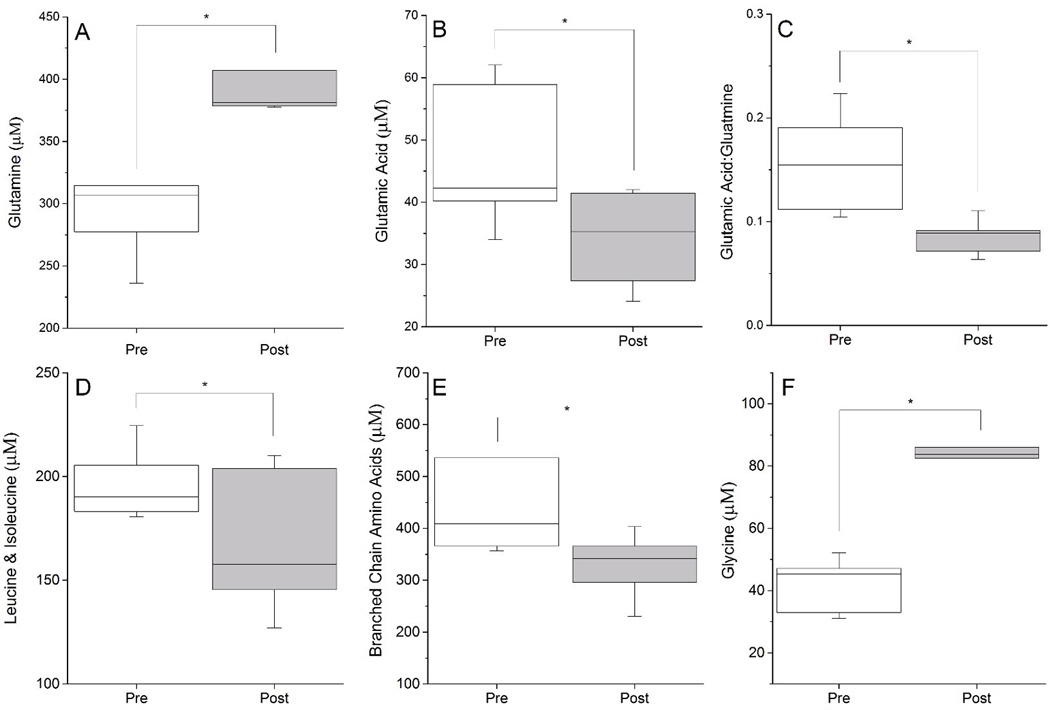
Metabolite Changes One Year Following Gastric Bypass Surgery. Weight loss surgery produced a significant rise in fasting plasma Gln (Panel A) and decrease in Glu (Panel B). Plasma Glu/Gln ratio (Panel C), branched chain amino acids (Panels D and E) all significantly decreased in obese patients following bariatric surgery, while glycine (Panel F) increased post-surgery. All changes depicted are significant by ANCOVA at p<0.05.
Several metabolites were significantly correlated to HOMA values, including asparagine (r=0.84, p<0.001; CI: 0.52–0.95), glycine (r=0.72, p<0.01; CI: 0.24–0.91), lysine (r=0.70, p=0.01; CI: 0.21–0.91) and histidine (r=0.64, p=0.03; CI: 0.08–0.88). Both glutamic acid (Glu; r=−0.54, p=0.07; CI: −0.85−0.04) and glutamine (Gln; r=0.53, p=0.07; CI: −0.05–0.84) showed trends towards correlating with HOMA, while the Gln/Glu ratio (r=−0.62, p=0.03; CI: −0.87 − −0.07) was significantly correlated to HOMA.
As branched chain amino acids (BCAAs) have been particularly linked to insulin dysregulation (and HOMA), lastly we identified exosomal microRNAs that correlated to total BCAAs as measured in our metabolite panel. Using p<0.05, 135 microRNAs were significantly correlated with BCAA levels pre- and post-surgery. Of these 135, 91 have conservatively mapped mRNA targets, totaling 8,695 mRNA targets. In the Insulin Receptor Signaling canonical pathway, 48 microRNAs targeting 78 mRNAs were significantly correlated to BCAA levels. The miRNAs with the most targets in the Insulin Receptor Signaling pathway included let-7a-5p (r=−0.7; 11 targets including INSR, IRS2, and KRAS) and miR-16-5p (r=0.66; 28 targets including INSR, IRS1, and IRS2).
DISCUSSION
Increased adiposity (especially within visceral depots) is associated with insulin resistance, a key early mechanism driving the development of T2DM. While this association is epidemiologically strong, direct mechanisms by which adipose impacts glucose metabolism in tissues such as skeletal muscle and liver are still unclear. Here, we show that circulating adipocyte-derived exosomal microRNAs targeting the canonical Insulin Receptor Signaling pathway are altered following bariatric surgery-induced weight loss. Many of these microRNAs also significantly correlate with robust clinical improvements in insulin resistance. This is consistent with our previous work, wherein we reported obesity-dysregulated miRNAs in visceral adipocyte-derived exosomes are predicted to impair insulin receptor signaling in obese adolescents, suggesting that obesity-dysregulated exosome signaling from adipose could be positively impacted by weight loss following bariatric surgery (15, 16).
Initially proposed in the late 1970s, the amelioration of Type 2 diabetes following bariatric surgery has been the object of intense study for the last decade (21, 22). In a 2004 meta-analysis of >22,000 patients following bariatric surgery, Buchwald et al. (23) reported resolution of diabetes in 77% of patients. Similarly, the Bariatric Outcomes Longitudinal Database shows diabetes resolution at one-year post-gastric bypass in 62% (24). In the past decade, the resolution of diabetes (and other obesity co-morbidities) has been debated at great length, especially relating to whether the effects are weight loss-dependent or a result of the bypass procedure itself. As all of the patients in our cohort lost significant amounts of excess weight at one-year post-gastric bypass, we cannot clarify that debate, but we do provide evidence of a potential direct link by which loss of or change in adiposity could directly modulate insulin resistance in the periphery. Further studies that directly compare exosomal miRNA changes between non-surgical weight loss (i.e. diet or exercise intervention) and gastric bypass would be able to shed light on the contributing effects of the procedure, in contrast to weight loss, on exosomal signaling.
Previous studies have demonstrated that multiple microRNAs are involved in glucose homeostasis, including miRs-33, -103, -107 and -29a/b (25, 26, 27, 28). However, relatively little is known about which microRNAs are most strongly related to clinical changes in insulin sensitivity. Various diabetes and surgery models have associated levels of a variety of microRNAs with diabetic status and/or HOMA, such as miR-146a(29), miRs-375 and -30d(30), miR-103(31), miRs-128, -130b-3p, -374a-5p, and -423-5p(32) and miR-223(33). Of these, we found that miR 103- 3p was increased almost 60% after surgery and had multiple targets in the insulin receptor signaling pathway. None of the other aforementioned microRNAs were correlated to HOMA in our study or had greater than 3 targets in insulin signaling canonical pathway. Glucose homeostasis is a complex clinical trait, likely affected by multiple miRNAs, which can change depending on which metabolically-active tissue is affected. A recent review by Veinberg et al. (34) lists close to fifty microRNAs that affect various metabolically-active tissues. Rather than focus our discussion on individual microRNAs in circulating exosomes, we instead focus on biological pathways that are targets of the collective microRNA profiles. By coupling a statistically-powerful longitudinal study design with a large effect size for HOMA improvements post-surgery, our data represent a collective picture of how surgery-responsive microRNAs could affect important biological pathways underlying the insulin sensitivity clinical trait.
We also found significant metabolomic profile changes in the blood of our obese patients one year following bypass surgery. Significant weight reduction following surgery was associated with a significant rise in fasting plasma Gln and decrease in Glu. The plasma Glu/Gln ratio is significantly elevated in the obese and associated with elevated risk for diabetes (35), and thus the increase in Gln and decrease in Glu would normalize this ratio, thereby reducing the risk of diabetes. Similarly, BCAA accumulation is associated with increased insulin resistance (36, 37, 38), and we found significant reductions in fasting plasma BCAAs in our patients following bypass surgery. In animal models of diet-induced obesity, elevation in fasting BCAAs was associated with decreased catabolism in adipose tissue (38). A decrease in BCAAs and an associated increase in fasting Gln can also arise from improved muscle catabolism of BCAAs where excess nitrogen can be removed through Gln export (39). This would occur if muscle insulin sensitivity improved following weight loss. Thus it is possible that adipocyte-derived exosomal microRNA changes and their subsequent effect on the muscle may drive these changes. While we did not specifically measure muscle insulin sensitivity, our patients demonstrated robust improvements in HOMA, indicating improved peripheral insulin sensitivity. In order to more definitively evaluate the relationship between the adipocyte exosomes and the muscle, in vitro assessment of the effect of exosome exposure on insulin signaling in primary skeletal muscle would be required.
Regarding extrapolation of our data to previous studies in the area, our previous data and others suggest the visceral fat is more diabetogenic than the subcutaneous tissue, which may explain why our identified microRNAs are different than in other reports. Furthermore, it is likely that race and ethnicity play a role in the microRNA content of adipocyte-derived exosomes. Our study explored surgery-induced changes in African-American females, a group that has a disproportional burden of T2DM (though our cohort was largely insulin resistant rather than overtly diabetic). Further testing of our hypotheses in different biological groups will test the universal nature of the mechanism.
CONCLUSION
In summary, our data show that the microRNA content of circulating adipocyte-derived exosomes isolated from the peripheral blood are significantly modified following gastric bypass bariatric surgery and these changes are correlated to improvements in insulin resistance post-surgery. Furthermore, we show that the altered microRNAs target a myriad of members in the insulin receptor signaling pathway. Lastly, we found metabolomic changes (specifically a decrease in BCAAs) in our patients after bypass consistent with improved glucose homeostasis. Further elucidating the role of adipocyte-derived exosomal microRNAs in bariatric surgery patients provides a unique opportunity to understand obesity-related insulin resistance and its response to surgical intervention, and perhaps will lead to novel intervention strategies in the future.
Cells actively secrete exosomes (endocytic vesicles), which are capable of transporting functional mRNAs, microRNAs, and proteins to distant tissues. Animal studies suggest adipose-derived exosomes could affect insulin resistance.
Our work has previously identified obesity-induced miRNA changes in human adipose-derived exosomes, and these changes are linked to inflammatory and cell signaling pathways.
The current study shows, for the first time, that a weight-loss intervention can modulate adipocyte-derived exosomal miRNA contents linked to insulin receptor signaling; changes that correlate to improved insulin sensitivity following bariatric surgery.
Acknowledgments
FUNDING: This project was supported by Award Number UL1TR000075 from the NIH National Center for Advancing Translational Sciences. Its contents are solely the responsibility of the authors and do not necessarily represent the official views of the National Center for Advancing Translational Sciences or the National Institutes of Health. Additional funding support was provided by the Clark Charitable Foundation, Bethesda, MD.
The authors acknowledge the assistance of Drs. Joseph Houmard and Charles Tanner with glucose and insulin measures and Bryant Green and Rita Bowden for assistance in collecting samples.
Footnotes
Disclosure: The authors declare no conflict of interest.
M.J.H. and R.J.F. were involved in all aspects of the project. S.C.F., M.D.B., and J.W. researched data. G.L.D., W.J.P. and J-H.S. researched data, contributed to discussion and reviewed/edited manuscript. M.M.S. and E.P.N. contributed to discussion and reviewed/edited manuscript.
REFERENCES
- 1.Boden G, Cheung P, Kresge K, Homko C, Powers B, Ferrer L. Insulin resistance is associated with diminished endoplasmic reticulum stress responses in adipose tissue of healthy and diabetic subjects. Diabetes. 2014;63:2977–2983. doi: 10.2337/db14-0055. [DOI] [PMC free article] [PubMed] [Google Scholar]
- 2.Kim JY, van de Wall E, Laplante M, Azzara A, Trujillo ME, Hofmann SM, et al. Obesity-associated improvements in metabolic profile through expansion of adipose tissue. The Journal of clinical investigation. 2007;117:2621–2637. doi: 10.1172/JCI31021. [DOI] [PMC free article] [PubMed] [Google Scholar]
- 3.Sun K, Kusminski CM, Scherer PE. Adipose tissue remodeling and obesity. The Journal of clinical investigation. 2011;121:2094–2101. doi: 10.1172/JCI45887. [DOI] [PMC free article] [PubMed] [Google Scholar]
- 4.Tilg H, Moschen AR. Adipocytokines: mediators linking adipose tissue, inflammation and immunity. Nature reviews Immunology. 2006;6:772–783. doi: 10.1038/nri1937. [DOI] [PubMed] [Google Scholar]
- 5.Marette A, Liu Y, Sweeney G. Skeletal muscle glucose metabolism and inflammation in the development of the metabolic syndrome. Reviews in endocrine & metabolic disorders. 2014;15:299–305. doi: 10.1007/s11154-014-9296-6. [DOI] [PubMed] [Google Scholar]
- 6.Sam S, Mazzone T. Adipose tissue changes in obesity and the impact on metabolic function. Translational research : the journal of laboratory and clinical medicine. 2014;164:284–292. doi: 10.1016/j.trsl.2014.05.008. [DOI] [PubMed] [Google Scholar]
- 7.Gomez-Ambrosi J, Silva C, Galofre JC, Escalada J, Santos S, Millan D, et al. Body mass index classification misses subjects with increased cardiometabolic risk factors related to elevated adiposity. Int J Obes (Lond) 2012;36:286–294. doi: 10.1038/ijo.2011.100. [DOI] [PubMed] [Google Scholar]
- 8.Guilherme A, Virbasius JV, Puri V, Czech MP. Adipocyte dysfunctions linking obesity to insulin resistance and type 2 diabetes. Nat Rev Mol Cell Biol. 2008;9:367–377. doi: 10.1038/nrm2391. [DOI] [PMC free article] [PubMed] [Google Scholar]
- 9.Shulman GI. Ectopic fat in insulin resistance, dyslipidemia, and cardiometabolic disease. The New England journal of medicine. 2014;371:1131–1141. doi: 10.1056/NEJMra1011035. [DOI] [PubMed] [Google Scholar]
- 10.Deng ZB, Poliakov A, Hardy RW, Clements R, Liu C, Liu Y, et al. Adipose tissue exosome-like vesicles mediate activation of macrophage-induced insulin resistance. Diabetes. 2009;58:2498–2505. doi: 10.2337/db09-0216. [DOI] [PMC free article] [PubMed] [Google Scholar]
- 11.Camussi G, Deregibus MC, Bruno S, Grange C, Fonsato V, Tetta C. Exosome/microvesicle-mediated epigenetic reprogramming of cells. American journal of cancer research. 2011;1:98–110. [PMC free article] [PubMed] [Google Scholar]
- 12.Zernecke A, Bidzhekov K, Noels H, Shagdarsuren E, Gan L, Denecke B, et al. Delivery of microRNA-126 by apoptotic bodies induces CXCL12-dependent vascular protection. Science signaling. 2009;2:ra81. doi: 10.1126/scisignal.2000610. [DOI] [PubMed] [Google Scholar]
- 13.Bartel DP. MicroRNAs: target recognition and regulatory functions. Cell. 2009;136:215–233. doi: 10.1016/j.cell.2009.01.002. [DOI] [PMC free article] [PubMed] [Google Scholar]
- 14.Karelis AD, St-Pierre DH, Conus F, Rabasa-Lhoret R, Poehlman ET. Metabolic and body composition factors in subgroups of obesity: what do we know? The Journal of clinical endocrinology and metabolism. 2004;89:2569–2575. doi: 10.1210/jc.2004-0165. [DOI] [PubMed] [Google Scholar]
- 15.Ferrante SC, Nadler EP, Pillai DK, Hubal MJ, Wang Z, Wang JM, et al. Adipocyte-derived exosomal miRNAs: a novel mechanism for obesity-related disease. Pediatr Res. 2015;77:447–454. doi: 10.1038/pr.2014.202. [DOI] [PMC free article] [PubMed] [Google Scholar]
- 16.Koeck ES, Iordanskaia T, Sevilla S, Ferrante SC, Hubal MJ, Freishtat RJ, et al. Adipocyte exosomes induce transforming growth factor beta pathway dysregulation in hepatocytes: a novel paradigm for obesity-related liver disease. J Surg Res. 2014;192:268–275. doi: 10.1016/j.jss.2014.06.050. [DOI] [PubMed] [Google Scholar]
- 17.Schauer PR, Bhatt DL, Kashyap SR. Bariatric surgery versus intensive medical therapy for diabetes. The New England journal of medicine. 2014;371:682. doi: 10.1056/NEJMc1407393. [DOI] [PubMed] [Google Scholar]
- 18.Shan T, Liu W, Kuang S. Fatty acid binding protein 4 expression marks a population of adipocyte progenitors in white and brown adipose tissues. FASEB journal : official publication of the Federation of American Societies for Experimental Biology. 2013;27:277–287. doi: 10.1096/fj.12-211516. [DOI] [PMC free article] [PubMed] [Google Scholar]
- 19.Suh JH, Kim R, Yavuz B, Lee D, Lal A, Ames BN, et al. Clinical assay of four thiol amino acid redox couples by LC-MS/MS: utility in thalassemia. J Chromatogr B Analyt Technol Biomed Life Sci. 2009;877:3418–3427. doi: 10.1016/j.jchromb.2009.06.041. [DOI] [PMC free article] [PubMed] [Google Scholar]
- 20.Suh JH, Kim RY, Lee DS. A new metabolomic assay to examine inflammation and redox pathways following LPS challenge. J Inflamm (Lond) 2012;9:37. doi: 10.1186/1476-9255-9-37. [DOI] [PMC free article] [PubMed] [Google Scholar]
- 21.Buchwald H. The evolution of metabolic/bariatric surgery. Obes Surg. 2014;24:1126–1135. doi: 10.1007/s11695-014-1354-3. [DOI] [PubMed] [Google Scholar]
- 22.Dar M, Pories WJ. Bariatric surgery: what is the effect on type 2 diabetes? Curr Opin Investig Drugs. 2009;10:1078–1084. [PubMed] [Google Scholar]
- 23.Buchwald H, Avidor Y, Braunwald E, Jensen MD, Pories W, Fahrbach K, et al. Bariatric surgery: a systematic review and meta-analysis. JAMA. 2004;292:1724–1737. doi: 10.1001/jama.292.14.1724. [DOI] [PubMed] [Google Scholar]
- 24.Inabnet WB, 3rd, Winegar DA, Sherif B, Sarr MG. Early outcomes of bariatric surgery in patients with metabolic syndrome: an analysis of the bariatric outcomes longitudinal database. J Am Coll Surg. 2012;214:550–556. doi: 10.1016/j.jamcollsurg.2011.12.019. discussion 556–557. [DOI] [PubMed] [Google Scholar]
- 25.Davalos A, Goedeke L, Smibert P, Ramirez CM, Warrier NP, Andreo U, et al. miR-33a/b contribute to the regulation of fatty acid metabolism and insulin signaling. Proceedings of the National Academy of Sciences of the United States of America. 2011;108:9232–9237. doi: 10.1073/pnas.1102281108. [DOI] [PMC free article] [PubMed] [Google Scholar]
- 26.He A, Zhu L, Gupta N, Chang Y, Fang F. Overexpression of micro ribonucleic acid 29, highly up-regulated in diabetic rats, leads to insulin resistance in 3T3-L1 adipocytes. Mol Endocrinol. 2007;21:2785–2794. doi: 10.1210/me.2007-0167. [DOI] [PubMed] [Google Scholar]
- 27.Pullen TJ, da Silva Xavier G, Kelsey G, Rutter GA. miR-29a and miR-29b contribute to pancreatic beta-cell-specific silencing of monocarboxylate transporter 1 (Mct1) Molecular and cellular biology. 2011;31:3182–3194. doi: 10.1128/MCB.01433-10. [DOI] [PMC free article] [PubMed] [Google Scholar]
- 28.Trajkovski M, Hausser J, Soutschek J, Bhat B, Akin A, Zavolan M, et al. MicroRNAs 103 and 107 regulate insulin sensitivity. Nature. 2011;474:649–653. doi: 10.1038/nature10112. [DOI] [PubMed] [Google Scholar]
- 29.Rong Y, Bao W, Shan Z, Liu J, Yu X, Xia S, et al. Increased microRNA-146a levels in plasma of patients with newly diagnosed type 2 diabetes mellitus. PLoS One. 2013;8:e73272. doi: 10.1371/journal.pone.0073272. [DOI] [PMC free article] [PubMed] [Google Scholar]
- 30.Zhang Q, Xiao X, Li M, Li W, Yu M, Zhang H, et al. miR-375 and miR-30d in the effect of chromium-containing Chinese medicine moderating glucose metabolism. J Diabetes Res. 2014;2014:862473. doi: 10.1155/2014/862473. [DOI] [PMC free article] [PubMed] [Google Scholar]
- 31.Xu Q, Li Y, Shang YF, Wang HL, Yao MX. miRNA-103: molecular link between insulin resistance and nonalcoholic fatty liver disease. World J Gastroenterol. 2015;21:511–516. doi: 10.3748/wjg.v21.i2.511. [DOI] [PMC free article] [PubMed] [Google Scholar]
- 32.Prabu P, Rome S, Sathishkumar C, Aravind S, Mahalingam B, Shanthirani CS, et al. Circulating MiRNAs of 'Asian Indian Phenotype' Identified in Subjects with Impaired Glucose Tolerance and Patients with Type 2 Diabetes. PLoS One. 2015;10:e0128372. doi: 10.1371/journal.pone.0128372. [DOI] [PMC free article] [PubMed] [Google Scholar]
- 33.Chuang TY, Wu HL, Chen CC, Gamboa GM, Layman LC, Diamond MP, et al. MicroRNA-223 Expression is Upregulated in Insulin Resistant Human Adipose Tissue. J Diabetes Res. 2015;2015:943659. doi: 10.1155/2015/943659. [DOI] [PMC free article] [PubMed] [Google Scholar]
- 34.Vienberg S, Geiger J, Madsen S, Dalgaard LT. MicroRNAs in Metabolism. Acta Physiol (Oxf) 2016 doi: 10.1111/apha.12681. [DOI] [PMC free article] [PubMed] [Google Scholar]
- 35.Cheng S, Rhee EP, Larson MG, Lewis GD, McCabe EL, Shen D, et al. Metabolite profiling identifies pathways associated with metabolic risk in humans. Circulation. 2012;125:2222–2231. doi: 10.1161/CIRCULATIONAHA.111.067827. [DOI] [PMC free article] [PubMed] [Google Scholar]
- 36.Batch BC, Shah SH, Newgard CB, Turer CB, Haynes C, Bain JR, et al. Branched chain amino acids are novel biomarkers for discrimination of metabolic wellness. Metabolism. 2013;62:961–969. doi: 10.1016/j.metabol.2013.01.007. [DOI] [PMC free article] [PubMed] [Google Scholar]
- 37.McCormack SE, Shaham O, McCarthy MA, Deik AA, Wang TJ, Gerszten RE, et al. Circulating branched-chain amino acid concentrations are associated with obesity and future insulin resistance in children and adolescents. Pediatr Obes. 2013;8:52–61. doi: 10.1111/j.2047-6310.2012.00087.x. [DOI] [PMC free article] [PubMed] [Google Scholar]
- 38.She P, Van Horn C, Reid T, Hutson SM, Cooney RN, Lynch CJ. Obesity-related elevations in plasma leucine are associated with alterations in enzymes involved in branched-chain amino acid metabolism. Am J Physiol Endocrinol Metab. 2007;293:E1552–E1563. doi: 10.1152/ajpendo.00134.2007. [DOI] [PMC free article] [PubMed] [Google Scholar]
- 39.Mittendorfer B, Volpi E, Wolfe RR. Whole body and skeletal muscle glutamine metabolism in healthy subjects. Am J Physiol Endocrinol Metab. 2001;280:E323–E333. doi: 10.1152/ajpendo.2001.280.2.E323. [DOI] [PMC free article] [PubMed] [Google Scholar]