Abstract
The adult human brain is arguably the most complex of biological systems. It contains 86 billion neurons (the information processing cells of the brain) and many more support cells. The neurons, with the assistance of the support cells, form trillions of connections creating complex, interconnected neural networks that support all human thought, feeling, and action. A challenge for modern neuroscience is to provide a model that accounts for this exquisitely complex and dynamic system. One fundamental part of this model is an account of how the human brain develops. This essay describes two important aspects of this developmental story. The first part of the story focuses on the remarkable and dynamic set of events that unfold during the prenatal period to give rise to cell lineage that form the essential substance of the brain, particularly the structures of the cerebral hemispheres. The second part of the story focuses on the formation of the major brain pathways of the cerebrum, the intricate fiber bundles that connect different populations of neurons to form the information processing systems that support all human thought and action. These two aspects of early brain development provide an essential foundation for understanding how the structure, organization, and functioning of the human brain emerge.
Keywords: neural progenitor cell, neuron, glial cells, oligodendrocyte, astrocyte, ependymal cell, microglia, neuronal cell death, synaptic pruning, magnetic resonance imaging (MRI), diffusion tensor imaging (DTI), white matter, gray matter, cortical thickness, cortical surface area
INTRODUCTION
Evolution has selected for a developmental process by which the exquisite structure of the human brain appears to unfold miraculously. These events seem to be precisely orchestrated by an invisible hand of a master biological artist assembling an intricately designed model. However, as we uncover the molecular and cellular interactions that drive these developmental processes, we recognize that the system is evolving over time via countless signals exchanged between cells and groups of cells in many local communities throughout the growing brain. These developmental events resemble the kinds of interactions that occur among people as they come and go from a rapidly growing and constantly changing frontier town. Structures are built, expanded, repurposed or torn down. Neighborhoods are added to meet functional demands, and modified or even abandoned in favor of more efficient systems as both stationary and migrating populations dynamically interact with each other and with their changing environments.
This essay considers the series of remarkable structural changes that, over time, give rise to the complex architecture of the mature human brain. It examines, first, the development of the cell lines that make up neural structures, and then the processes by which the circuits, pathways, and information processing networks of the human brain emerge.
THE MAJOR CELL TYPES OF THE HUMAN BRAIN AND THEIR FUNCTIONS
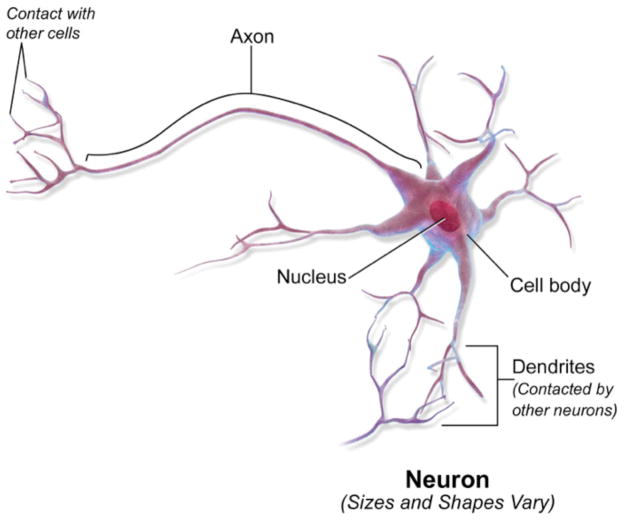
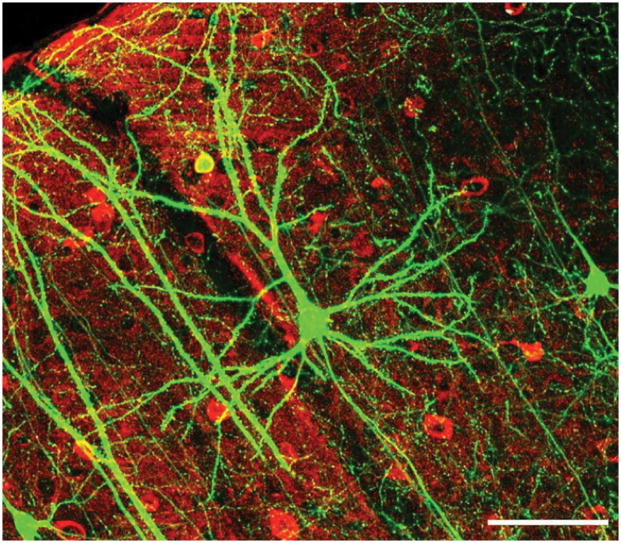
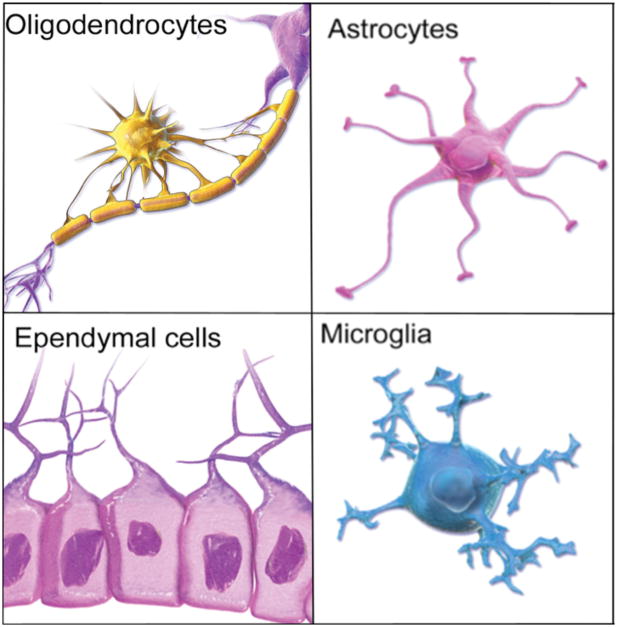
Mature human brains are made of two main types of cells: neurons and glial cells. Neurons define the information processing circuits of the brain, and fall into two broad categories: Excitatory projection neurons and inhibitory interneurons (see Figures 1 and 2), which play complementary roles in the regulation of brain signaling. Glial cells play a variety of roles in both the development and later functioning of these circuits. There are several macroglial cell populations: oligodentrocytes and oligodendrocyte precursor cells (OPCs), astrocytes, ependymal cells, and an important population of microglial cells (see Figure 3). The name given to this class of cells derives from a word meaning “glue”, which reflects the lack of early appreciation of the significance of these cells. Glial cell populations have historically been considered to be the “handymen and housekeepers” of the brain, supporting a variety of neural functions, repairing systems, and clearing away debris. However, recent evidence suggests much more complex roles for glial cell populations in the formation of neural circuitry. Finally, during development, another critically important class of cells is neural progenitor cells. These are cells that have the potential to generate many cell types, and are the source of all neurons and macroglial cells in the brain.
Figure 1.
Diagram of a prototypical projection neuron illustrating the cell body, and the neural processes, specifically the axon which can extend over substantial distances to make contact with other neurons and the dendrites which are a major site of contact with the incoming axons of other neurons. Blausen.com staff. “Blausen gallery 2014”. Wikiversity Journal of Medicine. DOI:10.15347/wjm/2014.010. ISSN 20018762. Creative Commons Attribution 2.5 Generic license.
Figure 2.
Coronal section of the neocortex containing projection neurons (visualized by green GFP staining) and interneurons (visualized by antibody staining in red). Scale bar: 100 μm. 22, Figure 6f, slightly altered (plus scalebar, minus letter “f”). Creative Commons Attribution 2.5 Generic
Figure 3.
The four major classes of glial cells. The macroglial cells are the oligodendrocytes which form myelin sheaths around the axons in the brain, astrocytes which perform a range of functions in the formation and maintenance of neural pathways as well as housekeeping functions and the ependymal cells which play an important role in the production of cerebral spinal fluid (CSF). Macroglial cells are derived from the neural progenitor cell line. Microglia are phagocytes that serve to clear waste but they also play important roles in the maturation of neural circuits. Blausen.com staff. “Blausen gallery 2014”. Wikiversity Journal of Medicine. Creative Commons Attribution 2.5 Generic license. DOI:10.15347/wjm/2014.010. ISSN 20018762. Blausen gallery 2014.
Neural progenitor cells
Neural progenitor cells are the first to be specified in brain development. During the third week after conception, the two-layered, flattened human embryo acquires a three-layered structure. The cells located along the midline of the upper layer receive molecular signals from other cells that induce them to differentiate into neural progenitor cells, the cells that will subsequently produce nearly all of the cells that make up the brain. By the end of the fourth week, the embryo undergoes dramatic transformation and begins to assume the familiar 3-dimensional shape of the emerging fetus. A major part of this transformation is the formation of the “neural tube” which is the first real neural structure (see Darnell and Gilbert, Neuroembrology, WIREs Dev Biology, and Power and Schlaggar, Neural plasticity across the lifespan, WIREs Dev Biology, also in the collection How We Develop). The neural progenitor cells line the inside wall of this tube establishing what will become “ventricular and subventricular zones,” the places where many neurons and neural support cells are born.
Neural progenitor cells give rise to most cells of the brain. The generation of the wide variety of cell types comes about via molecular signaling that promotes change in the fate of dividing cells. Following initial specification of the neural progenitor cells, those cells begin to divide symmetrically, producing two “daughter cells” that are identical copies of the original cell. Thus symmetrical cell division in the progenitor population serves to increase the size of the pool of neural progenitors.
Beginning at about 6 weeks gestational age in humans, some of the progenitors change their mode of cell division and begin to divide asymmetrically. During symmetrical cell division, both daughter cells receive identical molecular signals that preserve the characteristics of the parent cell in both offspring. However, during asymmetrical cell division, critical molecular signals are distributed asymmetrically within the dividing progenitor cell such that the two daughter cells receive different signals that promote divergent developmental paths and cell fates. In particular, one daughter cell receives molecular signals that preserve its fate as a progenitor cell, while the other receives different, “proneural” signals that result in its differentiation into a neuron. Thus, this form of asymmetrical cell division results in the preservation of one progenitor cell that will continue to divide and produce more cells, and one neuron that is no longer capable of cell division. Asymmetric cell division can also give rise to diversity within the progenitor population, by creating progenitors that can produce different kinds of daughter cells (e.g., different neuron types, glial cells, etc). This divergence in progenitor cell lineages is driven by extrinsically and intrinsically generated molecular signals.1 The distinctions among cell types appear to be related in an important way to the timing and location of the birth of the gradually diversifying progenitor cell lines, creating a cascade of changes in the progenitor population that gives rise to the increasing diversity of cell types in the developing brain.
One important type of molecular signal is morphogenic signaling. This type of signaling is crucial to the spatial patterning of the brain’s structure, that is, the specification of which neural cells will assume different roles and functions and migrate to different positions in the brain. Morphogens are signaling molecules that are secreted by cells and diffuse through tissue to create concentration gradients. The particular morphogenic signal a progenitor cell receives differs depending on the local concentrations of the morphogens. Morphogenic signals trigger the expression or repression of transcription factors within the cell receiving the signals, and this can affect its state and alter the specific types of cells it produces.
Neurons
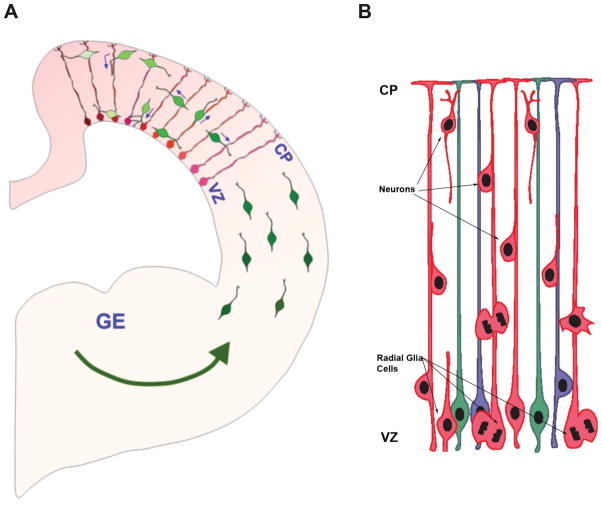
Immediately after closure of the neural tube, the neural progenitors multiply rapidly throughout the proliferative zones. As illustrated in Figure 4, there are two important proliferative zones in the brain, a more dorsally located zone in the higher regions of the brain, and a ventral zone located deep in the brain. The progenitors for excitatory projection neurons of the cerebral cortex are born in the dorsal proliferative zone, while excitatory neurons of the deep subcortical structures of the brain, as well as many of the brain’s inhibitory interneurons, are produced from precursors in the ventral proliferative zone.
Figure 4.
Migration patterns from the two primary neural proliferative zones. A. The Dorsal Proliferative System consists of the ventricular (VZ) and subventricular zones. Radial glial cells in the VZ are a major population of neural progenitor cells; they also extend a cellular process from the VZ to the cortical surface that serves as a kind of scaffold for migrating neurons. The ganglionic eminences (GE) make up the Ventral Proliferative zone. Interneurons (green) migrating into the cerebral wall from the GE interact with radial glia (red) and can exhibit changes in direction of migration after contacting radial glia. Interneurons can use radial glia as a scaffold upon which to migrate as they ascend to the cortical plate (CP) or descend in the direction of the ventricular zone (VZ). Particular orientation and morphological dynamics of migration may be associated with particular subsets of interneurons23 Creative Commons Attribution 2.5 Generic. B. Most of the projection neurons in the brain are produced in the VZ and an adjacent proliferative region called the SVZ (not shown). Radial glia progenitors produce neurons that then migrate to the neocortex via the radial glial scaffold. Malatesta and Gotz 24.
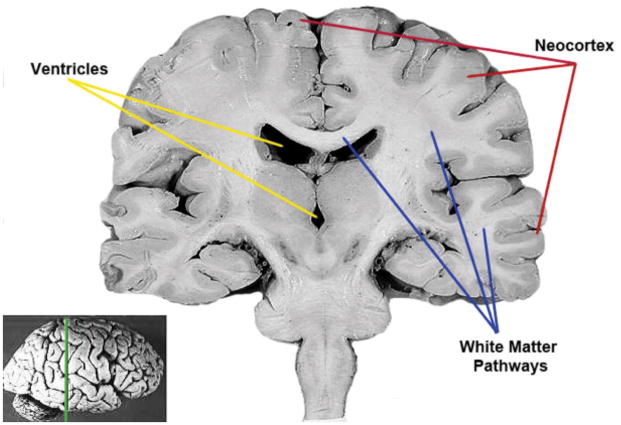
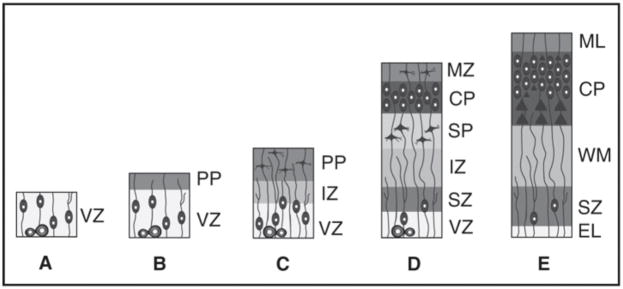
One of the most important information processing structures in the brain is the neocortex. The neocortex is a thin layer of cells (approximately 2–5 mm thick) that covers the surface of the brain, much like the rind of an orange (see Figure 5). The neocortex comprises six layers, each containing a unique complement of neurons and support cells. The cortical layers emerge in an orderly fashion during prenatal development. The projection neurons are “born” in the dorsal proliferative zone and migrate to their respective layers in an “inside-out” pattern, with the neurons of the deepest (6th) layer arriving first, followed by migration of neurons bound for the more superficial layers (see Figure 6). This orderly vertical pattern of neuron migration creates what has been called the “laminar”, or layered, structure of the neocortex. The cortical inhibitory interneurons, migrating tangentially toward their cortical targets from the ventral proliferative zones (see Figure 4), appear to require signals from the earlier arriving projection neurons to enter the cortex and assume their laminar positions 2.
Figure 5.
A. Coronal section (see reference of slice location on whole brain insert) of an adult human brain showing the gray and white matter compartments as well as the fluid filled ventricular cavities. The neocortex is the thin layer of cells covering the surface of the brain. White matter pathways run beneath the cortical surface. Deep gray matter nuclei serve as relay stations. John A Beal, PhD Dep’t. of Cellular Biology & Anatomy, Louisiana State University Health Sciences Center Shreveport. Creative Commons Attribution 2.5 Generic license.
Figure 6.
Cortical Plate Formation. A schematic representation of human neocortical development is shown. A. The VZ prior to the onset of neuronal migration contains symmetrically dividing progenitor cells. B. The first neurons to leave the VZ form a sparse preplate layer at the edge of the VZ (GW<7). C. Axons of the preplate neurons along with the axons projecting from subcortical areas, form the intermediate zone. D. The preplate is split into an outer MZ and a deeper subplate zone by the developing cortical plate (beginning GW7–8). E. In the mature cortex, only the cortical layers and the underlying white matter pathways are evident. VZ=ventricular zone, MZ=marginal zone, PP=preplate, SP=subplate, SZ=subventricular zone.
Once neurons arrive at and assume their positions in the developing neocortex, they begin to extend processes (axons and dendrites) that allow them to form connections (synapses) and communicate with other neurons, eventually establishing interconnected pathways and information processing networks. In some cases, axonal processes form short local connections to nearby neurons. In other cases, axons can extend over much greater distances, some as far as a meter or more. Neurons generate electrochemical signals that are transmitted along the axonal processes (acting much like a telephone wire) enabling communication among distinct and sometimes quite distant neuronal populations. The development of these signaling pathways is protracted, in come cases extending well into adolescence (see below).
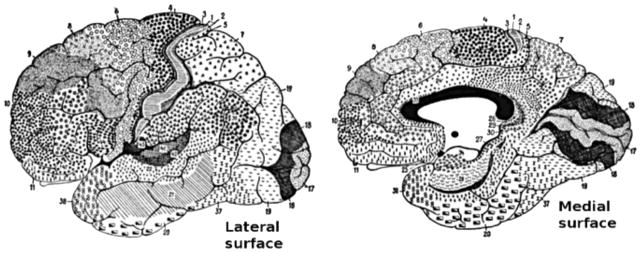
In addition to this vertical, laminar organization, the neocortex is also organized in the horizontal dimension into discrete functional areas that are distinguished by the types of neurons they contain, the specific pattern of connections they make, and the functions they carry out (See Figure 7 3). During neurogenesis, complex patterns of molecular signaling within the dorsal ventricular zone determine the initial “areal fate” of the cortical projection neurons (e.g., whether they will migrate anteriorly to brain areas that control motor functions and become motor neurons, posteriorly to visual areas to become visual neurons, or more laterally to auditory areas to become auditory neurons). This early specification of areal fate in neocortical neurons sets the stage for subsequent developmental changes that will eventually give rise to functionally distinct cortical regions. However, this very early fate specification is primitive and malleable. The full specification of a neuron as a motor or visual neuron depends upon many intervening developmental events that include both molecular signaling and input from the environment.
Figure 7.
This drawing shows the regions of the human cerebral cortex as delineated by Korvinian Brodmann on the basis of cytoarchitecture. Creative Commons Attribution 2.5 Generic license, modified by User:Looie496, original artist unknown but probably Brodmann - This image was made by modifying a scan of p 288 of the book “Anatomy of the Nervous System”, by Stephen Walter Ranson, W. B. Saunders, 1920.
Most of the neurons that make up the brain are generated prenatally. Exceptions include local interneurons of the cerebellum4, and a specialized class of large projection neuron located in the fronto-insular cortex and the anterior cingulate called von Economo neurons5. Both of these classes of neurons are produced early in the prenatal period. In addition two types of neurons continue to be produced through the life span. These include neurons of the olfactory bulb, a structure involved in smell, and the dentate gyrus of the hippocampus, an important memory structure. With these exceptions, neuron production is complete by midgestation. The completion of neurogenesis frees the neural progenitor population to produce other types of cells that are essential for brain organization and function, specifically, the macroglial cell populations.
Glial cell populations
There are three main types of macroglial cells - oligodendrocyes, astrocytes, and ependymal cells - all of which are derived from the neural progenitor cell population. In addition there is a population of microglial cells that derive from cells in the bone marrow but that colonize the embryonic brain very early. Each class of cells plays important roles in both the development of the brain and in its ongoing functioning.
Oligodendrocytes
Oligodendrocytes are important cells that, when mature, will extend “myelin sheaths” that wrap around neuronal axons. Myelin is a fatty substance that serves to insulate axonal fibers, dramatically improving conduction of electrochemical signals along them. The process of myelination unfolds over a long period of time. It begins before birth and extends well into the postnatal period. While myelin is evident in most brain regions by the end of the second year of life, there is evidence that myelination continues into the sixth decade of life6, 7. The progression of myelination is well documented. It begins in the basic sensory-motor pathways and progresses to pathways connecting multimodal brain regions.
At the end of cortical neurogenesis, the neural precursor cells stop generating neurons and begin to produce “intermediate glial precursor cells”. Some intermediate glial precursors are called oligodendrocyte precursor cells (OPCs). These cells will generate oligodendrocytes (others will produce astrocytes). Recent evidence suggests that OPCs born at different times may arise from different proliferative regions, with the first ones born in the subcortical (more ventral) zones, but the last precursors, born in the perinatal and postnatal periods, emanating primarily from the dorsal “cortical” proliferative zones8. OPC’s continue proliferating as they migrate to all parts of the developing brain, a process that extends for many years postnatally in humans. By birth, OPCs are distributed widely throughout the brain where they begin to differentiate into oligodendrocytes, and then rapidly begin to mature and myelinate axons in sensorimotor fiber tracts. Critically, however, the brain’s connecting fiber tracts are not fully myelinated for several decades, suggesting that OPCs may continue to mature into myelinating oligodendrocytes over a very protracted developmental time course in humans.
Astrocytes
Astrocytes are the most abundant macroglial cell type in the brain, substantially outnumbering neurons. Traditionally, the role of astrocytes was thought to be limited to structural support and basic housekeeping functions that serve to optimize the neuronal environment (e.g., maintaining ion and pH balance, clearing waste, delivering oxygen and glucose). More recently, the role of astrocytes in the dynamic regulation of neuron production, neural network organization, and modulation of neural activity has elevated their importance in understanding the development and mature functioning of the brain9, 10. An appreciation of the more varied role of astrocytes in neural structure and function has brought about an increased understanding of the dynamic nature of both brain development and later functioning. Neurons and astrocytes serving as “housekeepers” alone could not account for the complex processes that are observed. As Nedergaard has noted, “astrocytes provide not so much the glue of the neuronal network of the brain as its dynamic, self-organizing and auto-regenerative scaffold… Simply stated, astrocytes tell neurons what to do, besides just cleaning up their mess” 10. The critical functions of astrocytes begin early in development and extend through the lifespan.
As was the case with OPCs, the astrocyte precursor cells begin to emerge at the end of cortical neurogenesis as a specific line of intermediate glial precursor cells. Astrocyte numbers increase several-fold immediately after birth 11. These cells continue to elaborate and contribute to dynamic processes of neural circuit development, influencing both synapse formation and elimination as well as the morphology of dendritic spines 12. The astrocyte precursors continue proliferating as they migrate radially and tangentially to all parts of the developing brain, and, as was the case with OPCs, this process continues throughout late gestation and for many years postnatally in humans. Indeed, given the role of astrocytes in basic neural functions, astrocyte production likely extends throughout the lifespan.
Ependymal cells
Ependymal cells are a specialized class of cells located in the walls of the brain’s ventricular system. The ventricular system is an interconnected network of hollow cavities and tubes within the brain and spinal cord. The ventricular system originates in the hollow opening in the embryonic neural tube, and becomes elaborated across the course of fetal development. The ventricles are filled with a constantly recycled supply of cerebrospinal fluid (CSF). CSF provides buoyancy and cushions the brain from injury; it maintains chemical stability and serves to clear waste from the brain. The ependymal cells and capillary beds in the walls of the ventricular system comprise the choroid plexus, the source of much of the brain’s CSF. The ependymal cells also have small motile hair cells that move CSF through the system. Ependymal cells are derived from neural progenitor cells undergoing their final round of cell division during late embryogenesis.
In addition to these three major classes of macroglial cells, which are all derived from neural progenitors, there are also resident microglia in the brain that are not intrinsic neural cells but are of a different lineage derived from bone marrow. The routes and exact timing of the colonization of the brain by microglia are still poorly understood; it is clear, however, that microglia are present in widespread areas of the brain during the proliferation, differentiation, and migration of all classes of neural cells, and they have been observed to interact with the developing neural cells directly. Microglia appear to stake out surveillance territories throughout the nervous system in close interaction with the developing neural cells. Recent evidence suggests that microglia may play a critical role in maturation of neural circuits, for instance, by pruning excessive and unnecessary cells and synapses, as they have been observed to engulf and remove neuronal processes and newborn neural cells 13.
Birth and death of cells and connections
We end this section on cells with a word about a surprising but important fact: Nearly half of all the billions of cells and trillions of connections that are produced in the developing brain are systematically eliminated, either by a regulated process of cell death (called apoptosis) or by pruning of connections. Early in the development of the human brain, there is an initial dramatic overproduction of brain cells of many types followed by apoptosis of a large portion of those cells. The surviving cells also establish many more connections than will survive, and these connections are pruned back over an extended postnatal period as synapses and dendritic and axonal arbors are thinned 14(see review by Low and Cheng, 2006). These regressive processes are still not fully understood but appear to involve competition for trophic factors (substances that promote cell growth and survival) and activity-dependent selection of connections.
Apoptosis occurs in the prenatal period and is observed within both neuronal and neural precursor populations. A number of functions have been ascribed to the cell death phenomena. These range from a form of error correction, to the elimination of transient cell populations that serve a specific but time-delimited role in development, to, most importantly, the regulation of cell numbers within a neural circuit that optimizes the pattern of connectivity between neurons, their efferent targets and their afferent inputs 15. Synaptic exuberance and subsequent pruning are largely postnatal events that extend through childhood into adolescence. There is considerable evidence that neurons initially receive widespread synaptic inputs, and that synapse elimination serves to sharpen and stabilize neural circuitry. Both activity-dependent and activity-independent factors contribute to these dynamic processes (see Power and Schlaggar, Neural plasticity across the lifespan, WIREs Dev Biology, also in the collection How We Develop) (see Schlagger these essays). Beyond these early regressive events, recent evidence suggests that well into adolescence, dynamic changes continue in the patterns of connectivity between excitatory and inhibitory neurons, and in their interactions with other brain cells 16. These processes continuously remodel the neural circuitry, reflecting the dynamic, protracted and activity-dependent nature of brain development.
IMAGING THE DEVELOPING HUMAN BRAIN
Since information about the construction of the brain at the cellular level comes mostly from animal models, we still have limited understanding of the nature and time course of maturation and remodeling of connectivity in the brains of children (note: we use the term maturation to refer to the emerging stability of dynamically and adaptively developing neural systems, rather than the kinds of deterministic constructs associated with the term in older biological models). However, noninvasive neuroimaging techniques have provided a window on the developing brain and have in some cases yielded surprising new information. Furthermore, new technologies continue to emerge that allow us to measure change in brain architecture and tissue biology with greater sensitivity across childhood and adolescence.
At a very general level the brain contains gray matter, white matter, and fluid compartments. Gray matter compartments contain concentrations of neurons along with other support cells and appear gray in brain sections (see Figure 5). White matter contains the myelinated fiber pathways that connect groups of neurons and appear white in brain sections. The ventricular system in the brain contains cerebral spinal fluid. The signals recorded during Magnetic Resonance Imaging (MRI) differ markedly depending on tissue type, thus allowing for the differentiation of the brain’s gray matter, white matter, and fluid. With development, the distribution of signals from these three types of tissue changes providing insight into patterns of developmental change in the brain’s architecture.
MRI studies reveal dramatic changes in the tissues of the developing brain during the postnatal brain growth spurt. These changes presumably reflect many of the postnatal processes outlined above: the continuing proliferation of progenitors and maturation of oligodendrocytes and astrocytes, as well as increases in the brain’s microglial population; the overproduction of connections and synapses followed by selective pruning; and the ongoing myelination of axons. MR imaging provides information about the timing and anatomical distribution of these processes, especially the deposition of myelin by the maturing oligodendrocytes, since myelination has strong effects on tissue contrast in MR images 17. Just after birth, MRI evidence of early myelination (specific signal change in the tissue) first appears in the sensorimotor pathways that connect the sense organs to their primary targets in the cerebral cortex, and in the fiber tracts that connect the two cerebral hemispheres to each other. Later these changes gradually spread throughout the white matter, as other fiber tracts from deep gray matter structures to the cortex and tracts connecting different areas of the cortex to each other become fully myelinated.
The earliest MRI morphometric studies (i.e., measuring tissue volumes and brain shape) comparing children and adults revealed that gray matter volumes in the cerebral cortex and subcortical nuclei appeared considerably larger in school-aged children than in young adults 18. MRI measurements indicated that brain volume increases dramatically in the first decade after birth but very little thereafter. This leveling off reflects the net effects of waning progressive changes that are associated with continuing maturation of cell populations and opposing regressive changes, perhaps associated with “pruning” of neuronal processes. These observations are consistent with histological (i.e., microscopic study of tissue) evidence of ongoing myelination across this period, and evidence of reduction of synaptic density in cortex during childhood. Nonetheless, it remains unclear to what extent these factors, or other tissue changes that occur concurrently, contribute to the changing morphology observed with MRI.
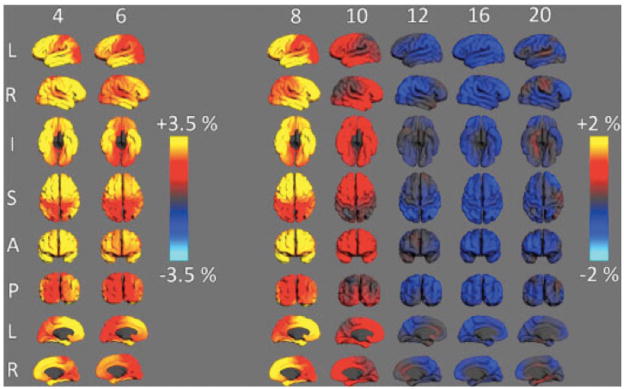
Methods for examining the changing large-scale architecture of the cortex in developing children have advanced in recent years. In the largest MRI study of developing children using these methods, over 1000 typically developing individuals between 3 and 20 years of age were examined in the Pediatric Imaging, Neurocognition, and Genetics (PING) study 19. Data from the PING study suggest that the time course of change in cortical surface area and cortical thickness are very distinct. Age-related change in cortical surface area and thickness are illustrated in the maps of annualized rate of change shown in Figures 8 and 9. As Figure 8 shows, there is significant expansion of cortical surface area during preschool ages and early school age years. By 4 years of age, the greatest changes in surface area are occurring within cortical regions responsible for high-level cortical functions such as prefrontal cortex (e.g., planning, language) and temporoparietal association areas (e.g., visuospatial processing, language); still increasing but to a lesser extent are surface areas of primary sensory (visual, auditory) and sensorimotor cortex. By the 10th year, some cortical regions begin to show decreases in surface area, especially within occipital and superior parietal lobes; however, continued cortical area expansion still occurs in other regions. From 10 to 16 years, the balance between contracting and late expanding areas shifts further until cortical surface area contraction is present throughout almost the entire cortex. These data show clearly that the peak of total cortical surface area at around 10 years represents the net effect of waning expansion in some regions and early contraction in others.
Figure 8.
Annualized rate of cortical expansion at different ages. Maps above show different views of the cerebral cortex and the color codes for the estimated rate of expansion (warm colors) or contraction (blue). Note that in some areas of the cortex of 4–6 year olds, the cortical surface is expanding at a rate above 3.5% per year. In older children expansion decelerates and gives way to modest levels of surface area contraction. Measured in the PING sample and described in 25.
Figure 9.
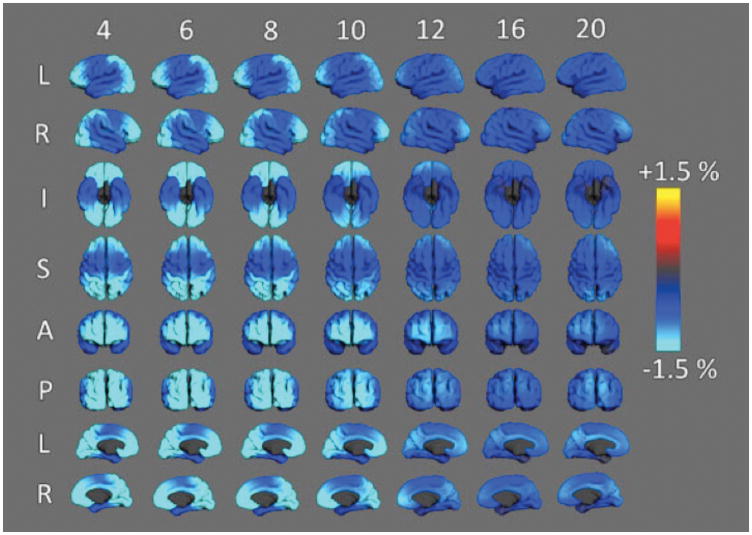
Annualized rate of apparent thinning of the cortex on MRI. Maps above show different views of the cerebral cortex and the color codes for the estimated rate of thinning. Note that in some areas of the cortex of 4–10 year olds, the cortex appears to think at a rate above 1.5% per year. In older children age-related thinning continues but at a more modest rate. Measured in the PING sample and described in Jernigan et al., 2015 26.
Cortical thickness, unlike cortical surface area, shows no developmental increase at any point across this age range. In fact, apparent cortical thickness (as measured with MRI) decreases continuously throughout the cortex from age 3 into young adulthood (Figure 9), with the rate of thinning appearing to slow slightly with age.
Unfortunately, it is still difficult to link these protracted developmental changes in cortical architecture to any specific postnatal cellular processes, either those described above or others not yet discovered. One important question is how the changes in surface area and thickness of the cortex relate to ongoing myelination of axons in fiber tracts. The cortex may appear to thin on MRI because of increased myelination in the white matter tracts coursing within and near the deepest layer of cortex. Myelin production, by increasing the volume of the brain, may contribute to expansion of cortical surface area. Changes in dendritic and synaptic density may also contribute to these measurable developmental changes in the cortex, or to similar changes in size and shape of subcortical structures. Continuing development of new imaging methods is shedding some light on these questions.
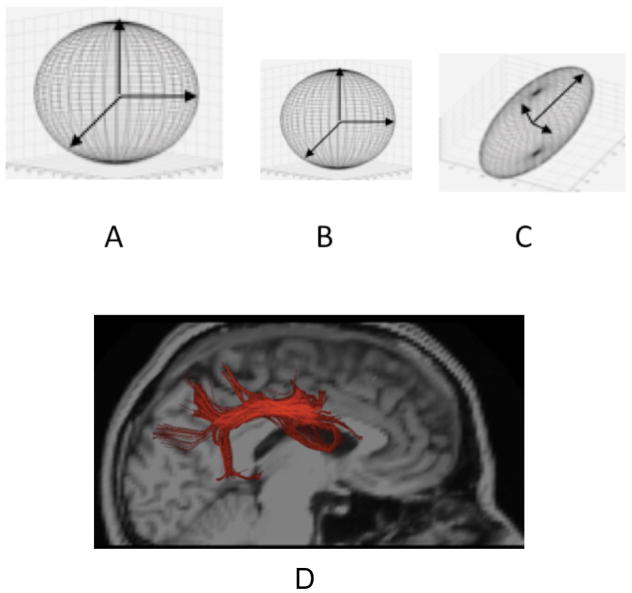
Although myelination is not directly measurable, a specialized MRI technique called diffusion weighted imaging (DWI) reveals ongoing maturation of fiber tracts 20. DWI measures the diffusivity, or movement, of protons in water molecules in brain tissue. Several measures derived with this method exhibit strong age dependence during postnatal development, because age-related changes in tissue microstructure systematically alter the behavior of diffusing protons. A common use of DWI involves measuring the degree to which diffusion is occurring freely within the tissue (diffusivity) and the degree to which the diffusion occurs disproportionately in a particular direction (anisotropy). Researchers refer to this method as diffusion tensor imaging (DTI) (see Figure 10). The method reveals that in fluid-filled areas in the brain, not surprisingly, diffusivity of water molecules is high and shows little directionality, that is, the protons diffuse rapidly and randomly in the fluid, like a drop of dye in water (Figure 10A). Diffusivity in gray matter is lower because cellular structures impede the movement of the diffusing protons, but diffusion is still relatively isotropic; that is, there is little net directionality to the diffusion, like a drop of dye in oatmeal (Figure 10B).
Figure 10.
Diffusion Tensors: A: Illustration of tensor from region with high isotropic diffusivity, as in cerebrospinal fluid. B: Tensor exhibiting isotropic, but lower diffusivity, as in gray matter. C: Elongated tensor exhibiting anisotropy, as in fiber tracts. D. Illustration of tractography of the superior longitudinal fasciculus (a major fiber tract connecting posterior with frontal parts of the cortex) shown in red.
Although in mature white matter diffusivity is also low, the rate of diffusion is higher along the long axis of fiber bundles because the highly linear structure of the coherently oriented axons leads to less restriction of the diffusing protons along this long axis than in other directions, like a drop of dye on a pile of cooked spaghetti. This asymmetrical restriction of movement produces what is called diffusion anisotropy. Fractional anisotropy (FA) is a measure of this kind of directionality. High FA is illustrated in the elongated structure shown in Figure 10C. Analyses of these measures of FA throughout the brain, reflecting changes in the spatial orientation of diffusion, have been used to trace the course of fiber tracts. These methods, referred to as tractography, allow investigators to locate known fiber tracts in the brain so that they can be measured. They have also been used to estimate the degree of apparent structural connection between regions. Figure 10D provides an example of pathway mapping using tractography in the data from one individual. Red streamlines show regions within the scan denoting the superior longitudinal fasciculus (SLF), a white matter fiber tract that connects posterior temporal and parietal brain regions to frontal regions.
Postnatally, diffusivity declines dramatically in the brain in a widespread anatomical distribution that includes both gray and white matter structures. Diffusivity in white matter of human newborns is high, and exhibits low directionality (FA). As the fiber tracts mature, and myelination proceeds, diffusivity declines, and FA increases, with diffusivity increasingly oriented parallel to the fiber bundles. Thus this kind of MR imaging allows us to monitor developmental change in the biology of the brain’s connecting pathways noninvasively in children. The denser packing of cells and their axons, in part associated with growth of tightly wrapped myelin sheaths and increasing axon diameters, reduces the fluid-filled extracellular spaces, which contributes to the observed decline in diffusivity. Since water molecules diffuse more randomly in these extracellular spaces, reducing this water also reveals more clearly the linearly oriented fiber bundles.
Changes in diffusion parameters continue throughout childhood and adolescence in a regionally varying pattern. For example, FA reaches adult levels earlier in long projection fibers (the major fiber pathways that connect cortical and subcortical regions of the brain) and commissural fibers (the large fiber bundles connecting the two brain hemispheres) than in association fibers (the fiber pathways that interconnect cortical regions, also called cortico-cortical pathways). Some cortico-cortical tracts continue to exhibit age-related FA increases well into the third decade. Although less often a focus of developmental studies than changes in fiber tracts, age-related decreases in diffusivity and increases in FA are also measurable in most deep gray matter structures. The biological mechanisms that underlie these gray matter changes in diffusivity are not well understood, but investigators have speculated that changing cell density or cell connections might play a role.
Importantly, although we cannot measure specific cellular mechanisms directly with these developmental MRI signals, there is strong accumulating evidence that some of the individual differences that we observe among children in their developing functional abilities are associated with differences in these MRI parameters, and, further, that these associations appear to be specific to the neural circuitry that mediates the functions 21. These associations are likely to reflect functionally relevant differences among children in the neural connectivity in their brains, differences in the pace of biological maturation of neural circuits, or a combination of these factors. Similarly, the associations may reflect genetic factors, effects of experience on the biology of the brain, or both. A better explanation for these relationships is the goal of much ongoing work with noninvasive imaging in children.
In summary, developmental neurobiology has provided much exciting information about the progression of brain development, but we still have not defined the nature and timelines of the processes by which the full complement of brain cells assume the structure and organization of maturely functioning neural circuits in the human brain. Thus, many critically important questions remain about the structural development of the human brain. More definitive information about the cellular alterations that underlie the developmental signals now measurable with noninvasive imaging would be extremely useful. Such links between changes that can be monitored in the living human brain and details of the underlying neural circuitry would provide a firmer basis for new mechanistic models to account for the concurrent neurophysiological and behavioral changes we observe in developing children. Deeper understanding of the means by which the human nervous system extracts meaning from and adapts to its experiences may reveal new strategies for intervening when development goes awry.
CONCLUDING POINTS
A pool of neural progenitor cells that appears only 3 weeks after conception will ultimately produce all of the other cell types in the brain (except the microglia), but these different cell lines emerge in response to different molecular signals, from different regions in the proliferative zone, and at different times.
During development a general principle is that cells, and later connections between cells, are produced in much greater numbers than the numbers of surviving cell populations and connections, and the pruning back is essential for normal function of the neural circuits they form.
Because most of what we know about how brains are constructed comes from the study of other mammals (most often rodents), this leaves many questions about the time course of the events occurring during postnatal brain development in children.
Nevertheless, noninvasive imaging provides a compelling view of the developing brain, and this view reveals that the human brain, and its connectivity in particular, continues to mature well into adulthood.
Human developmental neuroscience reveals that behavioral differences among developing children often map onto differences measurable with brain imaging.
Implications.
Brain development is an incredibly complex process that involves many elements and processes that interact over time contributing to progressive change at all levels of the emerging neural system. This is a view of neural development anchored in the process of development itself, with each step influenced by myriad cues arising from multiple levels of the expanding neural system. None of these factors acts in isolation to determine developmental outcome. Rather, each contributes to the many complex and multifaceted processes that underlie the ongoing progress of brain development. This model has important implications for our understanding of both typical and atypical development. As we more closely map brain development to behavior, we will learn when brain developmental events are biasing functional development toward adverse outcomes, and ultimately how we might best intervene, either to prevent these events or to adapt the environment of the child to avert the negative outcomes.
Acknowledgments
This work was supported by grants from the National Institute on Drug Abuse and the Eunice Kennedy Shriver National Institute for Child Health and Human Development: RC2DA029475 and R01HD061414, and the Lundbeck Foundation: R32-A3161. The author would also like to acknowledge the support of the UCSD Kavli Institute for Brain and Mind.
Contributor Information
Terry L. Jernigan, University of California, San Diego
Joan Stiles, University of California, San Diego.
BIBLIOGRAPHY
- 1.Kriegstein A, Alvarez-Buylla A. The glial nature of embryonic and adult neural stem cells. Annu Rev Neurosci. 2009;32:149–184. doi: 10.1146/annurev.neuro.051508.135600. [DOI] [PMC free article] [PubMed] [Google Scholar]
- 2.Lodato S, Rouaux C, Quast KB, Jantrachotechatchawan C, Studer M, Hensch TK, Arlotta P. Excitatory projection neuron subtypes control the distribution of local inhibitory interneurons in the cerebral cortex. Neuron. 2011;69:763–779. doi: 10.1016/j.neuron.2011.01.015. [DOI] [PMC free article] [PubMed] [Google Scholar]
- 3.Brodmann K. Vergleichende Lokalisationslehre der Grosshirnrinde in ihren Prinzipien Dargestellt auf Grund des Zellenbaues. Leipzig, Germany: J.A. Barth; 1909. [Google Scholar]
- 4.Carletti B, Rossi F. Neurogenesis in the cerebellum. Neuroscientist. 2008;14:91–100. doi: 10.1177/1073858407304629. [DOI] [PubMed] [Google Scholar]
- 5.Allman JM, Tetreault NA, Hakeem AY, Park S. The von Economo neurons in apes and humans. Am J Hum Biol. 2011;23:5–21. doi: 10.1002/ajhb.21136. [DOI] [PubMed] [Google Scholar]
- 6.Yakovlev PI, Lecours AR. The myelogenetic cycles of regional maturation of the brain. In: Mankowski A, editor. Regional Development of the Brain in Early Life. Philadelphia: Davis; 1967. pp. 3–69. [Google Scholar]
- 7.Benes FM, Turtle M, Khan Y, Farol P. Myelination of a key relay zone in the hippocampal formation occurs in the human brain during childhood, adolescence, and adulthood. Arch Gen Psychiatry. 1994;51:477–484. doi: 10.1001/archpsyc.1994.03950060041004. [DOI] [PubMed] [Google Scholar]
- 8.Richardson WD, Kessaris N, Pringle N. Oligodendrocyte wars. Nat Rev Neurosci. 2006;7:11–18. doi: 10.1038/nrn1826. [DOI] [PMC free article] [PubMed] [Google Scholar]
- 9.Lee KM, MacLean AG. New advances on glial activation in health and disease. World J Virol. 2015;4:42–55. doi: 10.5501/wjv.v4.i2.42. [DOI] [PMC free article] [PubMed] [Google Scholar]
- 10.Nedergaard M, Ransom B, Goldman SA. New roles for astrocytes: redefining the functional architecture of the brain. Trends Neurosci. 2003;26:523–530. doi: 10.1016/j.tins.2003.08.008. [DOI] [PubMed] [Google Scholar]
- 11.Ge WP, Miyawaki A, Gage FH, Jan YN, Jan LY. Local generation of glia is a major astrocyte source in postnatal cortex. Nature. 2012;484:376–380. doi: 10.1038/nature10959. [DOI] [PMC free article] [PubMed] [Google Scholar]
- 12.Clarke LE, Barres BA. Emerging roles of astrocytes in neural circuit development. Nat Rev Neurosci. 2013;14:311–321. doi: 10.1038/nrn3484. [DOI] [PMC free article] [PubMed] [Google Scholar]
- 13.Tremblay ME, Stevens B, Sierra A, Wake H, Bessis A, Nimmerjahn A. The role of microglia in the healthy brain. J Neurosci. 2011;31:16064–16069. doi: 10.1523/JNEUROSCI.4158-11.2011. [DOI] [PMC free article] [PubMed] [Google Scholar]
- 14.Low LK, Cheng HJ. Axon pruning: an essential step underlying the developmental plasticity of neuronal connections. Philos Trans R Soc Lond B Biol Sci. 2006;361:1531–1544. doi: 10.1098/rstb.2006.1883. [DOI] [PMC free article] [PubMed] [Google Scholar]
- 15.Buss RR, Sun W, Oppenheim RW. Adaptive roles of programmed cell death during nervous system development. Annu Rev Neurosci. 2006;29:1–35. doi: 10.1146/annurev.neuro.29.051605.112800. [DOI] [PubMed] [Google Scholar]
- 16.Hoftman GD, Lewis DA. Postnatal developmental trajectories of neural circuits in the primate prefrontal cortex: identifying sensitive periods for vulnerability to schizophrenia. Schizophr Bull. 2011;37:493–503. doi: 10.1093/schbul/sbr029. [DOI] [PMC free article] [PubMed] [Google Scholar]
- 17.Barkovich AJ. Magnetic resonance techniques in the assessment of myelin and myelination. J Inherit Metab Dis. 2005;28:311–343. doi: 10.1007/s10545-005-5952-z. [DOI] [PubMed] [Google Scholar]
- 18.Toga AW, Thompson PM, Sowell ER. Mapping brain maturation. Trends Neurosci. 2006;29:148–159. doi: 10.1016/j.tins.2006.01.007. [DOI] [PMC free article] [PubMed] [Google Scholar]
- 19.Brown TT, Kuperman JM, Chung Y, Erhart M, McCabe C, Hagler DJ, Jr, Venkatraman VK, Akshoomoff N, Amaral DG, Bloss CS, et al. Neuroanatomical assessment of biological maturity. Curr Biol. 2012;22:1693–1698. doi: 10.1016/j.cub.2012.07.002. [DOI] [PMC free article] [PubMed] [Google Scholar]
- 20.Cascio CJ, Gerig G, Piven J. Diffusion tensor imaging: Application to the study of the developing brain. J Am Acad Child Adolesc Psychiatry. 2007;46:213–223. doi: 10.1097/01.chi.0000246064.93200.e8. [DOI] [PubMed] [Google Scholar]
- 21.Stiles J, Brown TT, Haist F, Jernigan T. Brain and cognitiive development. In: Lerner RM, Liben LS, Mueller U, editors. Handbook of Child Psychology and Developmental Neuroscience, Cognitive Proceses. Vol. 7. Hoboken, NJ: Wiley; 2015. pp. 9–62. [Google Scholar]
- 22.Lee WC, Huang H, Feng G, Sanes JR, Brown EN, So PT, Nedivi E. Dynamic remodeling of dendritic arbors in GABAergic interneurons of adult visual cortex. PLoS Biol. 2006;4:e29. doi: 10.1371/journal.pbio.0040029. [DOI] [PMC free article] [PubMed] [Google Scholar]
- 23.Yokota Y, Gashghaei HT, Han C, Watson H, Campbell KJ, Anton ES. Radial glial dependent and independent dynamics of interneuronal migration in the developing cerebral cortex. PLoS One. 2007;2:e794. doi: 10.1371/journal.pone.0000794. [DOI] [PMC free article] [PubMed] [Google Scholar]
- 24.Malatesta P, Gotz M. Radial glia - from boring cables to stem cell stars. Development. 2013;140:483–486. doi: 10.1242/dev.085852. [DOI] [PubMed] [Google Scholar]
- 25.Jernigan TL, Brown TT, Hagler DJ, Jr, Akshoomoff N, Bartsch H, Newman E, Thompson WK, Bloss CS, Murray SS, Schork N, et al. The Pediatric Imaging, Neurocognition, and Genetics (PING) Data Repository. Neuroimage. 2015 doi: 10.1016/j.neuroimage.2015.04.057. [DOI] [PMC free article] [PubMed] [Google Scholar]
- 26.Jernigan TL, Brown TT, Hagler DJ, Jr, Akshoomoff N, Bartsch H, Newman E, Thompson WK, Bloss CS, Murray SS, Schork N, et al. The Pediatric Imaging, Neurocognition, and Genetics (PING) Data Repository. Neuroimage. 2016;124:1149–1154. doi: 10.1016/j.neuroimage.2015.04.057. [DOI] [PMC free article] [PubMed] [Google Scholar]
FURTHER READING
- Jernigan TL, Baaré WF, Stiles J, Madsen KS. Postnatal brain development: structural imaging of dynamic neurodevelopmental processes. In: Braddick O, Atkinson J, Innocenti GM, editors. Progress in Brain Research, volume 189, Gene Expression to Neurobiology and Behavior: Human Brain Development and Developmental Disorders. Burlington: Academic Press; 2011. pp. 77–92. [DOI] [PMC free article] [PubMed] [Google Scholar]
- Nadarajah B, Parnavelas JG. Modes of neuronal migration in the developing cerebral cortex. Nat Rev Neurosci. 2002;3(6):423–432. doi: 10.1038/nrn845. [DOI] [PubMed] [Google Scholar]
- Valiente M, Marin O. Neuronal migration mechanisms in development and disease. Curr Opin Neurobiol. 2010;20(1):68–78. doi: 10.1016/j.conb.2009.12.003. [DOI] [PubMed] [Google Scholar]


