

Abstract
Sub-minimum inhibiting concentrations (sub-MICs) of antibiotics frequently occur in natural environments owing to wide-spread antibiotic leakage by human action. Even though the concentrations are very low, these sub-MICs have recently been shown to alter bacterial populations by selecting for antibiotic resistance and increasing the rate of adaptive evolution. However, studies are lacking on how these effects reverberate into key ecological interactions, such as bacteria–phage interactions. Previously, co-selection of bacteria by phages and antibiotic concentrations exceeding MICs has been hypothesized to decrease the rate of resistance evolution because of fitness costs associated with resistance mutations. By contrast, here we show that sub-MICs of the antibiotic streptomycin (Sm) increased the rate of phage resistance evolution, as well as causing extinction of the phage. Notably, Sm and the phage in combination also enhanced the evolution of Sm resistance compared with Sm alone. These observations demonstrate the potential of sub-MICs of antibiotics to impact key ecological interactions in microbial communities with evolutionary outcomes that can radically differ from those associated with high concentrations. Our findings also contribute to the understanding of ecological and evolutionary factors essential for the management of the antibiotic resistance problem.
This article is part of the themed issue ‘Human influences on evolution, and the ecological and societal consequences’.
Keywords: experimental evolution, sublethal antibiotic concentrations, antibiotic resistance, phage resistance, Pseudomonas fluorescens, phage Φ2
1. Introduction
The increasing occurrence of antibiotic resistant bacteria has ushered in a global crisis in public health and agriculture, both of which depend on the use of antibiotics as antibacterial agents [1–3]. The misuse of antibiotics and their leakage into the environment constitute a prime example of how human activities change the selection landscape of natural populations (this and other examples are discussed at length in several articles in this issue, e.g. [4–6]). Previously, antibiotic resistance in bacteria has been primarily assessed by determining minimum inhibitory concentrations (MICs) of antibiotics that inhibit the visual growth of bacteria after overnight culture. However, it has recently been proposed that concentrations of antibiotics below MICs (sub-MICs), found in many natural environments mainly owing to their extensive use in food production, play an important role in increased antibiotic resistance evolution [7–10]. In addition, investigations have thus far revealed a number of other ecological and evolutionary effects that sub-MICs of antibiotics have on bacteria. These include elevated rates of mutagenesis [11–16], horizontal gene transfer [17,18] and recombination [19], as well as effects antibiotics cause as signalling molecules in quorum sensing [20], biofilm formation [21] and virulence [22,23]. However, studies are lacking on whether and how these effects of sub-MICs of antibiotics on bacterial populations alter important evolutionary and ecological interactions in multispecies communities.
A key ecological interaction in microbial communities is the interaction between bacteria and lytic phages (i.e. viral parasites) that are highly abundant in natural communities [24]. In addition to being a major cause of bacterial mortality, phages cause selection pressure that acts as a fundamental driver of bacterial evolution, especially through coevolutionary dynamics [25,26]. Phage resistance has been shown to be commonly associated with a fitness cost seen as lowered competitive ability [27–29]. Likewise, antibiotic resistance mutations frequently cause a reduction in bacterial fitness in the absence of antibiotics [7,30–32]. These factors have prompted the hypothesis that fitness costs associated with resistance against both phage and antibiotic decrease the rate of antibiotic/phage resistance evolution under co-selection [33–40]. However, sub-MICs of antibiotics might affect the overall rate of adaptive evolution—through increasing mutation rates or causing competition between mutations for resistance against phage or antibiotics—as well as basic physiological and morphological properties of bacteria, all of which can alter the outcome of bacteria–phage interactions. For example, it has recently been demonstrated that in the presence of phages, the growth ability cost of antibiotic resistance is small compared with the benefits of an increased mutation rate [41]. These dynamics might especially apply to sub-MIC antibiotic selection that is strongly associated with low-fitness-cost antibiotic resistance mutations and commonly results in an increased mutation rate [8]. A heightened mutation rate coupled with low-fitness-cost antibiotic resistance mutations might also alleviate the ecological effect of lytic phages that initially strongly reduce bacterial population size, allowing bacterial populations to recover more rapidly compared with phage-alone environments. In this scenario, instead of an adaptive trade-off resulting in decreased resistance evolution, resistance may actually evolve more rapidly.
Here, we employed an experimental evolution approach to study the effect of sub-MICs of streptomycin (Sm) on interactions between the bacterium Pseudomonas fluorescens and its lytic phage Φ2. Our prediction was that resistance evolution would decrease under co-selection by Sm and phage owing to fitness costs associated with resistance against either agent. Surprisingly, we found instead increased resistance evolution under co-selection, as well as indications that this may be associated with increased mutation rate. Together our findings demonstrate that sub-MICs of antibiotics can strongly impact bacteria–phage interaction, and that the ecological and evolutionary effects may be different from those expected under selection by high antibiotic concentrations.
2. Material and methods
(a). Strains and culture conditions
As the bacterial host species, we used Pseudomonas fluorescens SBW25 [42], and as the viral parasite, the lytic bacteriophage SBW25Φ2 [43]. We followed standard protocols for microcosm experiments with bacteria–phage systems [43–49]. The culture medium for bacteria contained M9 salts and King's B (KB) nutrients at a 5% concentration compared with full-strength medium (concentrations used: 1 g peptone number 3 and 0.5 ml of 85% glycerol in 1 l of dH2O). The medium was used at a diluted concentration (5%) for experimental conditions to more closely resemble the resource levels found in natural environments compared with full-strength medium highly enriched with nutrients. All media and microcosm vials were sterilized by autoclaving prior to use and were kept at 28°C (±0.1°C) during the experiments.
(b). Effect of sub-minimum inhibiting concentrations of streptomycin on phage resistance evolution
To test the effect of sub-MICs of Sm on phage resistance evolution, we conducted a 66-day microcosm experiment, representing approximately 380 P. fluorescens generations. We had a full factorial experimental design with two treatments. First, an antibiotic treatment, 0, 0.2 and 2 µg ml–1 Sm treatments (0.2 and 2 µg ml–1 represent roughly 1% and 10% of MIC, respectively), and second, a phage treatment (phage present/absent). All treatments were started from a single colony of P. fluorescens (cultured overnight in KB). The initial Pseudomonas density was approximately 107 colony forming units (CFU) ml–1 and phage density approximately 105 plaque forming units (PFU) ml–1. All treatments were replicated three times in 25 ml glass vials containing 6 ml KB. Every 48 h, 1% (60 µl) of each culture was transferred to a new vial containing fresh KB. Bacterial and phage abundances were estimated with a previously described optical density based method [44] and plaque assay (from freeze-stored samples) [50], respectively. The ancestral bacterium was used in the plaque assay, because even in the case of evolution in the phage, more than 95% of phages retain the ability to infect the ancestral bacterium in this system [50,51], causing a potential underestimation of phage density to be negligible. A 0.5 ml subsample was frozen with 0.5 ml of 30% glycerol and kept at –80°C for later analysis.
We isolated 16 bacterial clones per population from freeze-stored samples, and estimated their phage resistance using a modified version of a streak test commonly used in bacteria–phage studies (e.g. [46,52–54]). We first cultured each thawed clone overnight in KB (in 96-well plates, each well containing one clone) and then used a 96-well pin replicator [55] to replicate approximately 10 µl samples to a large (150 mm) Petri dish containing PPY (20 g proteose peptone and 2.5 g yeast extract in 1 l deionized H2O) agar and a thin layer of soft agar with ancestral phage at a high density. The ability to form visible colonies (indicating resistance) was evaluated for each clone after 24 h. All samples were also transferred to plates without the phage to control for the presence of bacteria. In addition, we evaluated the evolution of Sm resistance using an MIC strip test (protocol in the electronic supplementary material). Briefly, bacteria (20 clonal cultures from each experimental population at day 66 of the experiment) cultured overnight in liquid medium were spread-plated on an agar plate, an MIC test strip was placed on the plate, and the MIC value was determined upon culturing based on visual inhibition of bacterial growth.
We used fluctuation analysis, as described previously [56,57], to estimate the effect of experimental sub-MICs of Sm on bacterial phage resistance mutation rate. The analysis was conducted in six microcosms containing 40 ml of liquid PPY medium per Sm concentration (0, 0.2, or 2 µg ml–1 Sm). Each microcosm was inoculated with 100–1000 cells of ancestral P. fluorescens and cultured for 24 h at 28°C with constant shaking at 120 r.p.m. To estimate total cell density, a dilution series was plated on PPY agar plates. To estimate the number of phage resistance mutants, a dilution series was plated on PPY agar plates containing a thin layer of soft agar with phage at a high density. Colony counts were performed after culturing for 24 h at 28°C, and the proportion of phage resistance mutants per microcosm was used to assess the mutation rate in each treatment using FALCOR [58] (see §2d below).
(c). Effect of phage and sub-minimum inhibiting concentrations of streptomycin on antibiotic resistance evolution
Because antibiotic resistance data in the 66-day experiment exhibited high variance between replicates (electronic supplementary material), we conducted an additional 12-day experiment to more accurately (with higher replication) test the effect of the phage and a sub-MIC of Sm on the evolution of antibiotic resistance. We had a full factorial experimental design with phage absent, phage present, no Sm and 2 µg ml–1 Sm treatments. Because our observations in the 66-day experiment showed similar results for the 0.2 and 2 µg ml–1 Sm treatments, the intermediate concentration 0.2 µg ml–1 Sm was left out from this additional experiment. All treatments were replicated four times in 48 wells in a 96-well plate, containing 200 µl of KB. Replicate populations of P. fluorescens were started by obtaining four individual colonies from plated bacterial stock culture, inoculating the colonies into KB and culturing overnight with constant shaking at 50 rpm. Every 48 h, 5% (10 µl) of each culture was transferred to a new well plate containing fresh KB using a pin replicator. During each transfer, well plates were frozen with 100 µl of 30% glycerol and kept at −20°C for later analysis.
To analyse antibiotic resistance, frozen samples were replicated on a PPY agar plate containing 25 µg ml–1 Sm. Antibiotic resistance was determined as the presence of bacterial growth after culturing plates for 48 h. It must be noted that in this experiment our aim was to determine the presence of antibiotic resistant genotypes in the population in the form of presence/absence data rather than determining the more precise degree of antibiotic resistance at the clonal level as performed in the 66-day long experiment. In addition, the presence of phage and phage resistance were determined on days 2, 8 and 12. The presence of phage was determined by replicating frozen samples on a 96-well plate containing the P. fluorescens ancestor strain in 100 µl of KB. After overnight culture, allowing rapid phage replication in the wells where the phage was initially present, the bacteria were killed with 10 µl of chloroform. Well plates were then replicated on a PPY agar plate containing a thin layer of soft agar with ancestral P. fluorescens at a high density using a 96-pin replicator that transfers a 10 µl inoculum of phage culture. The presence of phage in samples was determined as the presence of a plaque after culturing plates for 24 h. Phage resistance was analysed by a similar method by replicating the bacteria on plates containing thin layer of soft agar with high density of the ancestor phage and a formation of a colony after 24 h indicates a presence of phage resistant genotypes in the population.
(d). Data analysis
Statistical analyses for community experiment data were performed with R v. 3.2.2 [59], using the lme4 package [60], and SPSS Statistics v. 22 (IBM SPSS Statistics, Chicago, IL). For correlations in the 66-day experiment between sub-MICs of Sm and presence of phage and bacterial density, and between sub-MICs of Sm and phage resistance, we used linear mixed models (LMM), with the treatments (Sm, phage) as the fixed effect and transfer within replicate as the random effect. Models with and without the fixed effect were compared to determine the significance of the correlations. Repeated measures ANOVA (RMANOVA) was used to determine differences in the development of Sm resistance in the 12-day experiment. The effect of sub-MICs of Sm on phage resistance mutation rate was determined with the Ma-Sandri-Sarkar Maximum-Likelihood Estimator (MSS-MLE) using FALCOR [58]. Statistical analysis was performed, based on natural log transformations of the number of mutations per culture (m) and standard deviation estimates as explained previously [61], with ANOVA from sufficient statistics for groups using the aovSufficient function in the HH package [62] in R. All post hoc analyses were performed with Tukey honest significant difference (HSD).
3. Results
(a). Effect of sub-minimum inhibiting concentrations of streptomycin on ecological dynamics and phage resistance evolution
In the 66-day experiment, bacterial density was highest at 0 µg ml–1 Sm and lowest at 2 µg ml–1 Sm (LMM: χ2 = 422.5, d.f. = 4, p < 0.001; Tukey HSD for all pairwise comparisons p < 0.001, with the bacterial density order 0 > 0.2 > 2 µg ml–1 Sm) (figure 1). We also found a significant correlation between the phage and bacterial density (LMM χ2 = 16.34, d.f. = 1, p < 0.001), with reduced bacterial density in the presence of phage. The phage became extinct by day 14 in the 2 µg ml–1 Sm environment and by day 40 in the 0.2 µg ml–1 Sm environment while remaining present throughout the experiment in the 0 µg ml–1 Sm environment (figure 1d–f). In the 12-day experiment, the phage decreased almost to extinction in the 2 µg ml–1 Sm environment, with a smaller decrease in the no Sm environment.
Figure 1.

Population densities P. fluorescens and phage Φ2 and prevalence of phage resistance during 66-day experiment (mean ± s.e., n = 4). (a–c) Population densities in the 0 µg ml–1 (a), 0.2 µg ml–1 (b), and 2 µg ml–1 (c) Sm environments with bacteria alone. (d–f) Population densities in the 0 µg ml–1 (d), 0.2 µg ml–1 (e), and 2 µg ml–1 (f) Sm environments with bacteria and phage. (g–i) Phage resistance in the 0 µg ml–1 (g), 0.2 µg ml–1 (h), and 2 µg ml–1 (i) Sm environments. Phage (red lines), P. fluorescens (green lines) and phage resistance (blue lines) are differentiated by line colour.
In the 66-day experiment, sub-MICs of Sm and phage resistance were significantly correlated (LMM χ2 = 50.06, d.f. = 4, p < 0.001), so that phage resistance was higher in the 0.2 µg ml–1 (Tukey HSD: p < 0.001) and 2 µg ml–1 Sm environments (Tukey HSD: p = 0.006) compared with no Sm, and higher in the 0.2 µg ml–1 compared with the 2 µg ml–1 Sm environment (Tukey HSD: p = 0.011) (figure 1g–i). Further, in a separate experiment with the same P. fluorescens stock culture, after overnight culture in experimental sub-MICs of Sm, bacterial phage resistance mutation rates were higher compared with no Sm selection (figure 2). The number of mutation events (m) was higher for 0.2 µg ml–1 (m = 179 mutations ml–1; Tukey HSD: p < 0.001) and 2 µg ml–1 Sm (m = 167 mutations ml–1; Tukey HSD: p < 0.001) compared to no Sm (m = 121 mutations ml–1; ANOVA: F2,15 = 21.4, p < 0.001), while the Sm treatments did not differ from each other (Tukey HSD: p = 0.573).
Figure 2.

Phage resistance mutation rate, μ, of P. fluorescens SBW25 after culturing for 24 h under experimental Sm concentrations (μ ± 95% confidence intervals, n = 6). Different letters indicate significant difference (p < 0.01).
(b). Effect of phage and sub-minimum inhibiting concentrations of streptomycin on antibiotic resistance evolution
In the 12-day experiment, the development of Sm resistance in the Sm environment was enhanced by the presence of the phage (RMANOVA Sm: F1,12 = 198, p < 0.001; RMANOVA phage: F1,12 = 9.7 × 10⁻⁵, p = 0.992; RMANOVA Sm × phage: F1,12 = 16.1, p = 0.002) (figure 3).
Figure 3.
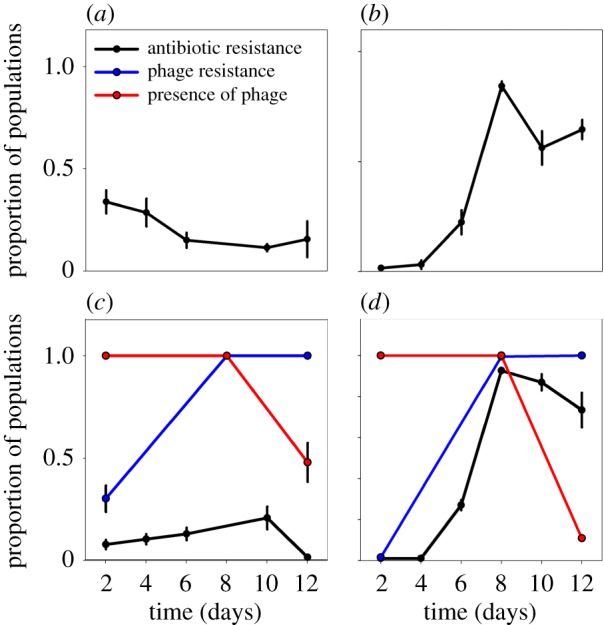
Proportion of Sm and phage resistant populations out of a total of 48 populations per replicate, as well as proportion of populations containing phage Φ2, during 12-day experiment (mean ± s.e., n = 4). (a) The 0 µg ml–1 Sm environment without phage. (b) The 2 µg ml–1 Sm environment without phage. (c) The 0 µg ml–1 Sm environment with phage. (d) The 2 µg ml–1 Sm environment with phage. Phage (red lines), phage resistance (blue lines) and antibiotic resistance (black lines) are differentiated by line colour.
4. Discussion
In this study, we examined the effect of sub-MICs of Sm on interactions between P. fluorescens and its lytic phage Φ2. We also determined the effect of experimental Sm concentrations on the rate of evolution of phage resistance. Our expectation was that fitness costs associated with both phage resistance and antibiotic resistance would result in decreased resistance evolution. However, under co-selection by sub-MICs of Sm and phage, we unexpectedly observed elevated evolution of resistance against the phage and Sm compared with individual treatments, as well as extinction of the phage. Notably, elevated resistance evolution was observed despite an association between both Sm and phage with lowered bacterial density. These results demonstrate that sub-MICs of Sm alter bacteria–phage interaction and resistance evolution, with ecological and evolutionary outcomes that differ from those expected under selection by antibiotic concentrations exceeding MICs.
Several lines of evidence suggest that the role of the phage and Sm, when applied together, in promoting resistance evolution and phage extinction may be associated with elevated mutability, although further studies are needed to characterize the molecular factors underlying our observations. First, we experimentally demonstrated that sub-MICs of Sm almost doubled the rate of phage resistance mutations compared with no Sm. Because pleiotropy was not detected between Sm and phage resistance (see control experiment for pleiotropy in the electronic supplementary material), we assume that this observation indicates an elevated mutation rate under our experimental conditions. Second, Sm is a known mutagen. Sm acts by binding to the small subunit of the bacterial ribosome, leading to mistranslation and ultimately, at sufficient concentrations, inhibition of protein synthesis and translational errors caused by sub-MICs of Sm have been associated with increased mutagenesis in Escherichia coli [63–65]. Third, we observed phage extinction under sub-MIC Sm selection. A high frequency of hypermutable genotypes (mutators) in a bacterial population, in the same bacteria–phage system employed here, has previously been associated with phage extinction [56]. Among the most common genetic factors causing hypermutability are loss-of-function mutations in the mutS and mutL genes involved in the methyl-directed mismatch repair system (MMR) that participates in the repair of newly synthesized DNA [41,56]. Fourth, the phage used in this study has previously been shown to select for mutator host strains [56,66–68]. Finally, according to a recent study by Tazzyman & Hall, in the presence of phage, even a slight increase in mutability can compensate for the growth rate cost of antibiotic resistance, and this especially applies with low-fitness-cost antibiotic resistance mutations [41], which are strongly associated with sub-MIC selection [7].
Previous studies suggest that Sm might inhibit certain phages, providing a potential explanation for phage extinction in the presence of Sm [69–71]. However, under the Sm concentrations used in this study, the phage initially increased to a high density and did not begin to decline until the host evolved resistance against the phage (figure 1). Although the possibility of an inhibitory effect of Sm against the phage cannot be completely ruled out, these results indicate that phage extinction under co-selection was the outcome of evolution in the host caused by the phage and/or Sm rather than direct inhibition by Sm.
Importantly, the results contradict previous experimental evidence that has demonstrated decreased resistance evolution as a consequence of combined phage–antibiotic treatment [37,68,72,73]. Given that faster emergence of resistant bacteria is a very undesirable outcome for novel treatment options, it seems necessary to evaluate resistance evolution on a case-by-case basis with each bacteria–phage–antibiotic combination, or, perhaps more generally, identify those antibiotics that are likely to promote resistance evolution via their mechanisms of action within the bacterial cell. The relevance of our findings is highlighted by the presence of sub-MICs within antibiotic concentration gradients that occur in human beings and animals subject to antibiotic treatment [7].
5. Knowledge gaps and future directions
Our findings demonstrate the potential of sub-MICs of antibiotics, commonly present in human-impacted environments, to radically alter the trajectory of bacterial evolution. While it is difficult to evaluate the relevance of such obscured selection pressures in environmental reservoirs, antibiotics may still generate vicious feedback cycles in those areas where both potential for antibiotic resistance evolution and antibiotics are present. Furthermore, evolution of antibiotic resistance has been traditionally studied in simplified single-species settings but we also need to incorporate knowledge on species interactions into the picture so that we can more comprehensively understand what drives antibiotic resistance evolution in complex natural communities. Neglecting ecological and evolutionary community dynamics and their interaction with sub-MICs results in an over-simplified view of antibiotic resistance evolution in natural communities, which can have important ramifications for the management of the antibiotic resistance crisis. Finally, as microbial communities are the bases of practically all food webs, altering these communities can have indirect cumulative effects at higher trophic levels in ecosystems.
Supplementary Material
Acknowledgements
We thank T. Niska, S. Suominen and T. Virolainen for help with data collection.
Data accessibility
Time series data for bacterial and phage population densities, phage resistance and streptomycin resistance are available at Dryad: http://dx.doi.org/10.5061/dryad.2dc34.
Authors' contributions
T.H., J.C., M.J. and L.B. conceived and designed experiment. J.C. and T.H. performed the experiment and analysed the data. All authors wrote the manuscript, gave final approval for publication and accept accountability for the content and work performed.
Competing interests
We have no competing interests.
Funding
The study was funded by the Academy of Finland to T.H. (#106993), University of Helsinki grant to T.H. (#490152) and Finnish Cultural Foundation grant to J.C. (#160149), and was supported by the Academy of Finland Centre of Excellence Program in Biological Interactions (#252411). L.B. thanks the German Research Foundation for funding (BE4135/3-1).
References
- 1.Levy SB, Marshall B. 2004. Antibacterial resistance worldwide: causes, challenges and responses. Nat. Med. 10, S122–S129. ( 10.1038/nm1145) [DOI] [PubMed] [Google Scholar]
- 2.Meaden S, Koskella B. 2013. Exploring the risks of phage application in the environment. Front. Microbiol. 4, 358 ( 10.3389/fmicb.2013.00358) [DOI] [PMC free article] [PubMed] [Google Scholar]
- 3.Rodríguez-Rojas A, Rodríguez-Beltrán J, Couce A, Blázquez J. 2013. Antibiotics and antibiotic resistance: a bitter fight against evolution. Int. J. Med. Microbiol. 303, 293–297. ( 10.1016/j.ijmm.2013.02.004) [DOI] [PubMed] [Google Scholar]
- 4.Rogalski MA, Gowler CD, Shaw CL, Hufbauer RA, Duffy MA. 2017. Human drivers of ecological and evolutionary dynamics in emerging and disappearing infectious disease systems. Phil. Trans. R. Soc. B 372, 20160043 ( 10.1098/rstb.2016.0043) [DOI] [PMC free article] [PubMed] [Google Scholar]
- 5.Hiltunen T, Virta M, Laine A-L. 2017. Antibiotic resistance in the wild: an eco-evolutionary perspective. Phil. Trans. R. Soc. B 372, 20160039 ( 10.1098/rstb.2016.0039) [DOI] [PMC free article] [PubMed] [Google Scholar]
- 6.Turcotte MM, Araki H, Karp DS, Poveda K, Whitehead SR. 2017. The eco-evolutionary impacts of domestication and agricultural practices on wild species. Phil. Trans. R. Soc. B 372, 20160033 ( 10.1098/rstb.2016.0033) [DOI] [PMC free article] [PubMed] [Google Scholar]
- 7.Andersson DI, Hughes D. 2014. Microbiological effects of sublethal levels of antibiotics. Nat. Rev. Microbiol. 12, 465–478. ( 10.1038/nrmicro3270) [DOI] [PubMed] [Google Scholar]
- 8.Andersson DI, Hughes D. 2012. Evolution of antibiotic resistance at non-lethal drug concentrations. Drug Resist. Updat. 15, 162–172. ( 10.1016/j.drup.2012.03.005) [DOI] [PubMed] [Google Scholar]
- 9.Perron GG, Gonzalez A, Buckling A. 2007. Source–sink dynamics shape the evolution of antibiotic resistance and its pleiotropic fitness cost. Proc. R. Soc. B 274, 2351–2356. ( 10.1098/rspb.2007.0640) [DOI] [PMC free article] [PubMed] [Google Scholar]
- 10.Benmayor R, Hodgson DJ, Perron GG, Buckling A. 2009. Host mixing and disease emergence. Curr. Biol. 19, 764–767. ( 10.1016/j.cub.2009.03.023) [DOI] [PMC free article] [PubMed] [Google Scholar]
- 11.Henderson-Begg SK, Livermore DM, Hall LM. 2006. Effect of subinhibitory concentrations of antibiotics on mutation frequency in Streptococcus pneumoniae. J. Antimicrob. Chemother. 57, 849–854. ( 10.1093/jac/dkl064) [DOI] [PubMed] [Google Scholar]
- 12.Wu YL, Scott EM, Po AL, Tariq VN. 1999. Development of resistance and cross-resistance in Pseudomonas aeruginosa exposed to subinhibitory antibiotic concentrations. APMIS 107, 585–592. ( 10.1111/j.1699-0463.1999.tb01596.x) [DOI] [PubMed] [Google Scholar]
- 13.Baharoglu Z, Mazel D. 2011. Vibrio cholerae triggers SOS and mutagenesis in response to a wide range of antibiotics: a route towards multiresistance. Antimicrob. Agents Chemother. 55, 2438–2441. ( 10.1128/AAC.01549-10) [DOI] [PMC free article] [PubMed] [Google Scholar]
- 14.Kohanski MA, DePristo MA, Collins JJ. 2010. Sublethal antibiotic treatment leads to multidrug resistance via radical-induced mutagenesis. Mol. Cell. 37, 311–320. ( 10.1016/j.molcel.2010.01.003) [DOI] [PMC free article] [PubMed] [Google Scholar]
- 15.Nagel M, Reuter T, Jansen A, Szekat C, Bierbaum G. 2011. Influence of ciprofloxacin and vancomycin on mutation rate and transposition of IS256 in Staphylococcus aureus. Int. J. Med. Microbiol. 301, 229–236. ( 10.1016/j.ijmm.2010.08.021) [DOI] [PubMed] [Google Scholar]
- 16.Gutierrez A, et al. 2013. β-Lactam antibiotics promote bacterial mutagenesis via an RpoS-mediated reduction in replication fidelity. Nat. Commun. 4, 1610 ( 10.1038/ncomms2607) [DOI] [PMC free article] [PubMed] [Google Scholar]
- 17.Prudhomme M, Attaiech L, Sanchez G, Martin B, Claverys JP. 2006. Antibiotic stress induces genetic transformability in the human pathogen Streptococcus pneumoniae. Science 313, 89–92. ( 10.1126/science.1127912) [DOI] [PubMed] [Google Scholar]
- 18.Beaber JW, Hochhut B, Waldor MK. 2004. SOS response promotes horizontal dissemination of antibiotic resistance genes. Nature 427, 72–74. ( 10.1038/nature02241) [DOI] [PubMed] [Google Scholar]
- 19.López E, Blázquez J. 2009. Effect of subinhibitory concentrations of antibiotics on intrachromosomal homologous recombination in Escherichia coli. Antimicrob. Agents Chemother. 53, 3411–3415. ( 10.1128/AAC.00358-09) [DOI] [PMC free article] [PubMed] [Google Scholar]
- 20.Nalca Y, Jänsch L, Bredenbruch F, Geffers R, Buer J, Häussler S. 2006. Quorum-sensing antagonistic activities of azithromycin in Pseudomonas aeruginosa PAO1: a global approach. Antimicrob. Agents Chemother. 50, 1680–1688. ( 10.1128/AAC.50.5.1680-1688.2006) [DOI] [PMC free article] [PubMed] [Google Scholar]
- 21.Li D, Renzoni A, Estoppey T, Bisognano C, Francois P, Kelley WL, Lew DP, Schrenzel J, Vaudaux P. 2005. Induction of fibronectin adhesins in quinolone-resistant Staphylococcus aureus by subinhibitory levels of ciprofloxacin or by sigma B transcription factor activity is mediated by two separate pathways. Antimicrob. Agents Chemother. 49, 916–924. ( 10.1128/AAC.49.3.916-924.2005) [DOI] [PMC free article] [PubMed] [Google Scholar]
- 22.Otto MP, Martin E, Badiou C, Lebrun S, Bes M, Vandenesch F, Etienne J, Lina G, Dumitrescu O. 2013. Effects of subinhibitory concentrations of antibiotics on virulence factor expression by community-acquired methicillin-resistant Staphylococcus aureus. J. Antimicrob. Chemother. 68, 1524–1532. ( 10.1093/jac/dkt073) [DOI] [PubMed] [Google Scholar]
- 23.Knudsen GM, Holch A, Gram L. 2012. Subinhibitory concentrations of antibiotics affect stress and virulence gene expression in Listeria monocytogenes and cause enhanced stress sensitivity but do not affect Caco-2 cell invasion. J. Appl. Microbiol. 113, 1273–1286. ( 10.1111/j.1365-2672.2012.05435.x) [DOI] [PubMed] [Google Scholar]
- 24.Clokie MR, Millard AD, Letarov AV, Heaphy S. 2011. Phages in nature. Bacteriophage 1, 31–45. ( 10.4161/bact.1.1.14942) [DOI] [PMC free article] [PubMed] [Google Scholar]
- 25.Gómez P, Buckling A. 2011. Bacteria–phage antagonistic coevolution in soil. Science 332, 106–109. ( 10.1126/science.1198767) [DOI] [PubMed] [Google Scholar]
- 26.Koskella B, Brockhurst MA. 2014. Bacteria–phage coevolution as a driver of ecological and evolutionary processes in microbial communities. FEMS Microbiol. Rev. 38, 916–931. ( 10.1111/1574-6976.12072) [DOI] [PMC free article] [PubMed] [Google Scholar]
- 27.Hall AR, De Vos D, Friman VP, Pirnay JP, Buckling A. 2012. Effects of sequential and simultaneous applications of bacteriophages on populations of Pseudomonas aeruginosa in vitro and in wax moth larvae. Appl. Environ. Microbiol. 78, 5646–5652. ( 10.1128/AEM.00757-12) [DOI] [PMC free article] [PubMed] [Google Scholar]
- 28.Buckling A, Wei Y, Massey RC, Brockhurst MA, Hochberg ME. 2006. Antagonistic coevolution with parasites increases the cost of host deleterious mutations. Proc. R. Soc. B 273, 45–49. ( 10.1098/rspb.2005.3279) [DOI] [PMC free article] [PubMed] [Google Scholar]
- 29.Brockhurst MA, Morgan AD, Fenton A, Buckling A. 2007. Experimental coevolution with bacteria and phage. The Pseudomonas fluorescens—Φ2 model system. Infect. Genet. Evol. 7, 547–552. ( 10.1016/j.meegid.2007.01.005) [DOI] [PubMed] [Google Scholar]
- 30.Andersson DI. 2006. The biological cost of mutational antibiotic resistance: any practical conclusions? Curr. Opin. Microbiol. 9, 461–465. ( 10.1016/j.mib.2006.07.002) [DOI] [PubMed] [Google Scholar]
- 31.MacLean RC, Hall AR, Perron GG, Buckling A. 2010. The population genetics of antibiotic resistance: integrating molecular mechanisms and treatment contexts. Nat. Rev. Genet. 11, 405–414. ( 10.1038/nrg2778) [DOI] [PubMed] [Google Scholar]
- 32.Andersson DI, Hughes D. 2011. Persistence of antibiotic resistance in bacterial populations. FEMS Microbiol. Rev. 35, 901–911. ( 10.1111/j.1574-6976.2011.00289.x) [DOI] [PubMed] [Google Scholar]
- 33.Loc-Carrillo C, Abedon ST. 2011. Pros and cons of phage therapy. Bacteriophage 1, 111–114. ( 10.4161/bact.1.2.14590) [DOI] [PMC free article] [PubMed] [Google Scholar]
- 34.Kutter E, De Vos D, Gvasalia G, Alavidze Z, Gogokhia L, Kuhl S, Abedon ST. 2010. Phage therapy in clinical practice: treatment of human infections. Curr. Pharm. Biotechnol. 11, 69–86. ( 10.2174/138920110790725401) [DOI] [PubMed] [Google Scholar]
- 35.Alisky J, Iczkowski K, Rapoport A, Troitsky N. 1998. Bacteriophages show promise as antimicrobial agents. J. Infect. 36, 5–15. ( 10.1016/S0163-4453(98)92874-2) [DOI] [PubMed] [Google Scholar]
- 36.Zhang QG. 2014. Exposure to phages has little impact on the evolution of bacterial antibiotic resistance on drug concentration gradients. Evol. Appl. 7, 394–402. ( 10.1111/eva.12136) [DOI] [PMC free article] [PubMed] [Google Scholar]
- 37.Torres-Barceló C, Arias-Sánchez FI, Vasse M, Ramsayer J, Kaltz O, Hochberg ME. 2014. A window of opportunity to control the bacterial pathogen Pseudomonas aeruginosa combining antibiotics and phages. PLoS ONE 9, e106628 ( 10.1371/journal.pone.0106628) [DOI] [PMC free article] [PubMed] [Google Scholar]
- 38.Bourguet D, Delmotte F, Franck P, Guillemaud T, Reboud X, Vacher C, Walker AS. 2013. Heterogeneity of selection and the evolution of resistance. Trends Ecol. Evol. 28, 110–118. ( 10.1016/j.tree.2012.09.001) [DOI] [PubMed] [Google Scholar]
- 39.Ward H, Perron GG, Maclean RC. 2009. The cost of multiple drug resistance in Pseudomonas aeruginosa. J. Evol. Biol. 22, 997–1003. ( 10.1111/j.1420-9101.2009.01712.x) [DOI] [PubMed] [Google Scholar]
- 40.Levin BR, Bull JJ. 1996. Phage therapy revisited: the population biology of a bacterial infection and its treatment with bacteriophage and antibiotics. Am. Nat. 147, 881–898. ( 10.1086/285884) [DOI] [Google Scholar]
- 41.Tazzyman SJ, Hall AR. 2015. Lytic phages obscure the cost of antibiotic resistance in Escherichia coli. ISME J. 9, 809–820. ( 10.1038/ismej.2014.176) [DOI] [PMC free article] [PubMed] [Google Scholar]
- 42.Rainey PB, Bailey MJ. 1996. Physical and genetic map of the Pseudomonas fluorescens SBW25 chromosome. Mol. Microbiol. 19, 521–533. ( 10.1046/j.1365-2958.1996.391926.x) [DOI] [PubMed] [Google Scholar]
- 43.Buckling A, Rainey PB. 2002. Antagonistic coevolution between a bacterium and a bacteriophage. Proc. R. Soc. Lond. B 269, 931–936. ( 10.1098/rspb.2001.1945) [DOI] [PMC free article] [PubMed] [Google Scholar]
- 44.Hiltunen T, Becks L. 2014. Consumer co-evolution as an important component of the eco-evolutionary feedback. Nat. Commun. 5, 5226 ( 10.1038/ncomms6226) [DOI] [PubMed] [Google Scholar]
- 45.Hiltunen T, Ayan GB, Becks L. 2015. Environmental fluctuations restrict eco-evolutionary dynamics in predator–prey system. Proc. R. Soc. B 282, 20150013 ( 10.1098/rspb.2015.0013) [DOI] [PMC free article] [PubMed] [Google Scholar]
- 46.Brockhurst MA, Morgan AD, Rainey PB, Buckling A. 2003. Population mixing accelerates coevolution. Ecol. Lett. 6, 975–979. ( 10.1046/j.1461-0248.2003.00531.x) [DOI] [Google Scholar]
- 47.Brockhurst MA, Rainey PB, Buckling A. 2004. The effect of spatial heterogeneity and parasites on the evolution of host diversity. Proc. R. Soc. Lond. B 271, 107–111. ( 10.1098/rspb.2003.2556) [DOI] [PMC free article] [PubMed] [Google Scholar]
- 48.Kassen R, Buckling A, Bell G, Rainey PB. 2000. Diversity peaks at intermediate productivity in a laboratory microcosm. Nature 406, 508–512. ( 10.1038/35020060) [DOI] [PubMed] [Google Scholar]
- 49.Rainey PB, Travisano M. 1998. Adaptive radiation in a heterogeneous environment. Nature 394, 69–72. ( 10.1038/27900) [DOI] [PubMed] [Google Scholar]
- 50.Friman VP, Buckling A. 2013. Effects of predation on real-time host–parasite coevolutionary dynamics. Ecol. Lett. 16, 39–46. ( 10.1111/ele.12010) [DOI] [PubMed] [Google Scholar]
- 51.Hall AR, Scanlan PD, Morgan AD, Buckling A. 2011. Host–parasite coevolutionary arms races give way to fluctuating selection. Ecol. Lett. 14, 635–642. ( 10.1111/j.1461-0248.2011.01624.x) [DOI] [PubMed] [Google Scholar]
- 52.Harrison E, Wood AJ, Dytham C, Pitchford JW, Truman J, Spiers A, Paterson S, Brockhurst MA. 2015. Bacteriophages limit the existence conditions for conjugative plasmids. mBio 6, e00586 ( 10.1128/mBio.00586-15) [DOI] [PMC free article] [PubMed] [Google Scholar]
- 53.Scanlan PD, Buckling A. 2012. Co-evolution with lytic phage selects for the mucoid phenotype of Pseudomonas fluorescens SBW25. ISME J. 6, 1148–1158. ( 10.1038/ismej.2011.174) [DOI] [PMC free article] [PubMed] [Google Scholar]
- 54.Morgan AD, Gandon S, Buckling A. 2005. The effect of migration on local adaptation in a coevolving host–parasite system. Nature 437, 253–256. ( 10.1038/nature03913) [DOI] [PubMed] [Google Scholar]
- 55.Duetz WA, Rüedi L, Hermann R, O'Connor K, Büchs J, Witholt B. 2000. Methods for intense aeration, growth, storage, and replication of bacterial strains in microtiter plates. Appl. Environ. Microbiol. 66, 2641–2646. ( 10.1128/AEM.66.6.2641-2646.2000) [DOI] [PMC free article] [PubMed] [Google Scholar]
- 56.Pal C, Maciá MD, Oliver A, Schachar I, Buckling A. 2007. Coevolution with viruses drives the evolution of bacterial mutation rates. Nature 450, 1079–1081. ( 10.1038/nature06350) [DOI] [PubMed] [Google Scholar]
- 57.Scanlan PD, Hall AR, Blackshields G, Friman VP, Davis MR Jr, Goldberg JB, Buckling A. 2015. Coevolution with bacteriophages drives genome-wide host evolution and constrains the acquisition of abiotic-beneficial mutations. Mol. Biol. Evol. 32, 1425–1435. ( 10.1093/molbev/msv032) [DOI] [PMC free article] [PubMed] [Google Scholar]
- 58.Hall BM, Ma CX, Liang P, Singh KK. 2009. Fluctuation analysis CalculatOR: a web tool for the determination of mutation rate using Luria-Delbruck fluctuation analysis. Bioinformatics 25, 1564–1565. ( 10.1093/bioinformatics/btp253) [DOI] [PMC free article] [PubMed] [Google Scholar]
- 59.R Core Team. 2015. R: A language and environment for statistical computing. Vienna, Austria: R Foundation for Statistical Computing. [Google Scholar]
- 60.Bates D, Maechler M, Bolker B, Walker S. 2015. Fitting linear mixed-effects models using lme4. J. Stat. Softw. 67, 1–48. ( 10.18637/jss.v067.i01) [DOI] [Google Scholar]
- 61.Rosche WA, Foster PL. 2000. Determining mutation rates in bacterial populations. Methods 20, 4–17. ( 10.1006/meth.1999.0901) [DOI] [PMC free article] [PubMed] [Google Scholar]
- 62.Heiberger RM. 2016. HH: Statistical analysis and data display: Heiberger and Holland. R package version 3.1-25. See http://CRAN.R-project.org/package=HH.
- 63.Boe L. 1992. Translational errors as the cause of mutations in Escherichia coli. Mol. Gen. Genet. 231, 469–471. ( 10.1007/BF00292717) [DOI] [PubMed] [Google Scholar]
- 64.Ren L, Rahman MS, Humayun MZ. 1999. Escherichia coli cells exposed to streptomycin display a mutator phenotype. J. Bacteriol. 181, 1043–1044. [DOI] [PMC free article] [PubMed] [Google Scholar]
- 65.Nagel R, Chan A. 2006. Mistranslation and genetic variability: the effect of streptomycin. Mutat. Res. 601, 162–170. ( 10.1016/j.mrfmmm.2006.06.012) [DOI] [PubMed] [Google Scholar]
- 66.O'Brien S, Rodrigues AM, Buckling A. 2013. The evolution of bacterial mutation rates under simultaneous selection by interspecific and social parasitism. Proc. R. Soc. B 280, 20131913 ( 10.1098/rspb.2013.1913) [DOI] [PMC free article] [PubMed] [Google Scholar]
- 67.Escobar-Páramo P, Gougat-Barbera C, Hochberg ME. 2012. Evolutionary dynamics of separate and combined exposure of Pseudomonas fluorescens SBW25 to antibiotics and bacteriophage. Evol. Appl. 5, 583–592. ( 10.1111/j.1752-4571.2012.00248.x) [DOI] [PMC free article] [PubMed] [Google Scholar]
- 68.Zhang QG, Buckling A. 2012. Phages limit the evolution of bacterial antibiotic resistance in experimental microcosms. Evol. Appl. 5, 575–582. ( 10.1111/j.1752-4571.2011.00236.x) [DOI] [PMC free article] [PubMed] [Google Scholar]
- 69.Brock TD. 1962. The inhibition of an RNA bacteriophage by streptomycin, using host bacteria resistant to the antibiotic. Biochem. Biophys. Res. Commun. 9, 184–187. ( 10.1016/0006-291X(62)90111-0) [DOI] [PubMed] [Google Scholar]
- 70.Brock TD, Mosser J, Peacher B. 1963. The inhibition by streptomycin of certain Streptococcus bacteriophages, using host bacteria resistant to the antibiotic. J. Gen. Microbiol. 33, 9–22. ( 10.1099/00221287-33-1-9) [DOI] [PubMed] [Google Scholar]
- 71.Schindler J. 1964. Inhibition of reproduction of the f2 bacteriophage by streptomycin. Folia Microbiol. (Praha) 89, 269–276. ( 10.1007/BF02873305) [DOI] [PubMed] [Google Scholar]
- 72.Coulter LB, McLean RJ, Rohde RE, Aron GM. 2014. Effect of bacteriophage infection in combination with tobramycin on the emergence of resistance in Escherichia coli and Pseudomonas aeruginosa biofilms. Viruses 6, 3778–3786. ( 10.3390/v6103778) [DOI] [PMC free article] [PubMed] [Google Scholar]
- 73.Kirby AE. 2012. Synergistic action of gentamicin and bacteriophage in a continuous culture population of Staphylococcus aureus. PLoS ONE 7, e51017 ( 10.1371/journal.pone.0051017) [DOI] [PMC free article] [PubMed] [Google Scholar]
Associated Data
This section collects any data citations, data availability statements, or supplementary materials included in this article.
Supplementary Materials
Data Availability Statement
Time series data for bacterial and phage population densities, phage resistance and streptomycin resistance are available at Dryad: http://dx.doi.org/10.5061/dryad.2dc34.