

Abstract
Increases in anthropogenic movement have led to a rise in pathogen introductions and the emergence of infectious diseases in naive host communities worldwide. We combined empirical data and mathematical models to examine changes in disease dynamics in little brown bat (Myotis lucifugus) populations following the introduction of the emerging fungal pathogen Pseudogymnoascus destructans, which causes the disease white-nose syndrome. We found that infection intensity was much lower in persisting populations than in declining populations where the fungus has recently invaded. Fitted models indicate that this is most consistent with a reduction in the growth rate of the pathogen when fungal loads become high. The data are inconsistent with the evolution of tolerance or an overall reduced pathogen growth rate that might be caused by environmental factors. The existence of resistance in some persisting populations of little brown bats offers a glimmer of hope that a precipitously declining species will persist in the face of this deadly pathogen.
This article is part of the themed issue ‘Human influences on evolution, and the ecological and societal consequences’.
Keywords: tolerance, Myotis lucifugus, Pseudogymnoascus destructans, Geomyces, host extinction, little brown bat
1. Introduction
The ability of species to respond to global change is a key determinant of Earth's future biodiversity [1]. Pathogen introductions owing to increased trade and travel threaten human, livestock and wildlife health and are a major conservation challenge in the Anthropocene [2]. Although the impacts of introduced pathogens are well established, and include continental-scale population declines [3,4], species extinctions [5–8], and shifts in community structure and ecosystem function [9–11], the evolutionary response of hosts to introduced pathogens has received far less study [12–14]. Understanding the ability of species to respond to introduced pathogens can help determine whether species will persist or go extinct in the face of disease, and thereby guide management action [15–17].
Outcomes of pathogen introductions include host extinction, host persistence owing to decreasing transmission following population declines (density-dependent effects), and the evolution of mechanisms that allow hosts to cope with disease. Potential mechanisms include resistance, tolerance, evolution of lower pathogen virulence and shifts in life-history traits that can result in demographic compensation [7,18–22]. Host resistance is defined as mechanisms that reduce the growth rate of the pathogen, and thereby reduce host morbidity or mortality. Host tolerance, by contrast, describes traits that enable hosts to reduce disease without reducing the growth rate of the pathogen [18,21]. Evolution of host tolerance and resistance are sometimes antagonistically related, in that evolution of one trait could limit the selective benefit for the other [23]. Host traits conferring tolerance are thought to be more likely to reach fixation in a population than resistance, because there is no decrease in pathogen transmission, and therefore little decrease in selective pressure on the pathogen, as the frequency of the trait increases in the population [18,24]. By contrast, the evolution of resistance is limited by reduced transmission as resistance becomes common [18]. In addition, there is less selective pressure on the pathogen when hosts evolve tolerance, which reduces the coevolutionary arms race between pathogens and hosts [18]. It has been suggested that populations can undergo shifts in defence systems, either owing to negative frequency-dependent selection or as pathogens change in response to host defences [25]. The introduction of pathogens to novel host communities provides an opportunity to understand the development of coevolutionary dynamics between hosts and pathogens [26].
The fungus Pseudogymnoascus destructans was recently introduced to North American bat populations, where it causes the disease white-nose syndrome (WNS) [27–29]. The fungus was first detected in a commercial cave in upstate New York in 2006, and has caused mass mortality of bat populations as it has spread across North America. Several species of bats have been predicted to go extinct from WNS, despite large, growing populations prior to WNS introduction [30]. Infection with the fungus increases rapidly during early winter when bats begin to hibernate, and prevalence reaches 100% in multiple species at most sites [31,32]. Mortality from WNS occurred 70–100 days after infection in laboratory studies, and in the field mortality peaks between January and April in the northeast USA, when pathogen loads on bats are highest [28,29,32]. After bats emerge from hibernation in the summer, they clear P. destructans from their skin surfaces, but the fungus can persist in hibernacula environments for long periods of time in the absence of bats, owing to its likely origins as a soil saprotroph [33–37]. Therefore, when bats return to hibernacula in the fall, P. destructans can continually re-infect bats [31,32,34]. WNS appears to be endemic to Eurasia [38,39], and bats in Asia bats have lower levels of P. destructans infection, which may indicate increased resistance [15].
Despite widespread declines and extirpation of many colonies in North America, some colonies in New York of one species, the little brown bat (Myotis lucifugus), now appear to be persisting, but by unknown mechanisms [30,40–43]. New York bats initially declined sharply from disease (figure 1), but some colonies have subsequently stabilized at 5–30% of their original size [30,40]. The severe declines have imposed very strong selection pressure on bats to persist with the fungus [44].
Figure 1.
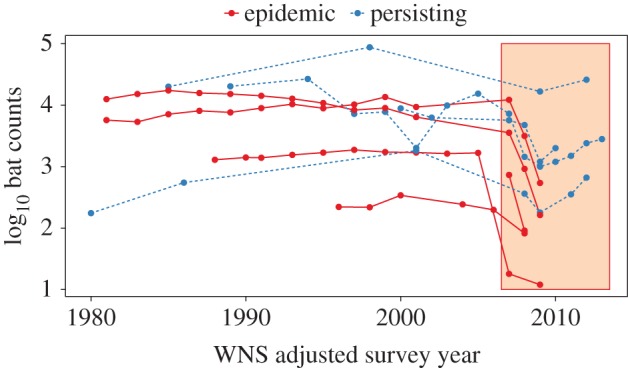
Winter counts of hibernating little brown bats from 1980 to 2013 in three states (New York: blue, dashed line—persisting; Illinois and Virginia: red, solid line—epidemic) with the red box indicating the presence of WNS. Survey year was standardized across sites by deducting the difference between 2007 and the year of WNS arrival from the survey year for each site.
We examined support for four potential mechanisms of persistence by fitting a multi-compartmental, susceptible-infected model to data on prevalence and infection intensity (figure 2). We compared infection dynamics in stabilized post-epidemic populations from New York to colonies in the mass mortality phase of WNS. Comparison of data, models and parameter values allowed us to differentiate between differences in resistance, tolerance or changes in transmission between stabilized and declining populations.
Figure 2.

Hypothesized patterns of fungal loads or infection intensity of P. destructans (Pd) under different mechanisms of persistence for little brown bat populations. (a) Density-dependent transmission: Here, the force of infection (λ, the probability of a susceptible individual becoming infected per unit time) is higher in epidemic (epi) populations than in persisting (pers) populations. A higher λ in epidemic populations would result in these bats becoming infected earlier in the hibernation season, and reaching higher loads than bats in persisting populations at the time of sampling. (b) Tolerance: fungal growth on bats (γ) is identical between persisting and epidemic populations, but no mortality occurs in persisting populations, therefore Δγ (the difference in fungal growth rates between persisting and epidemic populations) is 0. γ1 is the fungal growth rate at low loads (between lower and medium load classes) and γ2 is the fungal growth rate between medium and high load classes. (c) Resistance type 1: fungal growth on bats is lower across all loads in persisting populations than in epidemic populations. (d) Resistance type 2: fungal growth on bats is initially similar to growth rates on bats in epidemic areas, but loads asymptote at moderate levels.
2. Material and methods
(a). Sample collection and analysis
We collected data on population and infection dynamics of hibernating little brown bats at nine colonies (figure 1), including four persisting sites in New York, and five epidemic sites in Illinois (two sites sampled over two years) and Virginia (three sites). Persisting sites all had positive annual population growth rates, whereas epidemic sites had annual declines of 50–90% in the year of sampling [30,31]. All sites were sampled at least twice during each season, but sampling was limited to a maximum of three times per winter to reduce disturbance to hibernating bats [45]. Hibernating populations were censused by searching the entire site and counting all bats by species. In New York and Virginia, counts were done once per year (but not every year) from January to March by researchers and state agency personnel. In Illinois, bats were counted once per year before WNS detection and twice per year afterward, during early (November) and late (March) hibernation. Repeated surveys of the same populations suggest that uncertainty in the counts is approximately normally distributed with a coefficient of variation of approximately 11%. All research was conducted under approved protocols 11-022 by the IACUC of Boston University or #Frickw1106 by the IACUC of University of California Santa Cruz.
We collected epidermal swab samples from a mean of 19 little brown bats at each site to determine presence and intensity of P. destructans infection. We sampled bats by rubbing a polyester swab moistened with sterile water five times each across bat forearms and muzzles [46]. Samples were stored in RNAlater for preservation until DNA extraction. Samples were tested for the presence and quantity of P. destructans DNA using real-time qPCR [31,32].
(b). Modelling approach
We used a susceptible (S)-infected (I) continuous time compartmental model with three infected classes (I1, I2, I3) to model the within-winter season infection and load dynamics of P. destructans on bats (equation (2.1)).
 |
2.1 |
Here, β is the transmission rate, γ is the transition rate from one load class to the next (e.g. fungal growth rate), Δγ is the difference in growth rates between epidemic and persisting populations (γepi and γpers in figure 2), α is the disease-caused death rate and N is the total colony size. We have assumed that transmission is frequency dependent based on the clustering behaviour of bats that would be expected to maintain a fixed number of neighbours across a range of densities [47,48], and the lack of evidence for density-dependent declines in this species [30]. We assumed that death only occurs in the highest load class, which is consistent with the long delay (70–100 days) between infection and mortality seen in laboratory infection studies [29] and field data [49]. We have not included a recovered class because there is no evidence that exposure to the fungus protects bats from repeated infection [32].
We fit the model to the data by assigning individuals to each class based on measured fungal loads: I1, low loads (below −4 log10 ng), I2, medium loads (between −4 and −2 log10 ng), and I3, high loads (greater than −2 log10 ng). We initially built a model with three load classes as the simplest possible model that would enable us to test between resistance type 1 (figure 2; an overall reduced pathogen growth rate) and resistance type 2 (figure 2; a reduced pathogen growth rate only at higher fungal loads). Results were similar using a model with seven load classes (electronic supplementary material, figure S1). We chose seven load classes because it allowed us to divide individuals into a larger set of classes (and confirm that our selection of three load classes did not produce spurious results) without resulting in many load categories with zero bats. We assessed the evidence for a difference in tolerance or two types of resistance (figure 2) between epidemic and persisting sites by fitting a parameter, Δγ, that quantifies the difference in the transition rate, γ, between epidemic and persisting sites. For resistance type 1, we fit a parameter that quantified the overall difference in the transition rate for both load transitions (I1 to I2 and I2 to I3), reflecting an overall lower fungal growth rate (electronic supporting material, equation S2). For resistance type 2 (equation (2.1), above), we fit a parameter that quantified the difference in the transition rate for only the load transitions from I2 to I3. We compared the fit of these two models by comparing the fitted likelihoods, because both models had the same number of parameters.
We fit the model to the entire dataset (four persisting endemic sites and five declining epidemic sites, including two years of data for the two Illinois sites, with a total of 454 sampled bats divided into three load classes and susceptible individuals), simultaneously. We maximized the joint likelihood of the distribution of bats in the four infection classes (S, I1, I2, I3) using a multinomial distribution, and the late-winter population counts from the Illinois sites using a Gaussian distribution. For the population counts, we used a Gaussian distribution with the mean equal to the actual count and a coefficient of variation of 0.11, based on a previous analysis of repeated counts of the same population. We fit the model using the optim function in R (v. 3.2.2) with the L-BFGS optimization algorithm and constrained all parameters to be greater than or equal to 0. We fit the model using the measured values for the fraction of individuals in each class at the first sampling point in each winter as the starting conditions. We assumed deviations between the model and data were owing entirely to measurement error, but we would have obtained similar results if we had fit both process and observation error because most sites had only two points in each time series.
3. Results
In the first year of pathogen invasion, the fraction of bats infected with P. destructans increased from zero in early winter to nearly 100% (figure 3; sites IL1 Year 1, IL2 Year 1). In subsequent years, bats became infected much earlier in hibernation, and early winter prevalence was already more than 50% in most colonies of both epidemic and persisting sites (figure 3, all other panels). Subsequently, at all but one site, most individuals were infected by the end of winter (figure 3).
Figure 3.

Model (lines) fit to bat fungal load data (points ± s.e.), from equations for resistance type 2. Dotted lines show fitted model for the frequency of uninfected bats, dot-dash lines show fitted model frequency of bats with low loads, long dash lines show fitted model frequency of bats with medium loads, and solid lines show fitted model of bats with high loads. Panel labels include the year after WNS arrival that the site was sampled (e.g. Y1 is the first year of WNS detection).
Infection intensity increased over each winter, and at epidemic sites at least one year after pathogen invasion, fungal loads were almost uniformly high, with most individuals having fungal loads in the ‘high’ load class (figures 3 and 4; electronic supplementary material, figure S1). By contrast, at persisting sites, late-winter loads were much lower, with most bats being in the ‘medium’ load class (figures 3 and 4; electronic supplementary material, figure S1). Overall, late-winter loads differed substantially between epidemic and persisting sites, with persisting sites having an average of 20-fold (101.3) lower fungal loads (linear mixed effects model: persisting sites fungal log10 load coeff.: 1.28 ± 0.30; T = −4.3; p < 0.001; figure 4a,b). Loads in early hibernation did not differ significantly between epidemic and persisting sites (persisting fungal load coeff.: 0.55 ± 1.3; T = 0.43, p = 0.67). The difference in the frequency distribution of bats in the different load classes between epidemic sites and persisting sites was similar whether we used three load categories (figure 4b), or seven (electronic supplementary material, figure S1).
Figure 4.

(a) Late-winter fungal loads of P. destructans (Pd) on individual bats at persisting and epidemic sites. Points are individual bats and the bold horizontal lines indicate the medians, the boxes encompass the 25th to 75th percentiles of the data, and the whiskers extend to points within 1.5 times the inter-quantile range. (b) Distribution of individual bat fungal loads during early (solid) and late hibernation (dashed) at persisting (NY) and epidemic sites (VA and IL). (c) Fraction of bats in each load class at the end of hibernation in epidemic and persisting sites. The bold horizontal lines indicate the median, and the boxes encompass the 25th to 75th percentiles of the data, as in panel (a). The dots indicate outlier points of the data.
Fitted models suggested that the difference in fungal loads between epidemic and persisting populations in late winter was owing to a reduction in growth rate between the last two load classes and not simply an overall lower growth rate (difference in log likelihoods: 26.6 or ΔAIC = 53.2, table 1; see the electronic supplementary material for model comparisons). Specifically, the best-fitting model had identical growth rates at low fungal loads between epidemic and persisting sites, whereas growth rates from moderate to high fungal loads were near zero at persisting sites (figure 5; γ2 at persisting sites = 0.09), but almost the same as from low to moderate loads at epidemic sites (figure 5; electronic supplementary material, figure S2; γ2 at epidemic sites = 1.13).
Table 1.
Evidence in support or against hypotheses in figure 2.
| hypothesis | supported | evidence |
|---|---|---|
| reduced transmission owing to density-dependent transmission | no | — colony sizes in persisting populations larger than epidemic sites — early hibernation fungal loads in persisting populations equal to or higher than epidemic populations |
| tolerance | no | — Δγ ≠ 0 — late hibernation fungal loads were much higher in epidemic populations |
| resistance type 1 | no | — Δγ2 > 0; so γ2(epi) > γ2(pers) and γ1(pers) > γ2(pers) — loads in persisting populations were equal to epidemic populations in early hibernation but lower in late hibernation |
| resistance type 2 | yes | — γ1(epi) = γ1(pers) — γ2(epi) > γ2(pers) — Δγ2 > 0 — loads in persisting populations initially the same as epidemic but then asymptote, whereas fungal loads continue to increase in epidemic sites |
Figure 5.

Estimated parameter values and 95% CIs. β is the transmission coefficient (per capita infectious contact rate per month), γ1 is the transition rate between load classes I1 and I2, γ2 is the transition rate between load classes I2 and I3(per capita numbers of bats transitioning between loads classes per month), Δγ is the difference in transition rate between the I2 and I3 classes between epidemic and persisting populations (i.e. the transition rate between the I2 and I3 classes for epidemic populations is γ2 + Δγ) and α is the death rate from the third infected class, I3 (per capita rate of bats dying per month).
4. Discussion
Although all organisms are under continuous selective pressures from dynamic environments [50], the selective pressures exerted by human activities can be especially strong and sometimes result in much faster trait change than other natural processes [16,17,51]. The introduction of species to new regions is one such activity that exerts strong selective pressure [52,53], and the introduction of pathogens to novel host communities is no exception [26]. WNS has caused severe declines in North American bats (more than 90% mortality in several species) and has thereby exerted intense selective pressure on bat populations to evolve traits to persist with this pathogen. We found that populations of one bat species that are now persisting with the pathogen have reduced growth of the fungus resulting in much lower fungal loads than bats at sites where declines are occurring. Although these data are from different populations and thus do not strictly demonstrate change in the same populations over time, the change in population trajectories at persisting sites and the differences in infection dynamics between persisting and declining sites suggest that the evolution of more resistant bats is a plausible explanation for population persistence. The large initial declines in New York are of the same magnitude as declines in epidemic sites (figure 1; [30]), suggesting a change in disease dynamics since initial invasion, and not that bats simply differed geographically.
The difference in fungal loads between persisting and declining bats indicates that persisting bats are not simply tolerant of the fungus, and is consistent with either resistance or density-dependent factors (table 1). Two lines of evidence suggest that reduced transmission at persisting sites owing to reduced densities is unlikely. First, all colony sizes of persisting sites are larger than all epidemic colony sizes. Second, fungal loads early in hibernation were as high or higher at persisting sites than declining sites, which is the opposite of what would occur if transmission was lower at persisting sites. Thus, the data are inconsistent with both tolerance and reduced transmission owing to density–density dependent transmission, but are consistent with host resistance.
Although the data suggest that bats at persisting sites are more resistant to growth of P. destructans, the form of resistance best supported by the data is not simply a reduction in pathogen growth rate (type 1 in figure 2 and table 1). There was no evidence that fungal growth rates were lower at low loads in persisting populations, whereas fungal growth was essentially halted at higher fungal loads. This is at odds with observing lower overall fungal growth rates that could be caused either by environmental factors influencing pathogen growth, such as temperature [54], changes in intrinsic pathogen growth rate, or load-independent host resistance traits. The pattern of resistance we observed (type 2 in figure 2) could be owing to changes in bat skin microbial communities resulting in a new carrying capacity of the fungus on endemic bats [55], host-induced reduction in resources for fungal consumption, increases in the time spent euthermic during late winter, an activation of an immune response when the pathogen reaches a fungal load threshold, or slow immune response activation by bats [56]. Regardless of which mechanism is responsible for the lower loads observed, our results suggest that resistance should increase bats' ability to survive through winter to reproduce in summer.
The type of resistance we observed—a reduction in maximum fungal loads without reducing initial growth—may put less selective pressure on the pathogen than an overall reduction in pathogen growth rate, and as a result, be less likely to select for higher replication rates by the pathogen. Our results indicate that bats at epidemic and persisting sites may reach infectiousness (e.g. ability to transfer fungus to other bats) at similar times, and therefore transmission is more similar between epidemic and persisting populations than if resistance occurred by an overall reduction in fungal growth. The extensive environmental reservoir also contains strains of P. destructans shed by bats early in the WNS epidemic (and therefore not subjected to current selection pressures), and pathogen gene flow from the environmental reservoir as well as from bats at declining sites [31,57,58] may slow the speed of pathogen evolution.
(a). Knowledge gaps and future directions
Although resistance appears to be present at all four persisting populations we studied, three lines of evidence suggest that other populations of little brown bats, or other bat species, may persist owing to other mechanisms or may be driven extinct. First, little brown bat populations were much larger in the northeastern USA than in other places, possibly allowing greater genetic diversity on which selection could act [40,58]. Second, host–pathogen interactions may not be the same in all places. Specifically, at some sites the fungus may grow faster owing to warmer temperatures [30], resulting in individuals with limited resistance being unable to limit fungal growth below loads leading to death. Third, variation in resistance may not exist in species other than little brown bats. The Northern long-eared myotis (M. septentrionalis) has disappeared from all sites within four years of WNS detection [30,31,40], and strong evidence suggests this species may be driven extinct in the near future.
It is also unclear what mechanism causes resistance in persisting populations, and most importantly, whether this trait is heritable. If resistance is heritable and at least partly dominant, then translocations to regions where this species has nearly been extirpated might greatly speed population recovery [22,57]. Recent genetic evidence suggests that populations of little brown bats east of the Mississippi river were panmictic before WNS [58], so gene flow between resistant and non-resistant individuals may slow evolution of resistance across eastern bat populations. Regardless, owing to the low reproductive potential of little brown bats (which have only one young per year) [47,59], it will be decades before this species can reach its pre-WNS abundance.
(b). Conclusion
Anthropogenically mediated introductions of pathogens have caused widespread mass mortality events [3,4,6], extinctions [60,61] and changes in community composition [9] and ecosystem function [10]. The persistence of many species in the Anthropocene will depend on the ability of these hosts to adapt to cope with pathogen introductions [62]. Less adaptable species will likely vanish, as has occurred with the Northern long-eared bat following WNS detection [30,32,40]. In order to preserve ecosystems, conservation efforts need to reduce continental shifts in pathogen distributions.
Supplementary Material
Acknowledgements
We thank C. Herzog (NY), D. Kirk, J. Kath (IL), R. Reynolds, W. Orndorf (VA) and T. Cheng for assistance with field coordination and sample collection.
Ethics
We followed field hygiene protocols in accordance with United State Fish and Wildlife Service WNS Decontamination Guidelines, and individual state recommendations. All research was conducted under protocol #11-022 approved by the IACUC of Boston University and protocol #Frickw1106 approved by the IACUC of the University of California, Santa Cruz.
Data accessibility
Data are available from Dryad Digital Repository: [63].
Authors' contributions
K.E.L., J.R.H. and A.M.K. conceived of and designed the study. K.E.L., J.R.H., A.M.K. and W.F.F. collected the data. K.E.L., J.R.H., A.M.K., K.L.P. and J.T.F. analysed the data. K.E.L. and A.M.K. wrote the paper with input from all authors.
Competing interests
We have no competing interests.
Funding
This research was supported by funding from the National Science Foundation (DGE-0741448, DEB-1336290, DEB-1115895), Bat Conservation International, the US Fish and Wildlife Service and the National Geographic Society.
References
- 1.Carroll SP, Jørgensen PS, Kinnison MT, Bergstrom CT, Denison RF, Gluckman P, Smith TB, Strauss SY, Tabashnik BE. 2014. Applying evolutionary biology to address global challenges. Science 346, 1245993 ( 10.1126/science.1245993) [DOI] [PMC free article] [PubMed] [Google Scholar]
- 2.Daszak P, Cunningham AA, Hyatt AD. 2000. Emerging infectious diseases of wildlife—threats to biodiversity and human health. Science 287, 443 ( 10.1126/science.287.5452.443) [DOI] [PubMed] [Google Scholar]
- 3.LaDeau SL, Kilpatrick AM, Marra PP. 2007. West Nile virus emergence and large-scale declines of North American bird populations. Nature 447, 710–713. ( 10.1038/nature05829) [DOI] [PubMed] [Google Scholar]
- 4.Frick WF, Pollock JF, Hicks AC, Langwig KE, Reynolds DS, Turner GG, Butchkoski CM, Kunz TH. 2010. An emerging disease causes regional population collapse of a common North American bat species. Science 329, 679–682. ( 10.1126/science.1188594) [DOI] [PubMed] [Google Scholar]
- 5.Smith KF, Sax DF, Lafferty KD. 2006. Evidence for the role of infectious disease in species extinction and endangerment. Conserv. Biol. 20, 1349–1357. ( 10.1111/j.1523-1739.2006.00524.x) [DOI] [PubMed] [Google Scholar]
- 6.van Riper C, van Riper SG, Goff ML, Laird M. 1986. The epizootiology and ecological significance of malaria in Hawaiian land birds. Ecol. Monogr. 56, 327–344. ( 10.2307/1942550) [DOI] [Google Scholar]
- 7.de Castro F, Bolker B. 2005. Mechanisms of disease-induced extinction. Ecol. Lett. 8, 117–126. ( 10.1111/j.1461-0248.2004.00693.x) [DOI] [Google Scholar]
- 8.McCallum H. 2012. Disease and the dynamics of extinction. Phil. Trans. R. Soc. B 367, 2828–2839. ( 10.1098/rstb.2012.0224) [DOI] [PMC free article] [PubMed] [Google Scholar]
- 9.Whitlaw HA, Lankester MW. 1994. A retrospective evaluation of the effects of parelaphostrongylosis on moose populations. Can. J. Zool. 72, 1–7. ( 10.1139/z94-001) [DOI] [Google Scholar]
- 10.Holdo RM, Sinclair ARE, Dobson AP, Metzger KL, Bolker BM, Ritchie ME, Holt RD. 2009. A disease-mediated trophic cascade in the serengeti and its implications for ecosystem C. PLoS Biol. 7, e1000210 ( 10.1371/journal.pbio.1000210) [DOI] [PMC free article] [PubMed] [Google Scholar]
- 11.Altizer S, Harvell D, Friedle E. 2003. Rapid evolutionary dynamics and disease threats to biodiversity. Trends Ecol. Evol. 18, 589–596. ( 10.1016/j.tree.2003.08.013) [DOI] [Google Scholar]
- 12.Fenner F, Woodroofe GM. 1965. Changes in the virulence and antigenic structure of strains of myxoma virus recovered from Australian wild rabbits between 1950 and 1964. Aust. J. Exp. Biol. Med. Sci. 43, 359–370. ( 10.1038/icb.1965.69) [DOI] [PubMed] [Google Scholar]
- 13.Atkinson CT, Saili KS, Utzurrum RB, Jarvi SI. 2013. Experimental evidence for evolved tolerance to avian malaria in a wild population of low elevation Hawai‘i ‘Amakihi (Hemignathus virens). Ecohealth 10, 366–375. ( 10.1007/s10393-013-0899-2) [DOI] [PubMed] [Google Scholar]
- 14.Duggal NK, et al. 2014. Evidence for co-evolution of West Nile Virus and house sparrows in North America. PLoS. Negl. Trop. Dis. 8, e3262 ( 10.1371/journal.pntd.0003262) [DOI] [PMC free article] [PubMed] [Google Scholar]
- 15.Hoyt JR, et al. 2016. Host persistence or extinction from emerging infectious disease: insights from white-nose syndrome in endemic and invading regions. Proc. R. Soc. B 283, 20152861 ( 10.1098/rspb.2015.2861) [DOI] [PMC free article] [PubMed] [Google Scholar]
- 16.Hendry AP, Farrugia TJ, Kinnison MT. 2008. Human influences on rates of phenotypic change in wild animal populations. Mol. Ecol. 17, 20–29. ( 10.1111/j.1365-294X.2007.03428.x) [DOI] [PubMed] [Google Scholar]
- 17.Hendry AP, Gotanda KM, Svensson EI. 2017. Human influences on evolution, and the ecological and societal consequences. Phil. Trans. R. Soc. B 372, 20160028 ( 10.1098/rstb.2016.0028) [DOI] [PMC free article] [PubMed] [Google Scholar]
- 18.Roy BA, Kirchner JW. 2000. Evolutionary dynamics of pathogen resistance and tolerance. Evolution 54, 51–63. ( 10.1111/j.0014-3820.2000.tb00007.x). [DOI] [PubMed] [Google Scholar]
- 19.Dwyer G, Levin SA, Buttel L. 1990. A simulation model of the population dynamics and evolution of Myxomatosis. Ecol. Monogr. 60, 423–447. ( 10.2307/1943014) [DOI] [Google Scholar]
- 20.Briggs CJ, Knapp RA, Vredenburg VT. 2010. Enzootic and epizootic dynamics of the chytrid fungal pathogen of amphibians. Proc. Natl Acad. Sci. USA 107, 9695–9700. ( 10.1073/pnas.0912886107) [DOI] [PMC free article] [PubMed] [Google Scholar]
- 21.Råberg L, Sim D, Read AF. 2007. Disentangling genetic variation for resistance and tolerance to infectious diseases in animals. Science 318, 812–814. ( 10.1126/science.1148526) [DOI] [PubMed] [Google Scholar]
- 22.Kilpatrick AM. 2006. Facilitating the evolution of resistance to avian malaria in Hawaiian birds. Biol. Conserv. 128, 475–485. ( 10.1016/j.biocon.2005.10.014) [DOI] [Google Scholar]
- 23.Svensson EI, Råberg L. 2010. Resistance and tolerance in animal enemy–victim coevolution. Trends Ecol. Evol. 25, 267–274. ( 10.1016/j.tree.2009.12.005) [DOI] [PubMed] [Google Scholar]
- 24.Boots M, Best A, Miller MR, White A. 2009. The role of ecological feedbacks in the evolution of host defence: what does theory tell us? Phil. Trans. R. Soc. B 364, 27–36. ( 10.1098/rstb.2008.0160) [DOI] [PMC free article] [PubMed] [Google Scholar]
- 25.Garrido E, Llamas-Guzmán L, Fornoni J. 2015. The effect of frequency-dependent selection on resistance and tolerance to herbivory. J. Evol. Biol. 29, 483–489. ( 10.1111/jeb.12768) [DOI] [PubMed] [Google Scholar]
- 26.Rogalski MA, Gowler CD, Shaw CL, Hufbauer RA, Duffy MA. 2017. Human drivers of ecological and evolutionary dynamics in emerging and disappearing infectious disease systems. Phil. Trans. R. Soc. B 372, 20160043 ( 10.1098/rstb.2016.0043) [DOI] [PMC free article] [PubMed] [Google Scholar]
- 27.Blehert DS, et al. 2009. Bat white-nose syndrome: an emerging fungal pathogen? Science 323, 227 ( 10.1126/science.1163874) [DOI] [PubMed] [Google Scholar]
- 28.Lorch JM, et al. 2011. Experimental infection of bats with Geomyces destructans causes white-nose syndrome. Nature 480, 376–378. ( 10.1038/nature10590) [DOI] [PubMed] [Google Scholar]
- 29.Warnecke L, Turner JM, Bollinger TK, Lorch JM, Misra V, Cryan PM, Wibbelt G, Blehert DS, Willis CKR. 2012. Inoculation of bats with European Geomyces destructans supports the novel pathogen hypothesis for the origin of white-nose syndrome. Proc. Natl Acad. Sci. USA 109, 6999–7003. ( 10.1073/pnas.1200374109) [DOI] [PMC free article] [PubMed] [Google Scholar]
- 30.Langwig KE, Frick WF, Bried JT, Hicks AC, Kunz TH, Marm Kilpatrick A. 2012. Sociality, density-dependence and microclimates determine the persistence of populations suffering from a novel fungal disease, white-nose syndrome. Ecol. Lett. 15, 1050–1057. ( 10.1111/j.1461-0248.2012.01829.x) [DOI] [PubMed] [Google Scholar]
- 31.Langwig KE, Hoyt JR, Parise KL, Kath J, Kirk D, Frick WF, Foster JT, Kilpatrick AM. 2015. Invasion dynamics of white-nose syndrome fungus, midwestern United States, 2012–2014. Emerg. Infect. Dis. 21, 150123 ( 10.3201/eid2106.150123) [DOI] [PMC free article] [PubMed] [Google Scholar]
- 32.Langwig KE, et al. 2015. Host and pathogen ecology drive the seasonal dynamics of a fungal disease, white-nose syndrome. Proc. R. Soc. B 282, 20142335 ( 10.1098/rspb.2014.2335) [DOI] [PMC free article] [PubMed] [Google Scholar]
- 33.Minnis AM, Lindner DL. 2013. Phylogenetic evaluation of Geomyces and allies reveals no close relatives of Pseudogymnoascus destructans, comb. nov., in bat hibernacula of eastern North America. Fungal Biol. 117, 638–649. ( 10.1016/j.funbio.2013.07.001) [DOI] [PubMed] [Google Scholar]
- 34.Hoyt JR, Langwig KE, Okoniewski J, Frick WF, Stone WB, Kilpatrick AM. 2014. Long-term persistence of Pseudogymnoascus destructans, the causative agent of white-nose syndrome, in the absence of bats. EcoHealth 12, 1–4. ( 10.1007/s10393-014-0981-4) [DOI] [PubMed] [Google Scholar]
- 35.Reynolds HT, Barton HA. 2014. Comparison of the white-nose syndrome agent Pseudogymnoascus destructans to cave-dwelling relatives suggests reduced saprotrophic enzyme activity. PLoS ONE 9, e86437 ( 10.1371/journal.pone.0086437) [DOI] [PMC free article] [PubMed] [Google Scholar]
- 36.Lindner DL, Gargas A, Lorch JM, Banik MT, Glaeser J, Kunz TH, Blehert DS. 2011. DNA-based detection of the fungal pathogen Geomyces destructans in soils from bat hibernacula. Mycologia 103, 241–246. ( 10.3852/10-262) [DOI] [PubMed] [Google Scholar]
- 37.Lorch JM, Lindner DL, Gargas A, Muller LK, Minnis AM, Blehert DS. 2013. A culture-based survey of fungi in soil from bat hibernacula in the eastern United States and its implications for detection of Geomyces destructans, the causal agent of bat white-nose syndrome. Mycologia 105, 237–252. ( 10.3852/12-207) [DOI] [PubMed] [Google Scholar]
- 38.Hoyt JR, et al. 2016. Widespread bat white-nose syndrome fungus, northeastern China. Emerg. Infect. Dis. 22, 140 ( 10.3201/eid2201.151314) [DOI] [PMC free article] [PubMed] [Google Scholar]
- 39.Puechmaille SJ, Frick WF, Kunz TH, Racey PA, Voigt CC, Wibbelt G, Teeling EC. 2011. White-nose syndrome: is this emerging disease a threat to European bats? Trends Ecol. Evol. 26, 570–576. ( 10.1016/j.tree.2011.06.013) [DOI] [PubMed] [Google Scholar]
- 40.Frick WF, et al. 2015. Disease alters macroecological patterns of North American bats. Glob. Ecol. Biogeogr. 24, 741–749. ( 10.1111/geb.12290) [DOI] [Google Scholar]
- 41.Dobony CA, Hicks AC, Langwig KE, von Linden RI, Okoniewski JC, Rainbolt RE. 2011. Little brown myotis persist despite exposure to white-nose syndrome. J. Fish Wildl. Manage. 2, 190–195. ( 10.3996/022011-jfwm-014) [DOI] [Google Scholar]
- 42.Coleman JTH, Reichard JD. 2014. Bat white-nose syndrome in 2014: a brief assessment seven years after the discovery of a virulent fungal pathogen in North America. Outlooks Pest Manage. 25, 374–377. ( 10.1564/v25_dec_08) [DOI] [Google Scholar]
- 43.Maslo B, Valent M, Gumbs JF, Frick WF. 2015. Conservation implications of ameliorating survival of little brown bats with white-nose syndrome. Ecol. Appl. 25, 1832–1840. ( 10.1890/14-2472.1) [DOI] [PubMed] [Google Scholar]
- 44.Maslo B, Fefferman NH. 2015. A case study of bats and white-nose syndrome demonstrating how to model population viability with evolutionary effects. Conserv. Biol. 29, 1176–1185. ( 10.1111/cobi.12485) [DOI] [PubMed] [Google Scholar]
- 45.Thomas DW. 1995. Hibernating bats are sensitive to nontactile human disturbance. J. Mammal. 76, 940–946. ( 10.2307/1382764) [DOI] [Google Scholar]
- 46.Hunt A, Collins J, Langwig KE.2013. Swabbing Protocol for Geomyces destructans. See YouTube: https://www.youtube.com/watch?v=KU1EJPJXNPk.
- 47.Fenton MB, Barclay RMR. 1980. Myotis lucifugus. Mammal. Species 142, 1–8. ( 10.2307/3503792) [DOI] [Google Scholar]
- 48.Thomas DW, Fenton MB, Barclay RMR. 1979. Social behavior of the little brown bat, Myotis lucifugus. I. Mating behavior. Behav. Ecol. Sociobiol. 6, 129–136. ( 10.1007/BF00292559) [DOI] [Google Scholar]
- 49.Langwig KE, Frick WF, Hoyt JR, Parise KL, Drees KP, Kunz TH, Foster JT, Kilpatrick AM. 2017. Drivers of variation in species impacts for a multi-host fungal disease of bats. Phil. Trans. R. Soc. B 372, 20150456 ( 10.1098/rstb.2015.0456) [DOI] [PMC free article] [PubMed] [Google Scholar]
- 50.Thompson JN. 2013. Relentless evolution. Chicago, IL: University of Chicago Press. [Google Scholar]
- 51.Darimont CT, Carlson SM, Kinnison MT, Paquet PC, Reimchen TE, Wilmers CC. 2009. Human predators outpace other agents of trait change in the wild. Proc. Natl Acad. Sci. USA 106, 952–954. ( 10.1073/pnas.0809235106) [DOI] [PMC free article] [PubMed] [Google Scholar]
- 52.Strauss SY, Lau JA, Carroll SP. 2006. Evolutionary responses of natives to introduced species: what do introductions tell us about natural communities? Ecol. Lett. 9, 357–374. ( 10.1111/j.1461-0248.2005.00874.x) [DOI] [PubMed] [Google Scholar]
- 53.Colautti RI, Alexander JM, Dlugosch KM, Keller SR, Sultan SE. 2017. Invasions and extinctions through the looking glass of evolutionary ecology. Phil. Trans. R. Soc. B 372, 20160031 ( 10.1098/rstb.2016.0031) [DOI] [PMC free article] [PubMed] [Google Scholar]
- 54.Verant ML, Boyles JG, Waldrep W, Wibbelt G, Blehert DS. 2012. Temperature-dependent growth of Geomyces destructans, the fungus that causes bat white-nose syndrome. PLoS ONE 7, e46280 ( 10.1371/journal.pone.0046280) [DOI] [PMC free article] [PubMed] [Google Scholar]
- 55.Hoyt JR, Cheng TL, Langwig KE, Hee MM, Frick WF, Kilpatrick AM. 2015. Bacteria isolated from bats inhibit the growth of Pseudogymnoascus destructans, the causative agent of white-nose syndrome. PLoS ONE 10, e0121329 ( 10.1371/journal.pone.0121329) [DOI] [PMC free article] [PubMed] [Google Scholar]
- 56.Fenton A, Lello J, Bonsall MB. 2006. Pathogen responses to host immunity: the impact of time delays and memory on the evolution of virulence. Proc. R. Soc. B 273, 2083–2090. ( 10.1098/rspb.2006.3552) [DOI] [PMC free article] [PubMed] [Google Scholar]
- 57.Langwig KE, et al. 2015. Context dependent conservation responses to wildlife disease. Front. Ecol. Environ. 13, 195–202. ( 10.1890/140241) [DOI] [Google Scholar]
- 58.Wilder AP, Kunz TH, Sorenson MD. 2015. Population genetic structure of a common host predicts the spread of white-nose syndrome, an emerging infectious disease in bats. Mol. Ecol. 24, 5495–5506. ( 10.1111/mec.13396) [DOI] [PubMed] [Google Scholar]
- 59.Frick WF, Reynolds DS, Kunz TH. 2010. Influence of climate and reproductive timing on demography of little brown myotis Myotis lucifugus. J. Anim. Ecol. 79, 128–136. ( 10.1111/j.1365-2656.2009.01615.x) [DOI] [PubMed] [Google Scholar]
- 60.Smith KF, Acevedo-Whitehouse K, Pedersen AB. 2009. The role of infectious diseases in biological conservation. Anim. Conserv. 12, 1–12. ( 10.1111/j.1469-1795.2008.00228.x) [DOI] [Google Scholar]
- 61.Skerratt LF, Berger L, Speare R, Cashins S, McDonald KR, Phillott AD, Hines HB, Kenyon N. 2007. Spread of chytridiomycosis has caused the rapid global decline and extinction of frogs. EcoHealth 4, 125–134. ( 10.1007/s10393-007-0093-5) [DOI] [Google Scholar]
- 62.Faith DP, Magallón S, Hendry AP, Conti E, Yahara T, Donoghue MJ. 2010. Evosystem services: an evolutionary perspective on the links between biodiversity and human well-being. Curr. Opin. Environ. Sustain. 2, 66–74. ( 10.1016/j.cosust.2010.04.002) [DOI] [Google Scholar]
- 63.Langwig KE, Hoyt JR, Parise KL, Frick WF, Foster JT, Kilpatrick AM.. 2017. Data from: Resistance in persisting bat populations after white-nose syndrome invasion. Dryad Digital Repository. ( 10.5061/dryad.3372n) [DOI] [PMC free article] [PubMed] [Google Scholar]
Associated Data
This section collects any data citations, data availability statements, or supplementary materials included in this article.
Supplementary Materials
Data Availability Statement
Data are available from Dryad Digital Repository: [63].