Abstract
Spin-lattice relaxation (T1) has always been measured by inversion-recovery (IR), saturation-recovery (SR), or related methods. These existing methods share a common behavior in that the function describing T1 sensitivity is the exponential, e.g., exp(-τ/T1), where is the recovery time. In this paper, we describe a saturation-inversion-recovery (SIR) sequence for T1 measurement with considerably sharper T1-dependence than those of the IR and SR sequences, and demonstrate it experimentally. The SIR method could be useful in improving the contrast between regions of differing T1 in T1-weighted MRI.
Keywords: spin-lattice relaxation, saturation inversion recovery, T1 contrast, T1 dispersion
Graphical abstract
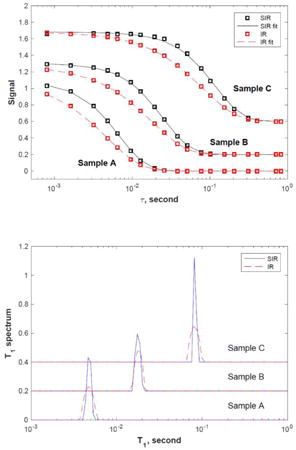
The inversion results show that both the IR and SIR methods yield the same T1 value of 4.5 ms (sample A),17 ms (sample B) and 79 ms (sample C), respectively. The SIR spectra are very similar to the IR ones but are noticably sharper.
1. Introduction
For many years, spin-lattice relaxation has always been measured by inversion-recovery (IR), saturation-recovery (SR), or related methods [1-3]. However, it is known that the resolution in T1 is limited in such measurements [4-6]; it can be challenging to reliably discriminate between T1 values less than half an order of magnitude apart. Better signal-to-noise ratio (SNR) may improve the discrimination between T1 values with the downside of longer acquisition times [7-10].
The primary reason for such lack of T1 resolution is that the magnetic resonance (MR) signal dependence on the relevant recovery time (recycle delay or inversion time) is smooth, not sharp [5-6]. For the saturation-recovery experiment, the signal KSR at a recovery time τ is:
| (1) |
This function describes the dependence of the signal on the experimental (τ) and material parameters (T1) for a single T1 value; we call this function the kernel of the experiment. For example, for τ = 1 s, the MR signal intensities corresponding to T1s of 1 sec and 1.1 sec are very close: within 6% of each other. If a mixed sample contains materials with multiple T1 values, the signal will be the sum of all components SSR(τ) = Σifi[1 – exp(−τ/T1i)], where T1i is the T1 value of the i-th component and fi is the weight of the component.
An experiment with a sharper kernel could improve the discrimination among different T1 components [5,6]. For example, if an experiment can be performed with the following kernel:
| (2) |
then the signal difference between T1 = 1 and 1.1 s is increased to 12%, thus better discriminating between the different T1s. In fact, higher exponents, such as K5(τ, T1) = [1 – exp(−τ/T1)]5, shown in Fig. 1, will make the kernel even sharper and further improve the discrimination between different T1 values.
Figure 1.
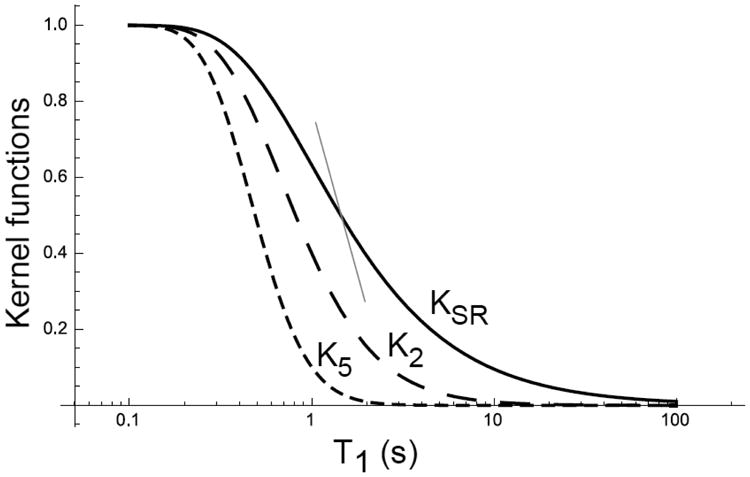
Plots of the kernel Kn for SR and other potential kernel functions at τ = 1 s. The solid curve for KSR exhibits a gentle decay slope. The dashed and dotted curves represent K2 and K5, respectively, and exhibit progressively steeper slopes. The thin red line shows the slope of K5 at K5 = 0.5, displaced horizontally to intersect the curve for KSR in order to highlight the difference between the two kernels.
In this paper, we describe an experimental implementation of the K2 kernel. We designed a pulse sequence which can perform the kernel K2 and demonstrated it experimentally on a high field spectrometer.
2. Description of the pulse sequence and experiment
2.1 Saturation-inversion-recovery (SIR) sequence
The SIR sequence is the 3-pulse sequence: 90° - τ - 180° - τ - 90° - acquisition. It can be viewed as an additional 90° pulse added in front of the IR sequence or a 180° pulse inserted in the middle of the SR sequence. The SIR sequence combines saturation and inversion processes, hence the name saturation-inversion-recovery sequence (SIR).
2.2 SIR kernel
For the SR sequence, immediately after each 90° saturation pulse, the longitudinal magnetization is zero (assuming transverse magnetization has dephased completely). Then the magnetization after the delay time τ follows Eq. 1, 1 – A, where A = exp(−τ/T1). Thus measurement using a series of τ values generates the T1 relaxation curve with signal recovery from zero to the thermal equilibrium value as shown in Figs. 2a and 2b. We define the thermal equilibrium normalized longitudinal magnetization equal to unity. For the IR experiment, after the 180° pulse, the magnetization is inverted and this magnetization decays from −A to zero. The recovery magnetization grows as 1 – A as τ increases; thus the total signal is 1 – 2A as shown in Figs. 2c and 2d. Such decay/recovery analysis is based on the coherent pathway formulism [11].
Figure 2.
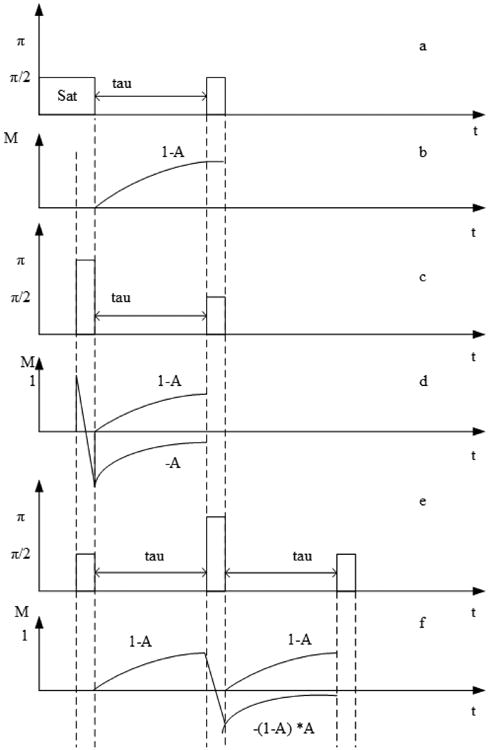
The magnetization recovery pathways of the several T1 sequences. (a) SR sequence diagram; (b) evolution of longitudinal magnetization in SR; (c) IR sequence diagram; (d) evolution of longitudinal magnetization in IR; (e) SIR sequence diagram; (f) evolution of longitudinal magnetization in SIR.
The SIR sequence adds a 90° pulse before the IR sequence as shown in Fig. 2e, with the corresponding magnetization evolution shown in Fig. 2f. After the first 90° pulse, the longitudinal magnetization grows as 1 – A. The 180° pulse inverts it to −(1 – A) which then decays during the second τ period as −(1 – A)A. During this second τ, a recovery magnetization grows as 1 – A. Thus the total signal is the sum of the two pathways:
| (3) |
2.3 Signal shape and coherence pathway phase cycling
Application of several RF pulses can create many coherence pathways and thus signals (some are echoes, e.g., for diffusion measurements) [5, 12-16]. With the 3-pulse sequence, 90°-180°-90°, 9 signals (5 echoes and 4 FIDs) should be created with 9 different coherence pathways. We denote the coherence pathway as [q0-q1-q2-q3]. q0 is the state before first 90° pulse, so q0 is the prepared state and therefore q0 = 0. q1, q2, q3 is the state after each of the 3 pulses, with q3 referring to the acquisition; by convention q3 = −1. There are 9 possible coherence pathways [17] listed in Table 1.
Table 1. Coherence pathways of SIR.
| Pathway | q0 | q1 | q2 | q3 |
|---|---|---|---|---|
| 1 | 0 | -1 | -1 | -1 |
| 2 | 0 | -1 | 0 | -1 |
| 3 | 0 | -1 | 1 | -1 |
| 4 | 0 | 0 | -1 | -1 |
| 5 | 0 | 0 | 0 | -1 |
| 6 | 0 | 0 | 1 | -1 |
| 7 | 0 | 1 | -1 | -1 |
| 8 | 0 | 1 | 0 | -1 |
| 9 | 0 | 1 | 1 | -1 |
For SIR, only the 5th signal [0, 0, 0, −1] is to be detected. We designed a phase cycling scheme to remove the unwanted signals: ph1 = [0° 90° 180° 270° 180° 270° 90° 0°], ph2 = [270° 180° 90° 0°], ph3 = phrec = [180° 270° 0° 90°]. Using this phase cycling, we observe a consistent signal phase for all τ values from very short (τ = 0.8 ms) through very long (τ = 2048 ms), demonstrating the selection of the single coherence pathway.
2.4 RF pulse error correction
For the SIR sequence, RF pulse inaccuracy and off-resonance effects are considered here. Fig. 3 a illustrates the pulse sequence with imperfect pulses and Fig. 3b shows the resulting signals with the 90° pulses replaced with α1 degree pulses, and the 180° pulse replaced by an α2 degree pulse. Transverse magnetization and residual longitudinal magnetization from the previous repetition of the pulse sequence are neglected in this analysis. Immediately following the α1 pulse a residual normalized longitudinal magnetization cosα1 remains, and it will decay as S″ = A cosα1 in the delay time τ where A = exp(−τ/T1). At the same time, another longitude magnetization will appear as S′ = (1 – A). Immediately following the α2 pulse, S′ and S″ are transferred to the inverse Z direction and then decay as S2 = S′Acosα2 and S3 = S″Acosα2 separately. Meanwhile, there will appear another longitudinal magnetization S1 = 1 – A. Thus after the last acquired RF pulse, the amplitude of the signal should be the sum of S1, S2 and S3, that is
Figure 3.
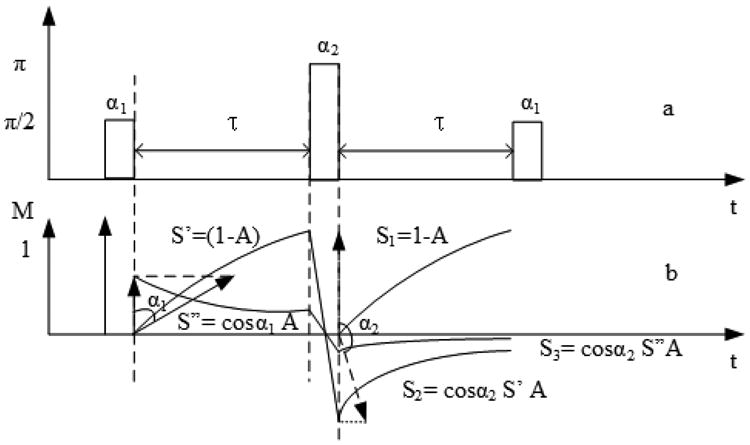
Analysis of SIR sequence with imperfect RF pulses. (a) Sequence diagram; (b) Evolution of the longitudinal magnetization.
| (4) |
To explore the consequences of inaccurate RF pulse lengths we define C1 = (1 – cosα2) and C2 = −cosα2(1 – cosα2) such that the SIR signal may be expressed as
| (5) |
If α1 = 90° and α2 = 180°, then SSIR = (1 – A)2 as given in Eq. 3. The T1 relaxation curve should begin (at τ = 0) with an amplitude of 0 if the pulses are perfect, and with an amplitude 1 – C1 + C2 if they are not. The variation of the terms C1 and C2 as well as the initial value of the relaxation curve are plotted in Fig. 4.
Figure 4.
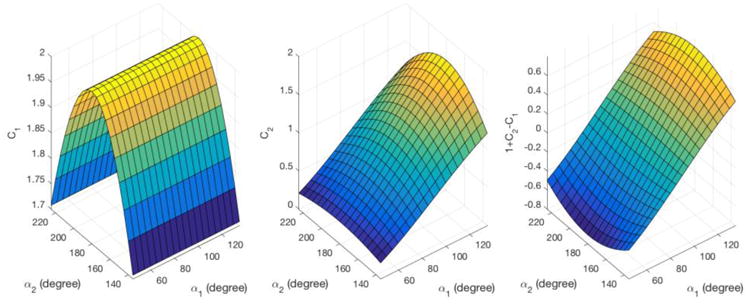
The dependence of C1, C2 and the initial value of the SIR T1 relaxation curve 1 – C1 + C2 on the flip angles α1 and α2. Left: C1 is strongly dependent on α2 and independent of α1. Center: C2 is strongly dependent on α1 and modestly on α2. Right: the initial value of the T1 curve exhibits a strong dependence on α1 and a much weaker dependence on α2.
Fig. 5 shows the simulated SIR relaxation curves for several α1 and α2 values around 90° and 180°, respectively. The simulations clearly demonstrate that small errors in the initial 90° pulse result in changes in the T1 relaxation curve while the effect due to the 180° pulse error is much smaller. This suggests that the use of a saturation pulse train for the initial pulse instead of a single 90° pulse could be advantageous.
Figure 5.
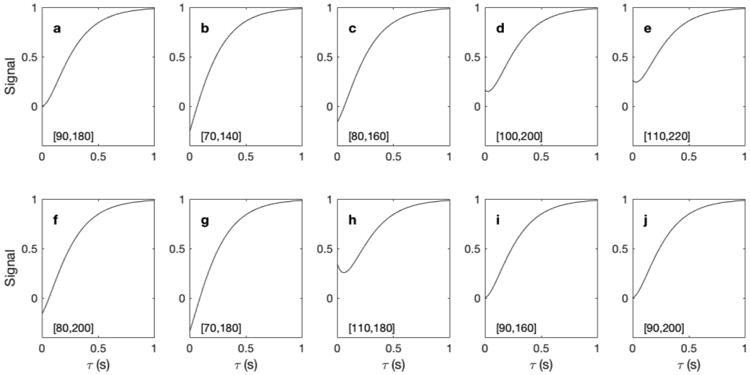
Simulated T1 recovery curve for different tipping angles of α1 and α2. (a-h) The [α1, α2] values (in degrees) are displayed in each panel. The T1 value in this simulation is 200 ms.
3. Experimental Results and Discussion
In order to test the SIR sequence, we prepared water solutions of CuSO4·5H2O yielding different T1 values. The concentrations of samples A, B, and C were 7.13%, 1.78% and 0.36% by weight, respectively. The experiments were performed on a Bruker BioSpin (Billerica, MA, USA) Avance II spectrometer interfaced to a Magnex 14T (600 MHz) 89 mm vertical bore magnet using a Bruker 5-mm solution probe. For measurements on mixed fluid samples, a Wilmad-LabGlass (Vineland, NJ, USA) 4.14-mm outside diameter spherical microcell insert was used to contain fluid 1, and the 5-mm NMR tube with 0.36 mm wall thickness to contain fluid 2. The outer and inner diameters of the microcell are 4.14 mm and 3.25 mm, respectively. Thus the sample volume inside the microcell was about 10% of total fluid for a coil length of 15 mm. For each sample, we carried out T1 measurements with the IR and SIR sequences using 22 recovery time values ranging from 0.8 to 2048 ms. The results are shown in Fig. 6 for the single fluid samples and Fig. 7 for the mixed fluid samples. The lengths of the pulses were adjusted to 90° and 180° (about 10 and 20 μs) for each sample.
Figure 6.
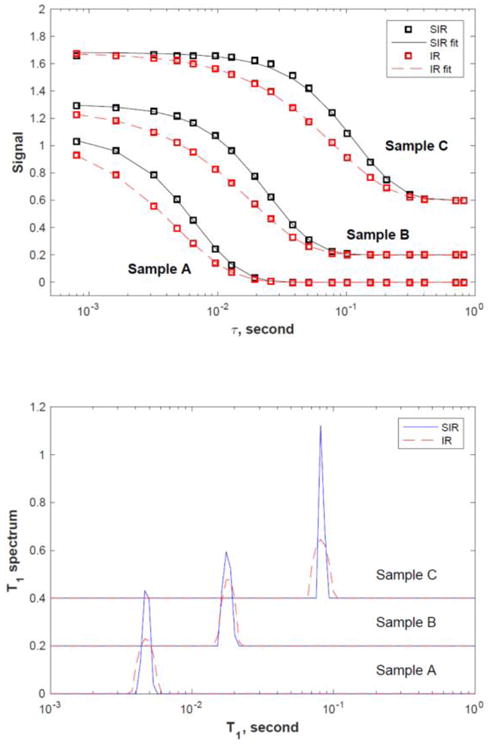
Decay signal curves, S(τ = ∞) – S(τ), (top panel, SIR: black circles, IR: red squares) and the corresponding T1 spectra (bottom panel, SIR: solid line, IR: dotted line) for samples A (4.5 ms), B (17 ms), and C (79 ms). The lines in the top panel are fitting results from the Laplace inversion. The data for sample B and C in both panels are shifted upward for clarity.
Figure 7.
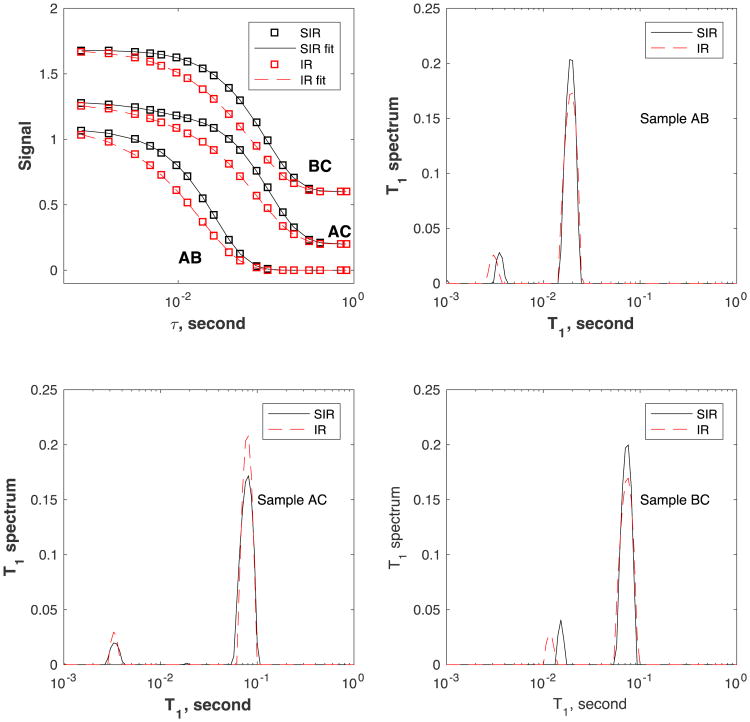
Signal decay curves S(τ = ∞) – S(τ) (top-left panel, SIR: black circles, IR: red squares) and corresponding T1 spectra (right and bottom panels, SIR: solid line, IR: dotted line) for the mixed samples AB, AC, and BC. The lines in the top-left panel are fitting results using the Fast Laplace inversion algorithm [18]. The data for samples AC and BC in the top-left panel are shifted upward for clarity.
The top panel of Fig. 6 shows the signal amplitude (S(τ = ∞) – S(τ)) as a function of the recovery time τ, for samples A, B and C, respectively. S(τ = ∞) is chosen to be the signal at the longest τ = 2048 ms for each sample. The IR data (red squares) is scaled by 1.8 in order to match the SIR data (black circles) for easy comparison. It is clear that the SIR decay is noticeably sharper than the corresponding IR decay for all samples. The lower panel shows the corresponding T1 spectra obtained using the Fast Laplace Inversion (FLI) algorithm [18] with the regularization parameter chosen to be 0.0001 for all measurements. The inversion kernel for SIR is shown in Eq. 6 and the values of C1 and C2 are calibrated using the experimental data of sample A (α1 = 84.6° and α2 = 180°) and used for all other samples.
The inversion results show that both the IR and SIR methods yield the same T1 value of 4.5 ms (sample A), 17 ms (sample B) and 79 ms (sample C), respectively. The SIR spectra are very similar to the IR spectra but are noticably sharper.
We also performed measurements on samples of mixed T1, such as A+B, A+C, and B+C, and the results are shown in Fig. 7. Similar to the data for the single-fluid samples, the SIR decay curves are much sharper than that for the IR experiment reflecting the different kernel. The SIR and IR spectra are shown in the same plot for each sample to allow easy comparison. All spectra show two peaks corresponding to the two fluids present in each sample. The large peak is due to fluid 2 in the 5-mm NMR tube while the smaller one is from the fluid in the microcell. The signal ratio of the small-to-large peaks is found to be 8.0%, 7.6%, 9.1% from SIR, and 8.5, 8.3%, 8.2% from IR, for the three samples (AB, AC, and BC), respectively. It appears that the variation of the smaller peak signal is less in the IR measurement. Both IR and SIR are able to isolate the different peaks and the linewidths of the individual peaks are similar for the SIR and IR measurements.
The position of the large peak is very consistent between the two measurements (SIR and IR). On the other hand, the smaller peaks are slightly different for the SIR and IR measurements. For example, for sample AB, the T1 value of the smaller peak is 3.1 ms for IR, and 3.5 ms for SIR. For sample AC, these values are 3.3 and 3.3 ms, and for sample BC, 11 and 15 ms, respectively. Comparing to the T1 values obtained from the single fluid samples, the T1 value of the smaller peak is less accurate in both SIR and IR measurements (SIR is slightly better). Such behavior (inaccuracy of the smaller amplitude signal in Laplace inversion) is expected [5].
Using theoretical analysis and experimentation, we demonstrate that the SIR approach for T1 measurement exhibits a kernel very different from that of conventional IR and SR measurements and their variants. This difference is most highlighted in the time-domain signals where the SIR sequence provides a significantly sharper τ or T1 dependence for both single-fluid samples and mixed-fluid samples. Such enhanced constrast could be used in measurements to better identify or detect sample constituents based on their T1 values, for example in T1-weighted MRI. In this scenario, enhanced T1 contrast might be achieved by inserting an SIR magnetization preparation module into the imaging pulse sequence to impose differential saturation among tissues. To better illustrate this hypothetical example, Fig. 8 plots the signal ratio of brain white matter (taking T1 ∼ 0.65 s) and grey matter (T1 ∼ 1 s), demonstrating a clear superiority of SIR contrast (defined as normalized signal ratio less unity) compared to conventional SR.
Figure 8.
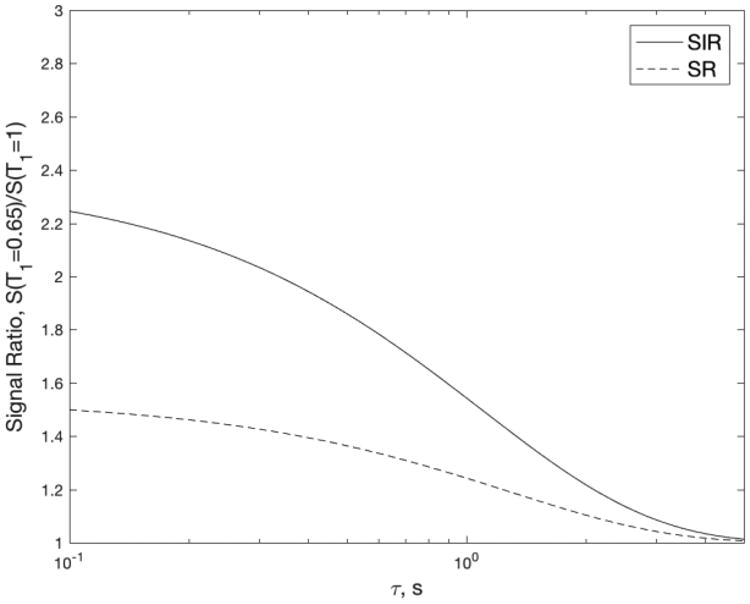
Ratio of signals with T1 = 0.65 s and 1 s as a function of the recovery time τ for SIR (solid line) and SR (dashed line) sequences. The higher value for SIR shows an improved contrast between the different T1 values. For example, at τ = 0.65 s, SIR achieves more than twice the contrast (defined as normalized signal ratio less unity) of SR.
When using Laplace inversion to obtain the T1 spectrum, we observed a significant improvement of T1 resolution in the single-fluid samples (single peak spectra). For the mixed 2-fluids samples where the difference of the T1 values is large, both SIR and IR methods are able to separate the two peaks. Application of the SIR method to broad T1 distributions (such as porous and biological samples) is ongoing.
As shown in Fig. 1, other functional forms, such as K5, may provide even an sharper kernel than K2 (KSIR). The question is whether a pulse sequence can be constructed to obtain such kernels. One option is to extend SIR to apply more 180° pulses with the same spacing τ between them. For convenience, we name these sequences SIRN where N is the number of 180° pulses. The kernel for such an SIR sequence family can be written as:
| (6) |
For example, when N = 0, the sequence corresponds to saturation recovery; when N = 1, to SIR. For N = 2,
| (7) |
Fig. 9 (left panel) plots the first few kernels in this family with N = 0, 1 and 2. Interestingly, sequences with higher N do not become sharper; in fact, they fall between SR and SIR.
Figure 9.
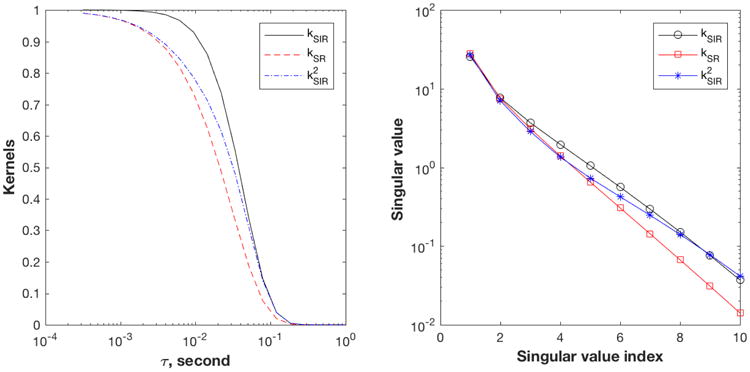
Comparison of kernels of SIR family sequences. SIR (solid line), SR (red dashed line) and SIR2 (blue dash-dotted line). Left: Signal decay curves for T1 = 0.03 s for the three sequences. Right: Plot of the singular values of the three kernels. The kernel matrices are evaluated as K(τ, T1) with 20 τ values from 0.3-1000 ms, and 100 T1 values from 1-1000 ms. SVD is calculated using MATLAB (Mathworks, Natick MA).
Singular value decomposition (SVD) is a useful approach to determine the quality of the kernels [5,6]. If a kernel is smooth, the singular values decay rapidly, indicating that the inversion is more ill-conditioned. Fig. 9 (right) plots the singular values of the three kernels showing that the decay of the singular values is slowest for SIR and fastest for SR, and therefore that the SIR kernel is less ill-conditioned than that of SR. The SIR2 singular values fall between SR and SIR, consistent with the picture from the τ dependence (Fig. 9 left).
4. Conclusion
This work reports the theory and experimental results of a T1 measurement scheme that combines at least two different T1 relaxation periods in the pulse sequence. This is quite different from traditional inversion-recovery and saturation-recovery. The traditional methods incorporate only one decay period, and thus the decay function is exponential. The SIR method changes the basic functional form of the relaxation decay and results in a noticeably sharper kernel, which can enhance discrimination between similar T1 values. It is possible to further improve it by incorporating relaxation intervals with different durations. In addition to benefiting NMR studies of porous media and other materials with wide T1 dispersion, this method could provide a significant improvement in T1-weighted MRI to yield higher contrast among tissues.
Highlights.
An improvement over conventional inversion-recovery (IR) or saturation-recovery (SR) spin-lattice relaxation time measurement is proposed.
The new method, saturation-inversion-recovery (SIR), combines saturation and inversion to achieve better discrimination between closely spaced T1 values.
Experimental demonstration of SIR method showing the sharper signal decay for single and multi-components samples indicative of improved differentiation of T1s.
An analysis of flip angle errors in SIR measurement is provided.
Acknowledgments
The work was supported by the Special Project for the Major Scientific Instrument Grant from China National Ministry of Science and Technology 2013YQ170406. Spectrometer laboratory support was provided by the Martinos Center and NIH grants S10RR013026 and P41EB015896. We thank Drs. Sara Sprinkhuizen and Jeffrey Paulsen for informative discussions.
Footnotes
Publisher's Disclaimer: This is a PDF file of an unedited manuscript that has been accepted for publication. As a service to our customers we are providing this early version of the manuscript. The manuscript will undergo copyediting, typesetting, and review of the resulting proof before it is published in its final citable form. Please note that during the production process errors may be discovered which could affect the content, and all legal disclaimers that apply to the journal pertain.
References
- 1.Kleinberg R. In: Encyclopedia of Nuclear Magnetic esonance. Grant DM, Harris RK, editors. Wiley; New York, USA: 1995. [Google Scholar]
- 2.Levitt MH. Basics of Nuclear Magnetic Resonance. Wiley; Chichester, UK: 2001. Spin Dynamics. [Google Scholar]
- 3.Munn K, Smith DM. A NMR Technique for the Analysis of Pore Structure: Numerical Inversion of Relaxation Measurements. J Colloid Interface Sci. 1987;19:117–126. [Google Scholar]
- 4.Kleinberg RL, Vinegar HJ. NMR properties of reservoir fluids. Log Anal. 1996;37:20–32. [Google Scholar]
- 5.Song YQ, Venkataramanan L, Burcaw L. Determining the resolution of Laplace inversion spectrum. J Chem Phys. 2005;122:104104. doi: 10.1063/1.1858436. [DOI] [PubMed] [Google Scholar]
- 6.Song YQ. Resolution and uncertainty of Laplace inversion spectrum. Magn Reson Imag. 2007;25:445–448. doi: 10.1016/j.mri.2006.11.023. [DOI] [PubMed] [Google Scholar]
- 7.Whittall KP, MacKay AL. Quantitative interpretation of NMR relaxation data. J Magn Reson. 1989;84:134–152. [Google Scholar]
- 8.Parker R, Song YQ. Assigning uncertainties in the inversion of NMR relaxation data. J Magn Reson. 2005;174:314–324. doi: 10.1016/j.jmr.2005.03.002. [DOI] [PubMed] [Google Scholar]
- 9.Prange MD, Song YQ. Quantifying uncertainty in NMR T2 spectra using Monte Carlo inversion. J Magn Reson. 2009;196:54–60. doi: 10.1016/j.jmr.2008.10.008. [DOI] [PubMed] [Google Scholar]
- 10.Levitt MH, Madhu PK, Hughes CE. J Magn Reson. 2002;155:300–306. doi: 10.1006/jmre.2002.2520. [DOI] [PubMed] [Google Scholar]
- 11.Sigmund EE, Caudal N, Song YQ. Rapid T1 measurement via decay-recovery decomposition: applications in fringe field and distributed relaxation experiments. Solid State Nuclear Magn Reson. 2006;29:232–241. doi: 10.1016/j.ssnmr.2005.09.013. [DOI] [PubMed] [Google Scholar]
- 12.Natala I, Colan EH, Malcolm HL. Multiplex phase cycling. J Magn Reson. 2003;160:52–58. doi: 10.1016/s1090-7807(02)00108-8. [DOI] [PubMed] [Google Scholar]
- 13.Song YQ. Categories of coherence pathways for the CPMG sequence. J Magn Reson. 2002;157:82–91. doi: 10.1006/jmre.2002.2577. [DOI] [PubMed] [Google Scholar]
- 14.Borgia GC, Brown RJ, Fantazzini P. Uniform-penalty inversion of multi-exponential decay data ii. data spacing, T2 data, systematic data errors, and diagnostics. J Magn Reson. 2000;147:273–285. doi: 10.1006/jmre.2000.2197. [DOI] [PubMed] [Google Scholar]
- 15.Bain AD. Coherence levels and coherence pathways in NMR. A simple way to design phase cycling procedures. J Magn Reson. 1984;56:418–427. [Google Scholar]
- 16.Ollerenshaw J, McClung RE. Determination of NMR cogwheel phase cycle with XML. J Magn Reson. 2000;143:255–265. [Google Scholar]
- 17.Song YQ, Tang XP. A one-shot method for measurement of diffusion. J Magn Reson. 2004;170:136–148. doi: 10.1016/j.jmr.2004.06.009. [DOI] [PubMed] [Google Scholar]
- 18.Song YQ, Venkataramanan L, Hürlimann MD, Flaum M, Frulla P, Straley C. T(1)-T(2) correlation spectra obtained using a fast two-dimensional Laplace inversion. J Magn Reson. 2002;154:261–268. doi: 10.1006/jmre.2001.2474. [DOI] [PubMed] [Google Scholar]


