

Erratum for McLeod LD et al. Best (but oft-forgotten) practices: expressing and interpreting associations and effect sizes in clinical outcome assessments. Am J Clin Nutr 2016;103:685–93.
On page 688 of the above article, Table 1 presented incorrect formulas. The corrected table has been provided.
TABLE 1.
Common effect size formulas1
| Formula | Method | Example |
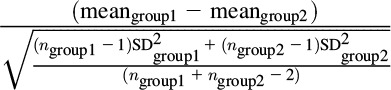 |
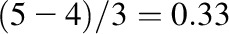
Cohen’s d | 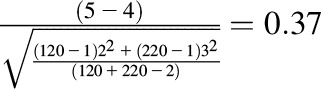 |
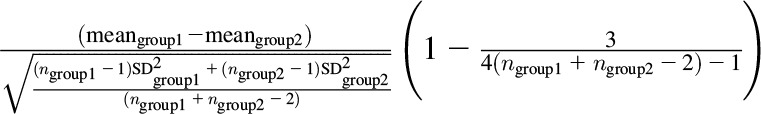 |
Hedges’s g approximate | 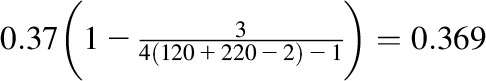 |
 |
Glass’s 
|
 |
 |
Effect size estimate of change | 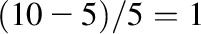 |
 |
Standardized response mean | 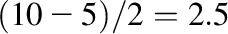 |
 |
Guyatt’s responsiveness statistic | 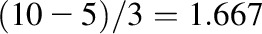 |
1
In the example, there are 2 groups: group 1 and group 2. Group 1 is the treatment group, and group 2 is considered the control group. meangroup1 = 5, meangroup2 = 4, ngroup1 = 120, ngroup2 = 220, SDgroup1 = 2, SDgroup2 = 3, meanfollow-up = 10, meanbaseline = 5, SDbaseline = 5, SDchange = 2, SDchange in stable group = 3.