Abstract
To better understand lung oxidant stress responses, we examined A549 lung cells exposed to H2O2 using “stable isotope labeling by amino acids” (SILAC). We identified 466 cytosolic and 387 nuclear proteins; H2O2 exposure produced ≥2 fold differences in 31, all were down-regulations. None were previously reported as oxidant stress response proteins, although they share common functions. One of the responders, treacle, was linked to p53, an important oxidative stress response. Treacher Collins-Franceschetti syndrome (TCS) can result from treacle mutation and insufficiency was suggested to cause increased p53 leading to the syndrome. However, results here indicate p53 and treacle responses to H2O2 are independent: treacle remains suppressed after p53 recovery; the threshold for treacle reduction is well above that for p53 induction; and treacle suppression by siRNA does not modify the p53 response. Evidence of treacle antioxidant activity include reduction being driven by proteasome degradation independently of mRNA, typical for oxidant-absorbing proteins, and increased sensitivity to H2O2 consequent to siRNA suppression. Data here: show a link between oxidative stress and treacle reduction; demonstrate that treacle does not control p53; provide evidence of a treacle oxidant defense role; support the hypothesis that oxidant stress plays a role in TCS; and raise the possibility that treacle plays an anti-oxidant role in lungs.
1 Introduction
Lungs are frequently exposed to exogenous reactive oxygen and nitrogen species (RONS) such as ozone, sulfur dioxide, and cigarette smoke plus endogenous RONS generated by immune cells acting against invaders and byproducts of normal aerobic metabolism. Such exposures, and defenses against them, are important because excessive oxidative stress plays a role in the pathogenesis of major lung diseases including cancers, emphysema and chronic obstructive pulmonary disease (COPD)[1]. RONS can damage tissues by induction of apoptosis or by necrosis resulting from indiscriminate oxidation of macromolecules [1, 2]. An immediate, but limited, oxidant defense is provided by small molecules such as glutathione, vitamin E, and uric acid as well as enzyme scavengers such as superoxide dismutases, catalase, and heme oxygenases. When excessive RONS cannot be adequately quenched by such mechanisms, cells respond with changes in expression of pro-apoptotic proteins (e.g., p53, Bax) and pro-survival proteins (e.g., Bc12, survivin, PI3K/Akt signaling pathway) with survival or death of affected cells depending on the balance of their actions[2]. Among the protein responses that favor survival is increased DJ-1 expression. DJ-1 can neutralize RONS via oxidation of a cysteine residue and is upregulated in human pneumocytes exposed to cigarette smoke in vitro and in vivo [3]. DJ-1 also activates the PI3K/Akt pathway [4] demonstrating cross-talk between pro-survival responses. Among the proteins favoring cells death is the powerful tumor suppressor and pro-apoptotic protein p53 which increases following H2O2 exposure or other stresses such as ionizing radiation [5, 6]. The importance of p53 is demonstrated by the resistance of p53-deficient cells to H2O2-induced cell death [7].
Motivated by the presumption that improved knowledge of oxidative stress responses will aid the search for means to reduce injury underlying many lung diseases, we studied proteomic shifts in the human pneumocyte cell line A549 resulting from exposure to H2O2. Using the quantitative proteomics approach of stable isotope labeling by amino acids in cell culture (SILAC) with analysis by gel-based liquid chromatography-mass spectrometry (GeLC-MS), we found 31 proteins with 2-fold or greater shifts in expression and all were down-regulated.
Of these, treacle was particularly interesting because Jones et al. [8] recently reported a connection between treacle insufficiency and increased p53. The name treacle is derived from Treacher Collins-Franceschetti syndrome (TCS), a condition involving craniofacial development defects [9, 10] that results from mutation of TCOF1, the treacle gene. Using a TCS mouse model driven by treacle haploinsufficiency [9], Jones et al. [8] found treatment with a p53 inhibitor rescued the TCS-like craniofacial abnormalities. Treacle is known to be involved in ribosome biogenesis and they proposed the hypothesis that treacle insufficiency interferes with ribosome formation causing nucleolar stress which leads to increased p53 and TCS-associated pathology. Our initial observation that H2O2 exposure causes a treacle decrease and p53 increase was consistent with this hypothesis, but other data we present show that the p53 increase following H2O2 exposure is not directly tied to the treacle decrease. We found proteasome-mediated protein degradation to regulate treacle, the same pathway that regulates p53, but these responses are independent and reduced treacle per se does not lead to increased p53. Proteasome pathway involvement and data showing treacle reduction by siRNA increases oxidant sensitivity suggest that, in addition to other functions, treacle plays a role in oxidant defense.
2 Materials and methods
Materials
Sigma: proteosome inhibitor MG-132, normal L-lysine (Lys0) and L-arginine (Arg0), and 37% H2O2. Invitrogen: Dulbecco’s Modified Eagle Medium (DMEM), SimplyBlue SafeStain. Pierce Laboratories: DMEM medium for SILAC (deficient in L-arginine and L-lysine), fetal bovine serum (FBS), dialyzed FBS. Cambridge Isotope Laboratories: 13C6 L-arginine (Arg6), 13C6 15N2-L-lysine (Lys8). Santa Cruz Biotech.: Mouse monoclonal antibodies (against p53, lamin A/C, β-actin), and the horseradish peroxidase (HRP)-conjugated goat anti-mouse immunoglobulin secondary antibody. Abonova: Mouse monoclonal antibody against treacle. Applied Biosystems: TaqMan reagents including reverse transcription reagents, Universal Master Mix, primers/TaqMan probes for human TCOF1/actin. Some other reagents are specified in the text.
A549 Cell Culture and H2O2 treatment
The human pneumocyte cell line A549 was obtained from American Type Culture Collection and cultured in complete DMEM medium at 37 °C in humidified atmosphere with 5% CO2. For SILAC experiments, “heavy SILAC medium” was composed of DMEM for SILAC supplemented with 13C6 L-arginine (Arg6) and 13C6,15N2-L-lysine (Lys8) to final concentrations of 0.4 mM and 1.0 mM, respectively, 10% dialyzed FBS, and 1% streptomycin/penicillin. “Light SILAC medium” was the same, but the heavy isotope amino acids were substituted by normal L-arginine (Arg0) and L-lysine (Lys0). After six passages, cells grown in 10 cm culture dishes with heavy SILAC medium were harvested at 6 hr after exposure to 1 mM H2O2 while control cells grown in light SILAC medium were not exposed to H2O2.
Control of treacle expression by siRNA
A549 cells plated in 12-well culture dishes were transfected with 100 nM ON-TARGETplus SMARTpool human TCOF1 siRNA or control (non-specific) siRNA constructs and DharmaFECT 1® transfection (Dharmacom). Treacle protein expression level was assessed by western blot at 24 h, 48 h, and 74 hr post transfection. To evaluate the effect of H2O2 on p53 expression in the treacle knockdown cells, cells were exposed to H2O2 48 h post transfection. For studies of siRNA treacle downregulation and sensitivity to H2O2-induced cytotoxicity, cells were seeded in 12-well plates and grown to approximately 80% confluence before exchange with fresh medium containing H2O2 at concentrations reported in Results.
H2O2 Toxicity Assay
Susceptibility to H2O2 was determined using the alamarBlue assay (Biosource) as previously described [3]. Briefly, DMEM medium of cells transfected with treacle-specific or control siRNA was replaced with freshly prepared medium containing 1 mM H2O2 or control medium without H2O2. After incubation for 4 hr, culture medium for all 4 conditions was replaced with DMEM lacking H2O2 but containing 10% alamarBlue. After incubation for an additional 2 hrs, culture media were collected and absorbance at 570 nm and 600 nm recorded using DMEM medium as the blank. Metabolically active cells reduce alamarBlue which increases absorbance at 600 nm and cytotoxicity is reflected by a less marked increase. Following manufacturer’s instructions, reduction of alamarBlue absorbance was corrected according to the equation AR570=A570-(A600 × R0), where R0 is the correction factor. The toxicity of H2O2 exposure for cells transfected with treacle-specific siRNA was determined by normalizing alamarBlue results to results using similar cells that not exposed to H2O2. Control non-specific siRNA-transfected cells were compared in the same manner.
Primary cultures of human bronchial epithelial cells
Tracheobronchial epithelial cells were isolated bronchoscopically from two living human donors as previously described (11) and approved for these experiments by the Temple University Institutional Review Board for the Protection of Human Subjects. Briefly, a sleeved catheter enclosing 3-mm nylon bristles was introduced through the sampling channel of a fiberoptic bronchoscope and the airway mucosa in the vicinity of the right middle lobe and left lingular orifices was brushed under direct vision guidance. Up to four brushings were performed at each location. After removal, cells were dislodged by shaking the brush in ice-cold BEGM. The harvested cell suspension was filtered through a 100-μM Nitex filter and recovered cells were washed in ice-cold PBS then treated with 50 μg/ml of DNase. Cells were then resuspended in 2–5 ml of PBS for counting and determination of cell viability by trypan blue (0.4%) exclusion. Each harvest yielded 7 ± 2 million epithelial cells with viability of 95%. Cells were cultured in bronchial epithelial cell growth medium (Clonetics) in 100mm dishes coated with type VI human collagen. H2O2 treatment was performed on cultures at 80–100% confluence from either the first or second passage.
Cytosolic and nuclear protein fractionation
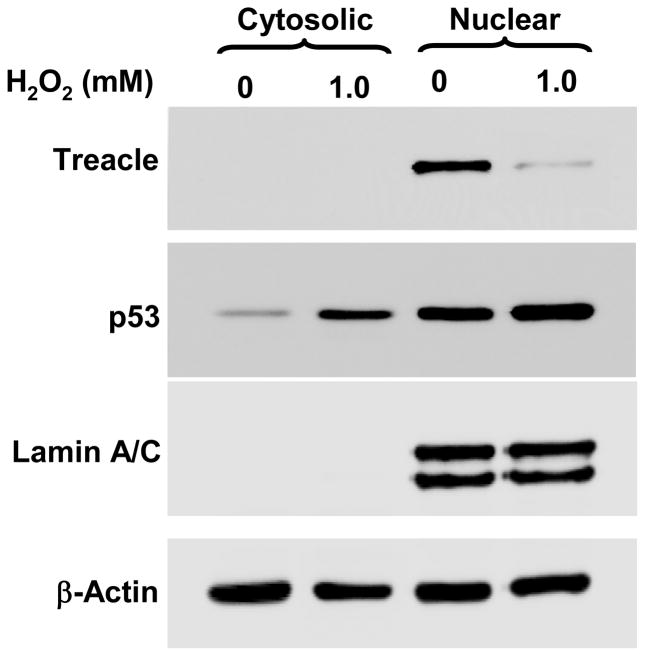
After the various treatments, cultures were harvested and cells pelleted by centrifugation at 280g for 10 min, and washed twice with 1×PBS. Cytosolic and nuclear proteins were extracted from the freshly harvested cells using a commercially available CelLyticTM NuCLERTM extraction kit (Sigma). Briefly, the washed cell pellets were gently resuspended in hypotonic lysis buffer consisting of 10 mM HEPES (pH 7.9), 10 mM KCl, 1.5 mM MgCl2, 1mM DTT, and 1 × protease inhibitor cocktail. After incubation on ice for 15 min to allow cells to swell, NP-40 detergent was added to 0.25% and the sample was vigorously vortexed for 10 sec to disrupt cell membranes. Centrifugation at 10,000 g for 30 seconds separated the cytosolic fraction (supernatant) from the nuclei-enriched fraction (pellet). The cytosolic fraction was stored at −80 °C. The nuclear fraction was washed twice with the hypotonic lysis buffer using the same centrifugation protocol then nuclear proteins were extracted from the nuclei by a hypertonic buffer (20 mM HEPES pH 7.9, 1.5 mM MgCl2, 0.42 mM NaCl, 25% [v/v] glycerol, 1mM DTT, and 1 × protease inhibitor cocktail) through vigorous agitation for 20 min at RT, centrifuged at 16,000 g for 10 min. The final supernatant (nuclear extract) was collected for storage at −80 °C. The specificity of this subcellular fraction method was supported by protein identification results (Supplemental Table S1) and imunoblot (Fig. 2).
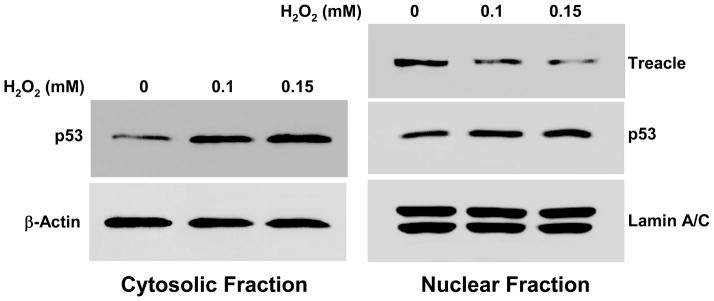
Figure 2. Immunoblot data showing treacle downregulation and p53 upregulation in A549 cells stressed by H2O2.
Cells were harvested at 6 hr after exposure to 1 mM H2O2, the same time point and condition for SILAC analysis. Treacle and Lamin-A/C control were detectable in nuclear fractions while p53 and β-actin control were detectable in both nuclear and cytoplasmic fractions. Exposure to 1 mM H2O2 caused reduced nuclear treacle, some increase in nuclear p53, a greater relative increase in cytoplasmic p53, and no changes in Lamin A/C or β-actin controls.
1D SDS PAGE Separation and In-Gel Trypsin Digestion
Samples containing a combined total of 30 μg of cytosolic or nuclear proteins (15 μg ‘heavy’ and 15 μg ‘light’) were diluted with Laemmli sample buffer (BioRad) containing 5% β-mercaptoethanol. The mixture was heated for 10 min at 80°C and loaded onto 10–14% polyacrylamide gel. 1D SDS PAGE separation was performed using a mini Protean II system (BiorRad) at 200 V for 45 min. Bands were visualized with SimplyBlue SafeStain and lanes were sliced into 12 sections which were diced into ~1 × 1 mm. Proteins in gel pieces were reduced by 30 min incubation at 37°C with 50 mM ammonium bicarbonate buffer containing 10 mM DTT. Proteins in the gel were alkylated by 30 min incubation in the dark at RT with 50 mM ammonium bicarbonate buffer containing 50 mM iodoacetamide. After destaining with 50% (v/v) acetonitrile in 50 mM bicarbonate and dehydration with pure acetonitrile, the gel pieces were covered with approximately 40 μl 12.5 μg/μl trypsin in 50 mM ammonium bicarbonate buffer. Incubation for digestion, peptide extraction, and sample cleanup and desalting using “Ziptips” were as previously described (3).
Nano-LC-IT MS and Data Analysis
Peptides were dried in a vacuum centrifuge then resolubilized in 30 μl of 0.1% (vol/vol) trifluoroacetic acid/H2O. Peptide samples were loaded onto 2 μg capacity peptide traps (CapTrap; Michrom Bioresources) and separated using a C18 capillary column (15 cm 75 μm, Agilent) with an Agilent 1100 LC pump delivering mobile phase at 300 nl/min. Gradient elution using mobile phases A (1% acetonitrile/0.1% formic acid, balance H2O) and B (80% acetonitrile/0.1% formic acid, balance H2O) was as follows (percentages for B, balance A): linear from 0 to 15% at 10 min, linear to 60% at 60 min, linear to 100% at 65 min. The nanoelectrospray ionization (nanoESI) tandem MS was performed using a HCT Ultra ion trap mass spectrometer (Bruker). ESI was delivered using distal-coating spray Silica tip (ID 20 μM, tip inner ID 10 μM, New Objective) at a spray voltage of −1300 V. Using an automatic switching between MS and MS/MS modes, MS/MS fragmentation was performed on the two most abundant ions on each spectrum using collision–induced dissociation with active exclusion (excluded after two spectra, and released after 2 min). The complete system was fully controlled by HyStar 3.1 software.
Mass spectra processing was performed using Mascot Distiller (Version 2.3.0.0) with search and quantitation toolbox options. The generated de-isotoped peak list was submitted to an in-house Mascot server 2.2 for searching against the Swiss-Prot database (version 56.6 of 16-Dec-2008, 405506 sequences). Mascot search parameters were set as follows: species, Homo sapiens (20413 sequences); enzyme, trypsin with maximal 1 missed cleavage; fixed modification, cysteine carbamidomethylation; variable modification, methionine oxidation; 0.50 Da mass tolerance for precursor peptide ions; and 0.6 Da for MS/MS fragment ions. SILAC K+8 R+6 was selected for quantitation. All peptides matches were filtered using an ion score cutoff of 10. The following two criteria were used to evaluate protein identification: one peptide with ion score ≥ 50, two or more peptides with at least one ion score ≥ 32 (p < 0.05 threshhold) and the cumulative Mascot scores ≥ 50; for all the proteins with cumulative Mowse scores ≥50 and ≤ 80, the theoretical and experimental gel molecular weights had to be consistent. When these criteria were used and the GeLC-MS data from the 1D SDS PAGE fractions of cytosolic proteins were used to search against a reversed decoy Swiss-Prot database, there was only one false positive match (false discovery < 0.25%, Supplemental Table S1 represents 466 unique protein in cytosolic fraction). SILAC ratios for heavy and light peptide pairs were calculated by Simpsons integration method using the “Simple Ratio” software setting (ratio calculated from integrated areas). Protein expression ratios in Tables 1 and 1S are the average of at least 2 unique heavy and light peptide pairs; acceptance required the correlation coefficient of peptide pair to be ≥0.90 and charges to be +2 or +3. The method auto was selected for the removal of outlier peptide pairs, meaning Dixon’s method for peptides number between 4–25, Rosner’s method for peptide number > 25 (http://www.matrixscience.com/help/quant_statistics_help.html). Geometric standard deviations of peptide pair SILAC ratios in Tables 1 and 1S are presented to reflect measurement consistency. As commonly used for SILAC analyses[11, 12], we set the threshold for expression change consequent to H2O2 exposure at 2-fold (L/H ratios ≥ 2 or ≤ 0.5). To reduce errors caused by possible interfering peaks, we manually confirmed peptide SILAC ratios for the proteins included in Table 1.
Table 1.
Proteins with ≥ 2 fold changes 6 hours after adding 1 mM H2O2 to culture medium
| Swiss-ProtAccession | Protein Name | Mascot Score | Ratio (L/H) | S.D. (Geo.) | # Pep.* |
|---|---|---|---|---|---|
| Function: Cell growth and proliferation | |||||
| CAPR1_HUMAN | Caprin-1 | 198 | 2.14 | 1.26 | 3 |
| PA2G4_HUMAN | Proliferation-associated protein 2G4 | 223 | 2.11 | 1.15 | 4 |
| TCOF_HUMAN | Treacle protein | 238 | 2.05 | 1.19 | 4 |
| Function: Transcription | |||||
| TCP4_HUMAN | Activated RNA polymerase II transcriptional coactivator p15 | 75 | 2.09 | 1.12 | 2 |
| Function: Protein synthesis | |||||
| EF1G_HUMAN | Elongation factor 1-gamma | 230 | 2.70 | 1.18 | 3 |
| IF4A1_HUMAN | Eukaryotic initiation factor 4A-I | 142 | 2.12 | 1.02 | 2 |
| IF6_HUMAN | Eukaryotic translation initiation factor 6 | 85 | 2.72 | 1.27 | 2 |
| NACA_HUMAN | Nascent polypeptide-associated complex subunit alpha | 192 | 2.53 | 1.38 | 2 |
| RSSA_HUMAN | 40S ribosomal protein SA | 240 | 2.36 | 1.21 | 5 |
| RS3_HUMAN | 40S ribosomal protein S3 | 201 | 2.36 | 1.17 | 2 |
| RS2_HUMAN | 40S ribosomal protein S2 | 119 | 2.20 | 1.19 | 4 |
| RS9_HUMAN | 40S ribosomal protein S9 | 354 | 2.01 | 1.10 | 5 |
| RL18_HUMAN | 60S ribosomal protein L18 | 344 | 2.14 | 1.15 | 3 |
| RL19_HUMAN | 60S ribosomal protein L19 | 307 | 2.00 | 1.09 | 3 |
| RS5_HUMAN | 40S ribosomal protein S5 | 246 | 2.32 | 1.02 | 3 |
| RL10_HUMAN | 60S ribosomal protein L10 | 229 | 2.12 | 1.11 | 3 |
| RL14_HUMAN | 60S ribosomal protein L14 | 215 | 2.18 | 1.18 | 4 |
| RL13_HUMAN | 60S ribosomal protein L13 | 179 | 2.06 | 1.05 | 3 |
| RS7_HUMAN | 40S ribosomal protein S7 | 151 | 2.13 | 1.07 | 3 |
| RS10_HUMAN | 40S ribosomal protein S10 | 351 | 2.15 | 1.17 | 5 |
| RL12_HUMAN | 60S ribosomal protein L12 | 327 | 2.06 | 1.14 | 4 |
| RS14_HUMAN | 40S ribosomal protein S14 | 243 | 2.05 | 1.18 | 5 |
| RL26_HUMAN | 60S ribosomal protein L26 | 242 | 2.31 | 1.22 | 4 |
| RL27A_HUMAN | 60S ribosomal protein L27a | 167 | 2.30 | 1.08 | 3 |
| RS19_HUMAN | 40S ribosomal protein S19 | 145 | 2.05 | 1.07 | 2 |
| RS11_HUMAN | 40S ribosomal protein S11 | 95 | 2.15 | 1.02 | 2 |
| RS15A_HUMAN | 40S ribosomal protein S15a | 221 | 2.64 | 1.68 | 4 |
| RLA2_HUMAN | 60S acidic ribosomal protein P2 | 172 | 2.18 | 1.30 | 2 |
| RL35A_HUMAN | 60S ribosomal protein L35a | 145 | 2.10 | 1.19 | 3 |
| RS20_HUMAN | 40S ribosomal protein S20 | 94 | 2.14 | 1.17 | 4 |
| RS21_HUMAN | 40S ribosomal protein S21 | 93 | 2.27 | 1.38 | 2 |
# Pep. denotes the number of high quality SILAC paired peptides used for quantitation (Correlation coefficient ≥ 0.90 and double or triple charged). The protein SILAC ratio is the average value of all the peptide quantified for a given protein, and the geometrical standard deviation represents the consistency of SILAC ratio among different peptides.
Western blot analysis
Protein samples (20 μg) were separated by 10–14% gradient SDS-PAGE then transferred to a nitrocellulose membrane in a semi-dry blotting chamber (Biorad) at 10 V for 30 min. The membrane was blocked with 5% powdered milk in Tris-buffer saline solution (pH 7.6) containing 0.05% Tween-20 (TBS/T) then probed with antibodies that had been diluted either 1:500 (anti-p53 and anti-treacle mouse monoclonals) or 1:1000 (anti-lamin A/C mouse monoclonal, anti-β-actin mouse monoclonal, and HRP-conjugated goat anti-mouse secondary antibody). Membranes were incubated with primary antibodies overnight at 4°C, washed, and then incubated with HRP-conjugated goat anti-mouse at room temperature for 1 hr. A Western Lightening Chemiluminescence Plus kit (Pelkin Elkins) for HRP was used according to the manufacturer’s instruction and signals were captured onto X-ray film.
Quantitative PCR for mRNA
Total cellular RNA was extracted using TRI reagent (Sigma-Aldrich) and then treated with DNase I (Promega, Madison, WI) to eliminate genomic contamination. RNA purity and yield were estimated by 260/280 nm absorbance. cDNA synthesis reaction volumes of 100 μL contained 2 μg total RNA, 1× RT buffer, 5.5 mM MgCl2, 2.5 μM random hexamer primers, 500 mM dNTP’s, 40 U RNase inhibitor, and 125 U MultiScribe reverse transcriptase; synthesis was initiated at 25°C for 10 min then competed at 48°C for 30 min. Quantitative TaqMan PCR was performed using validated primer/probe sets for human TCOF1 (Applied Biosystems, Catalog # Hs00184390) and actin (Applied Biosystems, Catalog # 401846), Universal PCR Master Mix, and 100 ng cDNA in each reaction. Amplification was by 40 two-phase cycles of 15 sec at 95°C for denaturation and 60 sec at 60°C for synthesis; samples were run in duplicate. Relative quantitation of mRNA was by comparison of the cycle number to threshold for TCOF1 to that for actin.
3 Results
Overview of MS Analysis and oxidant stress by H2O2 exposure
We used a SILAC approach to study changes in protein expression by the human pneumocyte cell line A549 elicited by exposure to 1 mM H2O2, a concentration we selected based on our previous study of H2O2 toxicity for A549 cells [3]. To improve proteomic resolution, nuclear and cytoplasmic sub-cellular fractions were prepared prior to protein extraction. Proteins were identified by GeLC-MS, a process involving 1D SDS PAGE, trypsin digestion, and analysis by nanoflow liquid chromatography-tandem mass spectrometry (Nano-LC IT MS/MS). Samples for analysis contained equal amounts of protein from cell fractions prepared from cultures grown in “heavy medium” then stressed by H2O2 and from control cultures grown in light culture medium without exposure to H2O2. Because proteins from H2O2-stressed cells will have had amino acids labeled with heavy isotopes and controls not, peptides from experimental and control cells could be distinguished and quantified by Nano-LC IT MS/MS coupled with bioinformatics.
Proteome and H2O2 exposure
We detected 853 individual proteins in A549 cells: 466 primarily cytosolic and 387 primarily nuclear (Supplemental Table S1). Data processing by Mascot Distiller revealed 31 proteins with expression differences of 2-fold or greater after exposure to H2O2. Table 1 shows all 31 were found in nuclear fractions and all changes were down-regulations. Reported functions of these proteins are listed in Table 1, all of which are common to oxidative stress response proteins[13–16]. Based on Swiss-Prot database annotation, we divided them into 3 categories: 27 support protein synthesis which is consistent with multiple reports of global suppression of protein synthesis in response to oxidative stress [13–15]; 1 is involved in transcription control; and 3 are involved in cell growth/proliferation control. Despite having cellular functions known to be modified by oxidant stress, we are unaware of any prior reports of these proteins being part of an oxidative stress response. PA2G4 coded by Ebp1 is an example. We found 3 PA2G4 peptides in the cytosolic fractions and 3 in nuclear fractions, localization consistent with Swiss-Prot database annotation. This protein is upregulated in proliferating cells, enhances cell survival by prevention of apoptotic DNA fragmentation [17], associates with mature ribosomes, and rises with increased ribosome biogenesis [18]. When expression is inhibited by shRNA, both ribosome biogenesis and cell proliferation are substantially decreased [18, 19]. Another example is caprin-1 (cytoplasmic activation- and proliferation-associated protein 1). This protein is upregulated in proliferating cells and downregulated in confluent cells or cells deprived of growth factors [20]; experimental suppression of caprin-1 slows cell proliferation [21]. Caprin-1 was reported to be a glycosylphosphatidylinositol-linked membrane protein [22] and annotated in the human genome database as M11S1 (membrane component, chromosome 11, surface marker 1), but other results indicate a cytosolic location [20]. We found 3 caprin-1 peptides in nuclear fractions and 1 in the cytosolic fractions (Supplemental data Table S1). Since nuclear fractions were prepared by centrifugation following hypotonic lysis, they will have contained membrane fragments with associated proteins and this suggests a dual localization.
Treacle and p53 regulation
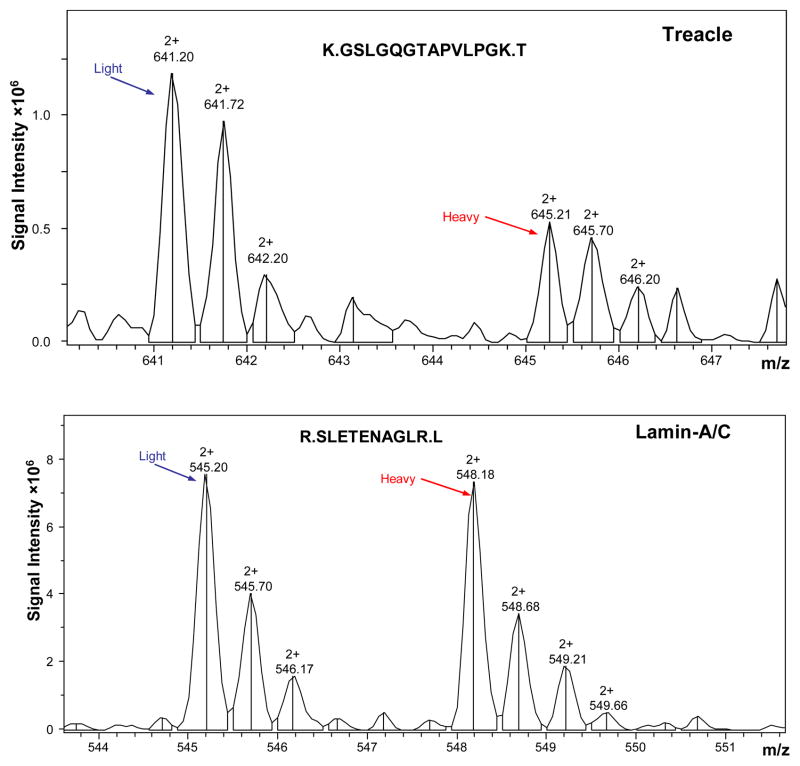
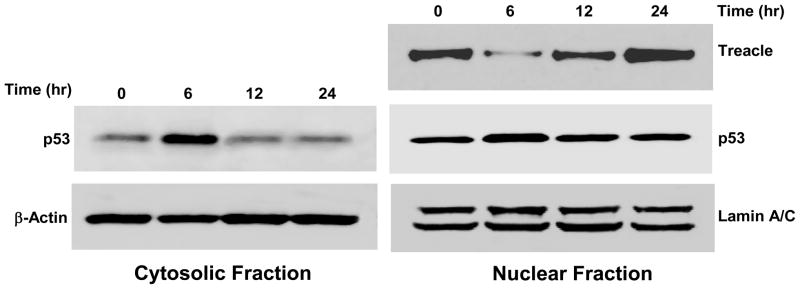
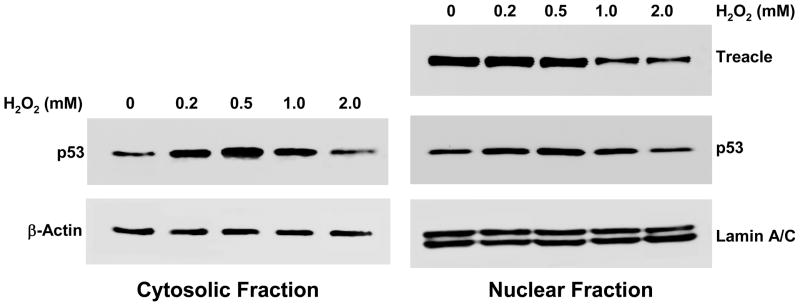
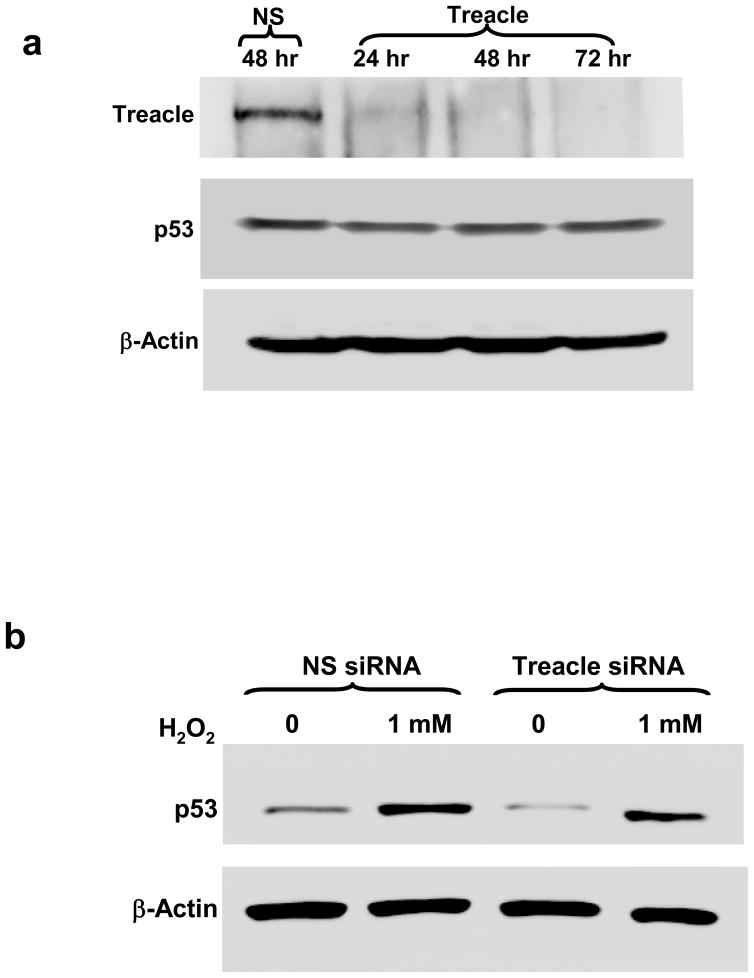
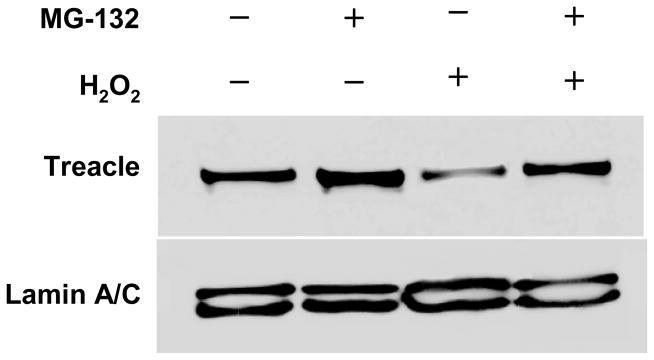
Treacle is a pro-survival protein associated with ribosome biogenesis, cell growth and proliferation [9, 10, 23] while p53 is a pro-apoptosis protein and one of the key regulators determining the fate of cells under oxidative stress [6, 8, 16]. SILAC data of nuclear proteins (Figure 1) show treacle downregulation in response to H2O2 exposure. Since oxidative stress is known to increase p53 [6, 16], this reduction in treacle combined with a report that treacle haploinsufficiency increases p53 and that inhibition of p53 blocks an experimental model of TCS [8] together supported the hypothesis that oxidant stress causes a reduction in treacle which triggers p53 upregulation. To test this, we examined treacle and p53 responses in more details. Because we did not detect p53 by Nano-LC IT MS/MS analyses, we used immunoblots to follow changes in p53 and treacle in A549 cells stressed by 1 mM H2O2 (Figure 2). In agreement with our SILAC analysis, immunoblots showed reduced treacle in the nuclear fraction of H2O2-treated cells. We found increased p53 in H2O2-treated cells as others have reported [6, 16]. Although the absolute amount of p53 was greater in nuclear fractions, the relative increase in response to H2O2 was greater in cytoplasmic fractions. We followed expression changes in A549 cells with time after H2O2 exposure (Figure 3). Changes in both treacle and p53 were prominent at 6 hr, but treacle remained low at 12 hr when cytosolic p53 expression had returned to normal levels and nuclear p53 was only slightly elevated. Dose-response data (Figure 4) show 1 or 2 mM H2O2 was necessary for treacle suppression, but only 0.2 or 0.5 mM H2O2 was required for increased p53; higher doses reduced the p53 response. Thus neither the time-course nor dose-response data are consistent with the hypothesis that decreased treacle is responsible for increased p53. Data from siRNA knock-down experiments (Figure 5) provide further evidence that treacle reduction is not directly coupled to increased p53. Treacle was strongly suppressed by treacle-specific siRNA, but this did not affect p53 (Figure 5a). Furthermore, the p53 response to H2O2 was the same regardless whether treacle was knocked down or not (Figure 5b). Since A549 cells are a transformed tumor cell line and have a relatively high tolerance to H2O2, we also examined the responses of primary bronchial epithelia cells to H2O2 treatment. In these primary cells, H2O2 downregulated treacle and upregulated p53 (Figure 6) similar to the manner observed in A549 cells, although a much lower dose was required (approximately one tenth used for A549 cells). To explore this further, mechanisms that could account for H2O2-mediated reduction of treacle were examined. Using a commercially supplied and validated TaqMan Q-PCR assay system to measure treacle mRNA, we found no significant treacle mRNA change in cells exposed to H2O2. At 0 hr, 1 hr, 3hr, 6 hr, and 24 hr after medium containing 1 mM H2O2 was added to cultures of A549 cells, the ratios of treacle message to actin control message were 1.08, 1.10, 1.08, 1.08, and 1.07, respectively; i.e., treacle mRNA did not change. Because proteins damaged by oxidation are commonly degraded through the proteasome pathway [24, 25], we tested the effect of the proteasome-specific inhibitor MG-132 on treacle reduction (Figure 7). When 10 μM of this inhibitor was added to cultures, the effect of H2O2 on treacle was blocked which indicates proteasome involvement in treacle downregulation. When cell were treated with MG-132 for 6 hr without exposure to H2O2, treacle increased significantly, a result suggesting a constitutively high treacle turnover rate. Because H2O2 exposure did not reduce treacle mRNA and loss of treacle protein could be blocked by the proteasome inhibitor MG-132, we conclude that treacle is controlled post-translationally by protein turnover, a mechanism that also controls p53 but in a reverse manner. Under normal conditions p53 has a short half-life and is kept at basal level by HDM2-mediated proteasome processing [26, 27]. Stress-induced increases in p53 are usually driven by mechanisms that uncouple HDM2-mediated ubiquitination which increases p53 stability [28].
Figure 1. SILAC data showing treacle downregulation in nuclei of A549 cells stressed by H2O2 exposure.
Cells exposed to H2O2 were grown in medium containing amino acids labeled with heavy isotopes allowing separation of peptides in mixed samples containing protein from cells not exposed to H2O2 that were grown in medium with light amino acids. The upper panel shows reduced peak heights of one heavy treacle peptide (right side of the panel) indicating reduced expression in response to H2O2 exposure. The lower panel shows that expression of the unrelated control protein Lamin-A/C was not altered by H2O2 indicating a specific effect.
Figure 3. Time course of H2O2 exposure and expression of treacle and p53.
Immunoblots show exposure to 1 mM H2O2 results in treacle downregulation and p53 upregulation in nuclear and cytoplasmic fractions at 6 hrs. Restoration of p53 to base expression in both fractions occurs more quickly than restoration of nuclear treacle. B-actin and Lamin-A/C controls remain unchanged. The data were representative of two independent experiments.
Figure 4. Dose responses of H2O2 and treacle/p53 expression.
The threshold for treacle response is 1.0 mM H2O2. In contrast, p53 responds to concentrations as low as 0.2 mM H2O2 and responds maximally to 0.5 mM H2O2. The data were representative of two independent experiments.
Figure 5. siRNA suppression of treacle and effect on p53.
(“NS” = transfection with non-specific control siRNA; “Treacle” = transfection with treacle-specific siRNA). a) Treacle-specific siRNA reduced treacle expression at 24 hrs and abolished expression at 48 hrs, but had no effect on expression of p53 or the β-actin control. b) The response of p53 to H2O2 was the same for cells transfected with treacle-specific and control siRNA. Neither siRNA nor H2O2 affected expression of the β-actin control. The data were representative of three independent experiments.
Figure 6. Human primary bronchial epithelial cells exposed to H2O2.
Treacle downregulation and p53 upregulation were detected at 6 hrs following exposure to H2O2. It should be noted that the dose for the primary cells is about one tenth of the dose used in A549. The data were representative of three independent experiments
Figure 7. Proteasome inhibitor MG-132 and suppression of treacle in A549 cell response to H2O2.
A549 cells exposed 1 mM H2O2 for 6 hr (lane 3) had reduced treacle compared to controls (lane 1). However, treacle did not decline if cells were first incubated with 10 MG-132 μM for 10 min prior to H2O2 exposure (lane 4) although the level was less than in cells treated with the inhibitor and not exposed to H2O2 (lane 2). These data are representative of three independent experiments.
Treacle and oxidant stress
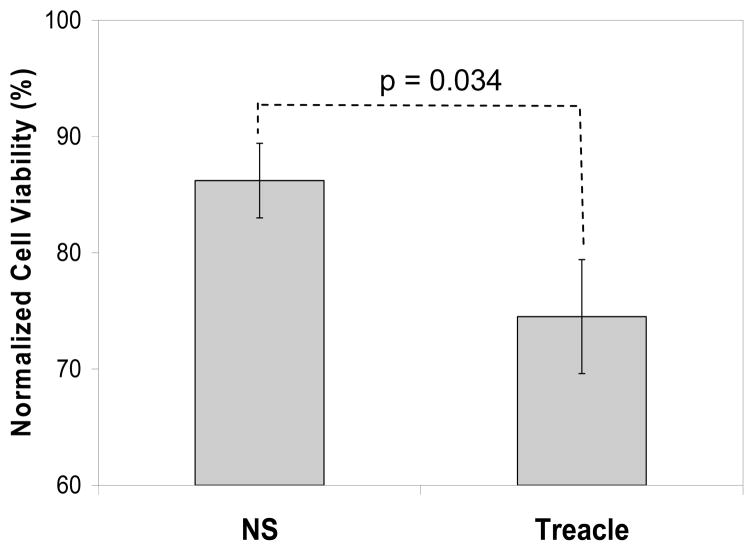
Although treacle and p53 expression are not linked, we tested whether treacle suppression would change the sensitivity of A549 cells to H2O2 exposure. Using a viability assay, we compared the sensitivities to 1 mM H2O2 of cells transfected 48 hrs earlier with either treacle-specific siRNA or non-specific control siRNA. Results shown in Figure 8 indicate a statistically significant decrease in viability associated with treacle suppression. This shift was moderate which is not surprising since RONS defense has many arms that would continue to function when one arm is impaired, but the effect of treacle suppression could be greater in cells with greater treacle expression.
Figure 8. Treacle suppression by siRNA increases sensitivity to H2O2:
48 hrs after transfection, cells were exposed to 1mM H2O2 for 4 hr and medium was replaced with fresh medium containing 10% alarmBlue reagent. After additional two hour incubation, the absorbance data for blue and red color were collected. Results were normalized by presenting viability as a percentage of measured viability of similarly transfected control cells not exposed to H2O2. Values are means ± SEM (n = 4) and the p value is a two-tailed student t-test result. “NS” = transfection with non-specific control siRNA; “Treacle” = transfection with treacle-specific siRNA
4 Discussion
Our original objective was to gain information relating to oxidative stress responses of the lung and the changes we found in protein expression of A549 lung cells exposed to H2O2 will contribute to that goal. While all the changes may be important, reduction of treacle presented an important opportunity, even if it temporarily shifted our focus away from lungs. We show treacle serves an oxidant protective role in A549 cells, but further work will be required to confirm this role in lungs. As noted in the Introduction, mutation of the treacle gene TCOF1 can cause the sometimes debilitating birth defect TCS. As discussed below, our data support the hypothesis that oxidative stress may play a role in TCS expressivity.
Treacle, p53 and PA2G4, another protein we found downregulated in response to H2O2 exposure (Table 1), are all known to affect ribosome biogenesis; treacle and PA2G4 positively and p53 negatively by suppressing RNA Pol I activity [29]. Treacle affects cell growth [9, 10] and regulates ribosome biogenesis positively by interacting with upstream binding factor (UBF), a RNA polymerase transcription factor [9]. Thus the expected consequences of reduced treacle and PA2G4 with increased p53 fit the oxidant stress pattern of diminished protein synthesis, particularly ribosomal proteins [13–15].
A more specific interpretation relates to recently published data from a mouse model of TCS driven by treacle haploinsufficiency generated by genetic manipulation [8]. The authors suggested that treacle, p53 and TCS are connected, a conclusion based their demonstration that mice deficient in treacle have increased p53 activity and the TCS phenotype that can be reversed by treatment with a p53 inhibitor. Using those points and established knowledge regarding the pathogenesis of TCS, these authors presented the hypothesis that treacle reduction causes increased p53 activity which initiates a cascade of events ultimately resulting in cell cycle arrest and apoptosis of embryonic neural crest cell progenitors, the loss of which results in TCS [8]. Our initial results showing H2O2 exposure to cause reduced treacle and increased p53 in A549 cells fit that hypothesis, but time-course and dose-response data show these to be independent responses (Figures 2, 3 and 4). Furthermore, direct suppression of treacle by siRNA neither induced p53 nor blocked H2O2-induced p53 upregulation (Figure 5). Thus for A549 cells in vitro, treacle suppression does not trigger a p53 increase and there is no crosstalk between these pathways. However, these conclusions do not argue against a role for p53 in development of TCS, but rather suggest a different cause for increased p53 activity when treacle is deficient as discussed below.
Our data show treacle reduction in A549 cells exposed to H2O2 is by proteasome digestion rather than a change in treacle mRNA (Figure 7) and also that siRNA suppression of treacle increases sensitivity to H2O2 (Figure 8). This is reminiscent of DJ-1, an anti-oxidant protein that absorbs RONS by becoming oxidized then degraded [3]. If treacle functions similarly, that would account for treacle knock-down cells being more sensitive to H2O2 and for treacle control by proteasome degradation since oxidized or otherwise inactivated proteins are generally removed by that route [24, 25]. We attempted detection of oxidized treacle isoforms using 2D gel immunoblot analysis as we had done with DJ-1 [3], but were unsuccessful. The likely reason relates to the difference in the predicted molecular weight from the genome sequence (150 kDa) and the SDS-PAGE measured weight (240 kDa), a discrepancy independent of the treacle source (whether A549 or primary bronchial epithelial cells) and the detection system (whether immunoblot or GeLC-MS). Such inconsistencies are often due to post-translation modifications such as glycosylation and the resulting high molecular weight (240 kDa) is often considered to be difficult for 2D gel separation. The hypothesis that treacle has a direct anti-oxidant function predicts that cells deficient in treacle will be more sensitive to oxidant stress and will therefore have a reduced H2O2 threshold for p53 activation. Although we show treacle suppression increases sensitivity to H2O2, we have no information on the threshold for p53 activation because the experiment presented in Figure 5 used a single concentration of H2O2 because it was designed to test the possibility of a direct, rather than indirect, connection between treacle reduction and p53 increase.
As reviewed above, inhibition of p53 blocks phenotypic expression of animal model TCS by preventing neuroepithelial apoptosis which rescues neural crest patterning defects thus avoiding the characteristic craniofacial abnormalities [8]; Since inhibition of p53 did not affect the ribosome deficit that has widely been thought to underlie TCS [10], the paper reporting the p53 - TCS connection [8] and a subsequent review [30] suggest that loss of an unknown treacle function(s) contributes to TCS pathogenesis both suggested the possibility that loss of an unknown treacle function contributes to TCS pathogenesis. Although we haven’t yet confirmed direct treacle oxidation, we present the hypothesis that treacle insufficiency causes neural crest cells to be more vulnerable to oxidant stress which increases the likelihood of increased p53 activity and initiation of the cascade leading to loss of neural crest progenitor cells. Determining whether treacle-deficient neural crest cells are particularly vulnerable to oxidative stress should be approachable.
Since environmental factors affect generation of and exposure to RONS, a link between oxidant stress and TCS pathogenesis would help explain the highly variable expressivity of the syndrome. Furthermore, if links among oxidant-stress, treacle, and TCS are confirmed, intervention attempts based on reduction of neural crest cell oxidant stress may prove more fruitful than proposed interventions based on inhibition of p53 or downstream effectors [8] which can be expected to have significant adverse effects since these support critical cell functions.
The hypothesis we present involves neural crest cells, but treacle is expressed in other tissues where it could serve an anti-oxidant function. We have not collected data on treacle expression in lungs and we find no published information, but our results with A549 lung cells and primary bronchial epithelia cells support the possibility that treacle plays an anti-oxidant role in lungs. These are issues that can be and should be addressed in the future studies.
Acknowledgments
This work was partially supported by National Institutes of Health (NIH) grant RO1AI064017.
Abbreviations
- Arg0
L-arginine without heavy isotope label
- Arg6
13C6 L-arginine
- COPD
chronic obstructive pulmonary disease
- GeLC-MS
gel-based liquid chromatography-mass spectrometry
- Lys0
L-lysine without heavy isotope label
- Lys8
13C6 15N2-L-lysine
- RONS
reactive oxygen and nitrogen species
- shRNA
short hairpin interfering RNA
- SILAC
stable isotope labeling by amino acids in cell culture
- siRNA
short interfering RNA
- TCS
Treacher Collins-Franceschetti syndrome
References
- 1.Yoshida T, Tuder RM. Pathobiology of cigarette smoke-induced chronic obstructive pulmonary disease. Physiol Rev. 2007;87:1047–82. doi: 10.1152/physrev.00048.2006. [DOI] [PubMed] [Google Scholar]
- 2.Martindale JL, Holbrook NJ. Cellular response to oxidative stress: signaling for suicide and survival. J Cell Physiol. 2002;192:1–15. doi: 10.1002/jcp.10119. [DOI] [PubMed] [Google Scholar]
- 3.Duan X, Kelsen SG, Merali S. Proteomic analysis of oxidative stress-responsive proteins in human pneumocytes: insight into the regulation of DJ-1 expression. J Proteome Res. 2008;7:4955–61. doi: 10.1021/pr800295j. [DOI] [PubMed] [Google Scholar]
- 4.Yang Y, Gehrke S, Haque ME, Imai Y, Kosek J, Yang L, Beal MF, Nishimura I, Wakamatsu K, Ito S, Takahashi R, Lu B. Inactivation of Drosophila DJ-1 leads to impairments of oxidative stress response and phosphatidylinositol 3-kinase/Akt signaling. Proc Natl Acad Sci U S A. 2005;102:13670–5. doi: 10.1073/pnas.0504610102. [DOI] [PMC free article] [PubMed] [Google Scholar]
- 5.Moll UM, Marchenko N, Zhang XK. p53 and Nur77/TR3 - transcription factors that directly target mitochondria for cell death induction. Oncogene. 2006;25:4725–43. doi: 10.1038/sj.onc.1209601. [DOI] [PubMed] [Google Scholar]
- 6.Desaint S, Luriau S, Aude JC, Rousselet G, Toledano MB. Mammalian antioxidant defenses are not inducible by H2O2. J Biol Chem. 2004;279:31157–63. doi: 10.1074/jbc.M401888200. [DOI] [PubMed] [Google Scholar]
- 7.Buschmann T, Yin Z, Bhoumik A, Ronai Z. Amino-terminal-derived JNK fragment alters expression and activity of c-Jun, ATF2, and p53 and increases H2O2-induced cell death. J Biol Chem. 2000;275:16590–6. doi: 10.1074/jbc.M910045199. [DOI] [PubMed] [Google Scholar]
- 8.Jones NC, Lynn ML, Gaudenz K, Sakai D, Aoto K, Rey JP, Glynn EF, Ellington L, Du C, Dixon J, Dixon MJ, Trainor PA. Prevention of the neurocristopathy Treacher Collins syndrome through inhibition of p53 function. Nat Med. 2008;14:125–33. doi: 10.1038/nm1725. [DOI] [PMC free article] [PubMed] [Google Scholar]
- 9.Valdez BC, Henning D, So RB, Dixon J, Dixon MJ. The Treacher Collins syndrome (TCOF1) gene product is involved in ribosomal DNA gene transcription by interacting with upstream binding factor. Proc Natl Acad Sci U S A. 2004;101:10709–14. doi: 10.1073/pnas.0402492101. [DOI] [PMC free article] [PubMed] [Google Scholar]
- 10.Dixon J, Jones NC, Sandell LL, Jayasinghe SM, Crane J, Rey JP, Dixon MJ, Trainor PA. Tcof1/Treacle is required for neural crest cell formation and proliferation deficiencies that cause craniofacial abnormalities. Proc Natl Acad Sci U S A. 2006;103:13403–8. doi: 10.1073/pnas.0603730103. [DOI] [PMC free article] [PubMed] [Google Scholar]
- 11.Lam YW, Evans VC, Heesom KJ, Lamond AI, Matthews DA. Proteomic analysis of the nucleolus in adenovirus-infected cells. Mol Cell Proteomics. 2009 doi: 10.1074/mcp.M900338-MCP200. [DOI] [PMC free article] [PubMed] [Google Scholar]
- 12.Pan C, Olsen JV, Daub H, Mann M. Global effects of kinase inhibitors on signaling networks revealed by quantitative phosphoproteomics. Mol Cell Proteomics. 2009 doi: 10.1074/mcp.M900285-MCP200. [DOI] [PMC free article] [PubMed] [Google Scholar]
- 13.Patel J, McLeod LE, Vries RG, Flynn A, Wang X, Proud CG. Cellular stresses profoundly inhibit protein synthesis and modulate the states of phosphorylation of multiple translation factors. Eur J Biochem. 2002;269:3076–85. doi: 10.1046/j.1432-1033.2002.02992.x. [DOI] [PubMed] [Google Scholar]
- 14.Pervin S, Tran AH, Zekavati S, Fukuto JM, Singh R, Chaudhuri G. Increased susceptibility of breast cancer cells to stress mediated inhibition of protein synthesis. Cancer Res. 2008;68:4862–74. doi: 10.1158/0008-5472.CAN-08-0074. [DOI] [PMC free article] [PubMed] [Google Scholar]
- 15.Shenton D, Smirnova JB, Selley JN, Carroll K, Hubbard SJ, Pavitt GD, Ashe MP, Grant CM. Global translational responses to oxidative stress impact upon multiple levels of protein synthesis. J Biol Chem. 2006;281:29011–21. doi: 10.1074/jbc.M601545200. [DOI] [PubMed] [Google Scholar]
- 16.Lee JH, Jeong MW, Kim W, Choi YH, Kim KT. Cooperative roles of c-Abl and Cdk5 in regulation of p53 in response to oxidative stress. J Biol Chem. 2008;283:19826–35. doi: 10.1074/jbc.M706201200. [DOI] [PubMed] [Google Scholar]
- 17.Ahn JY, Liu X, Liu Z, Pereira L, Cheng D, Peng J, Wade PA, Hamburger AW, Ye K. Nuclear Akt associates with PKC-phosphorylated Ebp1, preventing DNA fragmentation by inhibition of caspase-activated DNase. Embo J. 2006;25:2083–95. doi: 10.1038/sj.emboj.7601111. [DOI] [PMC free article] [PubMed] [Google Scholar]
- 18.Okada M, Jang SW, Ye K. Ebp1 association with nucleophosmin/B23 is essential for regulating cell proliferation and suppressing apoptosis. J Biol Chem. 2007;282:36744–54. doi: 10.1074/jbc.M706169200. [DOI] [PubMed] [Google Scholar]
- 19.Liu Z, Ahn JY, Liu X, Ye K. Ebp1 isoforms distinctively regulate cell survival and differentiation. Proc Natl Acad Sci U S A. 2006;103:10917–22. doi: 10.1073/pnas.0602923103. [DOI] [PMC free article] [PubMed] [Google Scholar]
- 20.Grill B, Wilson GM, Zhang KX, Wang B, Doyonnas R, Quadroni M, Schrader JW. Activation/division of lymphocytes results in increased levels of cytoplasmic activation/proliferation-associated protein-1: prototype of a new family of proteins. J Immunol. 2004;172:2389–400. doi: 10.4049/jimmunol.172.4.2389. [DOI] [PubMed] [Google Scholar]
- 21.Wang B, David MD, Schrader JW. Absence of caprin-1 results in defects in cellular proliferation. J Immunol. 2005;175:4274–82. doi: 10.4049/jimmunol.175.7.4274. [DOI] [PubMed] [Google Scholar]
- 22.Ellis JA, Luzio JP. Identification and characterization of a novel protein (p137) which transcytoses bidirectionally in Caco-2 cells. J Biol Chem. 1995;270:20717–23. doi: 10.1074/jbc.270.35.20717. [DOI] [PubMed] [Google Scholar]
- 23.Dixon J, Hovanes K, Shiang R, Dixon MJ. Sequence analysis, identification of evolutionary conserved motifs and expression analysis of murine tcof1 provide further evidence for a potential function for the gene and its human homologue, TCOF1. Hum Mol Genet. 1997;6:727–37. doi: 10.1093/hmg/6.5.727. [DOI] [PubMed] [Google Scholar]
- 24.Duan X, Berthiaume F, Yarmush D, Yarmush ML. Proteomic analysis of altered protein expression in skeletal muscle of rats in a hypermetabolic state induced by burn sepsis. Biochem J. 2006;397:149–58. doi: 10.1042/BJ20051710. [DOI] [PMC free article] [PubMed] [Google Scholar]
- 25.Grune T, Reinheckel T, Davies KJ. Degradation of oxidized proteins in mammalian cells. Faseb J. 1997;11:526–34. [PubMed] [Google Scholar]
- 26.Fang S, Jensen JP, Ludwig RL, Vousden KH, Weissman AM. Mdm2 is a RING finger-dependent ubiquitin protein ligase for itself and p53. J Biol Chem. 2000;275:8945–51. doi: 10.1074/jbc.275.12.8945. [DOI] [PubMed] [Google Scholar]
- 27.Stommel JM, Wahl GM. Accelerated MDM2 auto-degradation induced by DNA-damage kinases is required for p53 activation. Embo J. 2004;23:1547–56. doi: 10.1038/sj.emboj.7600145. [DOI] [PMC free article] [PubMed] [Google Scholar]
- 28.Toledo F, Wahl GM. Regulating the p53 pathway: in vitro hypotheses, in vivo veritas. Nat Rev Cancer. 2006;6:909–23. doi: 10.1038/nrc2012. [DOI] [PubMed] [Google Scholar]
- 29.Zhai W, Comai L. Repression of RNA polymerase I transcription by the tumor suppressor p53. Mol Cell Biol. 2000;20:5930–8. doi: 10.1128/mcb.20.16.5930-5938.2000. [DOI] [PMC free article] [PubMed] [Google Scholar]
- 30.Sakai D, Trainor PA. Treacher Collins syndrome: unmasking the role of Tcof1/treacle. Int J Biochem Cell Biol. 2009;41:1229–32. doi: 10.1016/j.biocel.2008.10.026. [DOI] [PMC free article] [PubMed] [Google Scholar]


