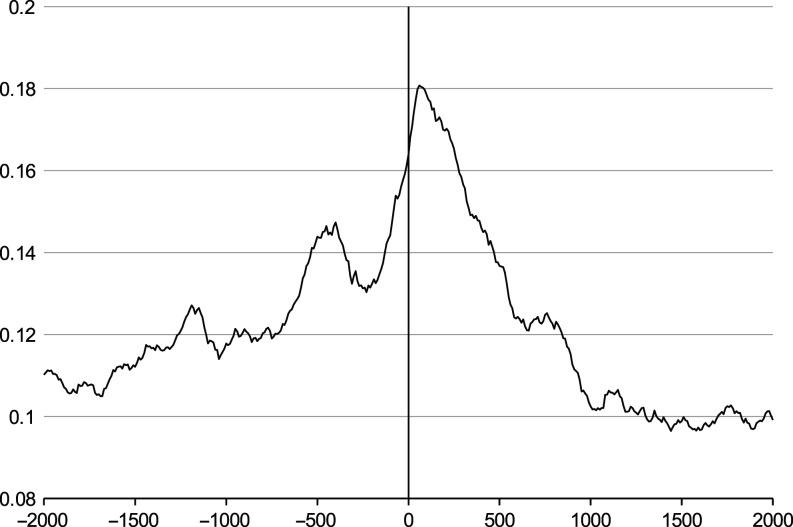
Figure 2.
The average histone enrichment relative to transcription start site (TSS). The average histone enrichment relative to transcription start site (TSS). X-axis – the distance in base pairs (negative values represent upstream region) from TSS of known genes. Y-axis – the average enrichment by histones of all nine samples. Histone enrichment is the highest immediately after TSS. Another peak at −500 bp from TSS indicates on gene promoter or enhancer regions. Only positions from 2000 bp upstream to 2000 bp downstream are shown for clarity.

 This work is licensed under a