Abstract
Background
The ventilatory response to exercise can be transiently adjusted in response to environmentally (e.g., breathing apparatus) or physiologically altered conditions (e.g., respiratory disease), maintaining constant relative arterial PCO2 regulation from rest to exercise (Mitchell and Babb, 2006); this augmentation is called short-term modulation (STM) of the exercise ventilatory response. Obesity and/or obstructive sleep apnea could affect the exercise ventilatory response and the capacity for STM due to chronically increased mechanical and/or ventilatory loads on the respiratory system, and/or recurrent (chronic) intermittent hypoxia experienced during sleep. We hypothesized that: 1) the exercise ventilatory response is augmented in obese OSA patients compared with obese non-OSA adults, and 2) the capacity for STM with added dead space is diminished in obese OSA patients.
Methods
Nine obese adults with OSA (age: 39 ± 6 yr, BMI: 40 ± 5 kg/m2, AHI: 25 ± 24 events/hr [range 6–73], mean ± SD) and 8 obese adults without OSA (age: 38 ± 10 yr, BMI: 37 ± 6 kg/m2, AHI: 1 ± 2) completed three, 20-min bouts of constant-load submaximal cycling exercise (8 min rest, 6 min at 10 and 30 W) with or without added external dead space (200 or 400 ml; 20 min rest between bouts). Steady-state measurements were made of ventilation (V̇E), oxygen consumption (V̇O2), carbon dioxide production (V̇CO2), and end-tidal PCO2 (PETCO2). The exercise ventilatory response was defined as the slope of the V̇E-V̇CO2 relationship (ΔV̇E/ΔV̇CO2).
Results
In control (i.e. no added dead space), the exercise ventilatory response was not significantly different between non-OSA and OSA groups (ΔV̇E/ΔV̇CO2 slope: 30.5 ± 4.2 vs 30.5 ± 3.8, p > 0.05); PETCO2 regulation from rest to exercise did not differ between groups (p > 0.05). In trials with added external dead space, ΔV̇E/ΔV̇CO2 increased with increased dead space (p < 0.05) and the PETCO2 change from rest to exercise remained small (<2 mmHg) in both groups, demonstrating STM. There were no significant differences between groups.
Conclusions
Contrary to our hypotheses: 1) the exercise ventilatory response is not increased in obese OSA patients compared with obese non-OSA adults, and 2) the capacity for STM with added dead space is preserved in obese OSA and non-OSA adults.
Keywords: Obesity, Sleep apnea, PCO2, Obesity hypoventilation syndrome
INTRODUCTION
Healthy, younger and older non-obese women and men exhibit an augmented exercise ventilatory response when challenged with added external dead space; this effect is termed short-term modulation (STM) of the exercise ventilatory response (Wood et al., 2008a, 2010, 2011). STM is a mechanism which modulates and adjusts the exercise ventilatory response in response to environmentally or physiologically increased respiratory dead space to maintain an appropriate ventilatory response and to preserve a constant relative arterial PCO2 (PaCO2) with respect to its resting level (Mitchell and Babb, 2006; Mitchell et al., 2008).
Adding dead space to the respiratory system increases resting neural respiratory drive, ventilation, and PaCO2 due to classical negative feedback from CO2 chemoreceptors; and subsequent ventilatory responses to exercise are increased independent from changes in chemoreceptor feedback from rest to exercise, demonstrating altered feed-forward contributions to breathing in exercise (Mitchell, 1990). Mitchell and colleagues (Bach et al., 1993; Henderson and Mitchell, 2000; Mitchell et al., 2008) demonstrated that STM requires the activation of spinal serotonin receptors in goats; the relevant serotonin receptors have been postulated to be located on respiratory motor neurons (Mitchell et al., 2001). Serotonin receptor activation may render respiratory motor neurons more excitable, enhancing respiratory muscle activation and ventilation for the same descending neural respiratory drive during exercise (Mitchell and Johnson, 2003). Obesity places a unique challenge on the respiratory system due to increased chest wall and abdominal fat compressing the lungs, leading to low lung volume breathing (Babb et al., 2008) and an increase in the work of breathing, especially during exercise (Bernhardt and Babb, 2014; Bhammar et al., 2016; Gibson, 2000; Kress et al., 1999). Despite these challenges, the ventilatory response to exercise is usually preserved in obese adults when corrected for the increased metabolic cost of a given work rate (Wasserman and Whipp, 1975).
Obesity is one of the strongest risk factors for developing obstructive sleep apnea (OSA) (Young et al., 1993); up to 77% of obese individuals are diagnosed with OSA (Frey and Pilcher, 2003; Lopez et al., 2008; O'Keeffe and Patterson, 2004). Conversely, OSA may contribute to weight gain and obesity (Carter and Watenpaugh, 2008; Shah and Roux, 2009). OSA is characterized by repetitive episodes of upper airway obstruction during sleep (i.e., developing increased respiratory pressures, sleep fractionation and chronic intermittent hypoxia (CIH). Thus, obese OSA patients are often burdened by multiple factors, including obesity and OSA-related respiratory challenges.
CIH elicits plasticity in the central neural control of breathing via serotonin-dependent mechanisms (Ling et al., 2001). Repetitive activation of serotonin receptors during CIH elicits long lasting enhancement of synaptic inputs to respiratory motor neurons and, potentially, their responses to increased neural respiratory drive associated with exercise (Ling et al., 2001) (i.e., increased neural output from motor neurons to respiratory muscles, thereby increasing the exercise ventilatory response). Obesity and CIH associated with OSA may impact STM in multiple ways. First, since CIH preconditioning enhances the ability to express serotonin-dependent respiratory motor plasticity (Gerst et al., 2011; Ling et al., 2001), including CIH accompanied by other attributes of OSA (Lee et al., 2009), serotonin-dependent STM may be enhanced in OSA patients. On the other hand, the capacity for STM is limited in both animal models (Mitchell, 1990) and normal humans (Wood et al., 2008a, 2010, 2011), suggesting that mechanical impairment associated with obesity and increased upper airway resistance may overload the system, diminishing the ability to express further STM with the addition of respiratory dead space.
STM (or lack thereof) has never been studied in obese humans, either with or without OSA. Thus, we tested the hypotheses that: 1) otherwise healthy obese human subjects (without OSA) retain the capacity for STM with increased respiratory dead space, at least through a limited range; 2) the exercise ventilatory response in obese OSA patients is unchanged versus otherwise healthy obese adults; and 3) the capacity for STM with added respiratory dead space is enhanced in obese OSA patients.
METHODS
Subjects
Nineteen obese adults diagnosed with (n=9) or without OSA (n=8) were recruited via flyers and word-of-mouth from the UT Southwestern Clinical Center for Sleep and Breathing Disorders. The presence or absence of OSA was determined as part of their clinical evaluation via polysomnography using nasal air flow via nasal cannula, finger pulse oximetry, and thoracic respiratory effort at a minimum to score apnea/hypopnea events. An apnea-hypopnea index (AHI) was generated. Apnea is defined as a cessation of airflow for ≥10 s. Hypopnea is defined as a ≥50% reduction in airflow for ≥10 s coupled with a reduction in oxygen saturation (≥4%). OSA was defined as an AHI of greater than five events per hour during sleep (Epstein et al., 2009). Exclusion criteria included current smoker or recent history of smoking, cardiovascular disease, asthma, anxiety or depression, and prior use of sleep apnea treatment (such as continuous positive airway pressure). The study was approved by the UT Southwestern Medical Center and all subjects gave their written informed consent to participate.
Subjects visited the exercise physiology laboratory on two occasions and were asked not to eat or consume caffeine for at least 2 h before each visit. On visit 1, standard measurements of height, weight, and body circumferences (neck, chest, waist, hips). A resting ECG was performed to exclude any significant cardiovascular abnormalities. Spirometry, lung volumes, and diffusing capacity measurements were performed via whole body plethysmography (model V62W body plethysmograph, SensorMedics), according to ATS/ERS guidelines (1995; Pellegrino et al., 2005).
STM protocol
On visit 2, subjects performed the STM protocol used the same equipment as previously described (Wood et al., 2008a, 2010, 2011). Subjects were instrumented with forehead pulse oximeter and 3-lead ECG. All subjects performed submaximal exercise on an electromagnetically braked cycle ergometer. Subjects performed three 18-min trials, consisting of a 6-min rest period followed by 6 min at 10 W and 6 min at 30 W. One trial was a control with no added dead space; for the other two trials an external dead space with a volume of 200 or 400 mL was added to the breathing circuit. The order of the three trials was randomized. A rest period of 20 min was given in between trials. Expired gas was collected in 200 L expiratory bags at rest (last 3 min) and during each level of exercise (last 2 min) for determination of gas exchange (V̇O2, V̇CO2) and minute ventilation (V̇E). End-tidal PCO2 (PETCO2) and breathing frequency (Rf) was manually recorded from a capnograph every 15 s. Tidal volume (VT) was calculated as V̇E/Rf.
Data analysis
Anthropometric measures and pulmonary function variables were assessed using independent t-test. The exercise ventilatory response was defined as the slope of the V̇E-V̇CO2 relationship (ΔV̇E/ΔV̇CO2) as previously described (Wood et al., 2008a). STM was assessed using a two-way ANOVA with repeated measures on exercise (three levels: rest, 10W, 30W) and dead space (three levels: control, 200, 400 mL); Tukey’s posthoc test was used in individual comparisons to make statistical inferences. Ventilatory response to exercise (i.e., without added dead space) was assessed by comparing the resting, 10W, and 30W variables from the control trial (i.e., no dead space); one-way ANOVA with repeated measures (group and exercise level) was used. The effect of added dead space on ventilation at rest was assessed by comparing resting variables from the control trial (i.e. no dead space) with the resting variables from the 200 and 400 mL dead space trials; one-way ANOVA with repeated measures was used. Hypercapnic ventilatory response was determined by calculating the individual slopes of the ΔV̇E/ΔPETCO2 linear regression. All statistical analyses were performed with IBM SPSS Statistics Version 22. Data are presented as mean ± SD.
RESULTS
Two subjects (ID 508 and 520) were excluded from the main analyses due to suspected obesity hypoventilation syndrome, which is defined as the combined presence of obesity (i.e BMI > 30kg/m2) daytime hypoventilation/hypercapnia (i.e. PaCO2 >45 mmHg), and sleep-disordered breathing in the absence of alternative neuromuscular, mechanical or metabolic explanation for hypoventilation (for a review, see (Mokhlesi, 2010)). Data from these two subjects will be presented separately at the end.
Subject characteristics and pulmonary function
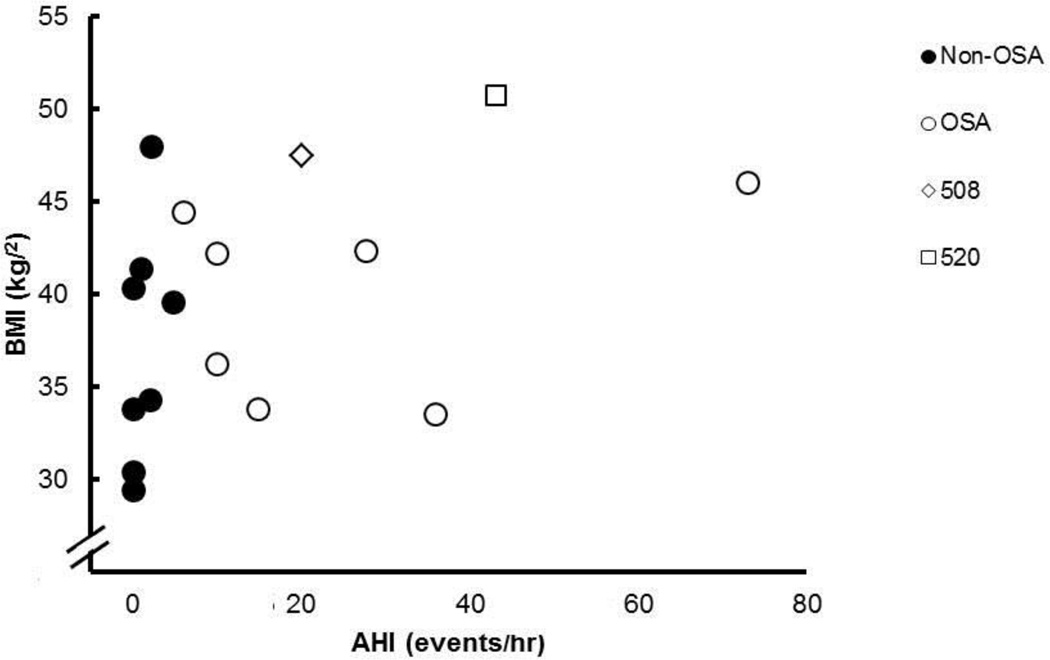
Subject characteristics were not different between the Non-OSA and OSA groups (Table 1). Body mass indexes ranged from 29.4 – 47.9 kg/m2. One subject was classified as overweight, five as obesity class I, two as obesity class II, and seven as obesity class III. In the OSA group, the AHI ranged from 6–73 events/hr. Three subjects were classified as having mild OSA (i.e., AHI ≥ 5 < 15), two had moderate OSA (i.e., AHI ≥ 15 < 30), and two had severe OSA (i.e., AHI ≥ 30). Neck circumference was significantly greater in the OSA group. Figure 2 shows the relationship between AHI and BMI.
Table 1.
Subject characteristics and pulmonary function.
| Non-OSA (n=8) | OSA(n=8) | |
|---|---|---|
| Age (yr) | 38 ± 10 | 39 ± 6 |
| Height (cm) | 170.0 ± 9.2 | 175.0 ± 5.8 |
| Weight (kg) | 106.8 ± 15.8 | 121.9 ± 17.5 |
| BMI (kg/m2) | 37.1 ± 6.3 | 39.8 ± 5.2 |
| AHI (events/hr) | 1.3 ± 1.7 | 25.4 ± 23.6 |
| Neck circumference (cm) | 39.5 ± 4.2 | 44.5 ± 3.7* |
| FVC (%pred) | 98 ± 7 | 95 ± 13 |
| FEV1 (%pred) | 94 ± 11 | 95 ± 11 |
| FEV1/FVC (%) | 79 ± 7 | 82 ± 3 |
| TLC (%pred) | 96 ± 8 | 89 ± 11 |
| FRC (%TLC) | 45 ± 2 | 39 ± 7 |
| IC (%pred) | 94 ± 11 | 98 ± 15 |
| ERV (L) | 1.0 ± 0.4 | 0.8 ± 0.4 |
| RV (%pred) | 76 ± 8 | 72 ± 12 |
| DLCO (%pred) | 86 ± 12 | 89 ± 18 |
| DLCO/VA (%pred) | 113 ± 11 | 126 ± 24 |
BMI, body mass index; AHI, apnea-hypopnea index; FVC, forced vital capacity; FEV1, forced expiratory volume in 1s; TLC, total lung capacity; FRC, functional residual capacity; IC, inspiratory capacity; ERV, expiratory reserve volume; RV, residual volume; DLCO, lung diffusing capacity; VA, alveolar volume; %pred, as a percent of predicted. Values are means ± SD.
p<0.05
Figure 2.
Relationship between apnea-hypopnea index (AHI) and body mass index (BMI) for non-OSA (filled circles), OSA (open circles), and special cases 508 (open diamond) and 520 (open square).
All subjects had normal spirometry and diffusing capacities; and normal or slightly reduced lung volumes (Table 1). There were no significant differences between groups in pulmonary function. No subject had significant changes in lung function following bronchodilator inhalation (data not shown).
Ventilation, breathing pattern, and gas exchange at rest and during exercise
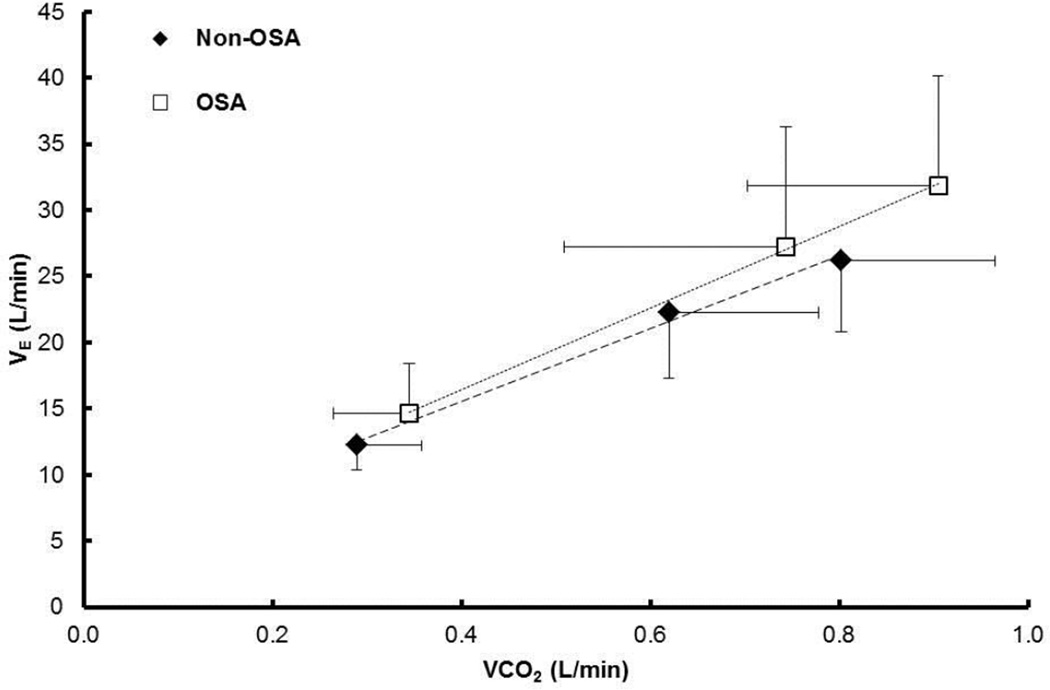
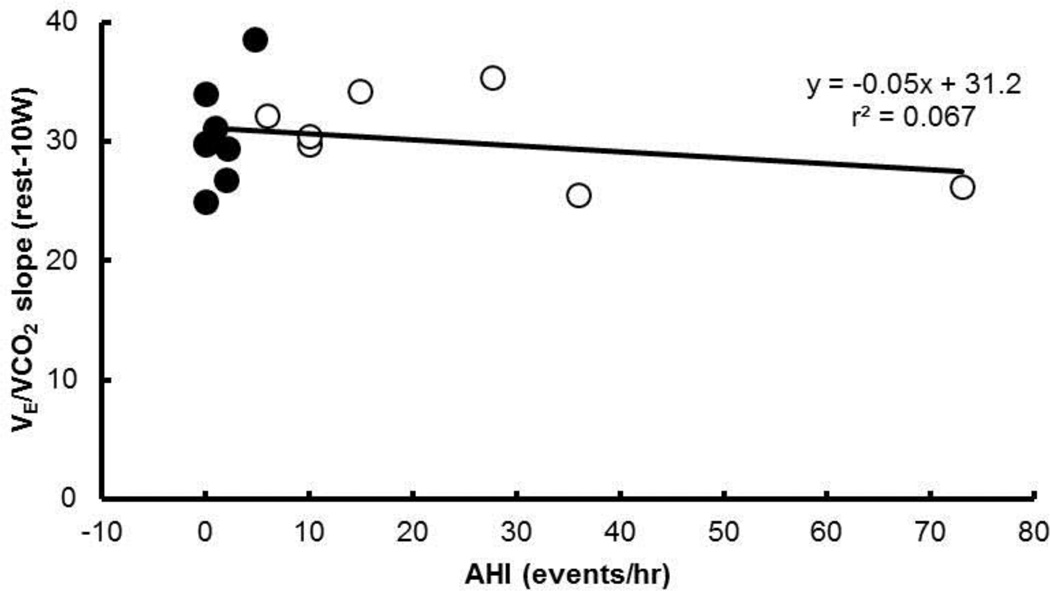
Table 2 shows the ventilatory, breathing pattern, and gas exchange responses at rest and during 10W and 30W of exercise without added dead space (i.e., control condition). No statistically significant differences between groups were observed in the measurements at rest (individual p-values given in table). However, V̇E tended to be higher in the OSA compared with the Non-OSA group (p = 0.129) (Figure 3). V̇E (p < 0.05), V̇CO2 (p < 0.05), and V̇O2 (p < 0.05) increased with exercise intensity (i.e., from rest to 10W to 30W). PETCO2 did not significantly differ from rest to exercise (p > 0.05). There was no association between the individual subject’s AHI and their slope of V̇E/V̇CO2 (Figure 4).
Table 2.
Ventilation, breathing pattern and gas exchange at rest and during exercise (i.e., control condition).
| Non-OSA (n=8) |
OSA (n=8) |
p-value group | p-value interaction |
|
|---|---|---|---|---|
| V̇E/V̇CO2 slope | ||||
| Rest-10W | 30.5 ± 4.2 | 30.5 ± 3.8 | 0.465 | NS |
| Rest-30W | 27.0 ± 3.3 | 30.1 ± 5.8 | ||
| PETCO2 (mmHg) | ||||
| Rest | 39.6 ± 1.9 | 38.6 ± 3.7 | 0.383 | NS |
| 10W | 40.7 ± 2.2 | 39.4 ± 3.7 | ||
| 30W | 41.3 ± 2.3 | 39.5 ± 4.7 | ||
| ΔPETCO2 (mmHg) | ||||
| Rest-10W | 0.8 ± 1.3 | 0.8 ± 2.4 | 0.793 | NS |
| Rest-30W | 1.5 ± 1.8 | 0.9 ± 2.6 | ||
| V̇E (L/min) | ||||
| Rest | 12.2 ± 1.9 | 14.7 ± 3.8 | 0.129 | NS |
| 10W a | 22.3 ± 5.0 | 27.2 ± 9.1 | ||
| 30W a,b | 26.2 ± 5.3 | 31.8 ± 8.3 | ||
| V̇CO2 (mL/min) | ||||
| Rest | 289 ± 69 | 345 ± 82 | 0.218 | NS |
| 10W a | 620 ± 158 | 744 ± 235 | ||
| 30W a,b | 802 ± 162 | 904 ± 203 | ||
| V̇O2 (mL/min) | ||||
| Rest | 353 ± 77 | 414 ± 77 | 0.165 | NS |
| 10W a | 756 ± 180 | 912 ± 278 | ||
| 30W a,b | 926 ± 172 | 1085 ± 252 | ||
| Rf (b/min) | ||||
| Rest | 15.6 ± 5.2 | 15.2 ± 2.9 | 0.507 | NS |
| 10W a | 20.0 ± 7.8 | 21.9 ± 7.1 | ||
| 30W a | 20.3 ± 7.7 | 25.6 ± 8.1 | ||
| VT (mL) | ||||
| Rest | 852 ± 299 | 984 ± 273 | 0.947 | NS |
| 10W a | 1212 ± 372 | 1256 ± 174 | ||
| 30Wa | 1421 ± 473 | 1277 ± 242 |
V̇E/V̇CO2, slope of the exercise ventilatory response (ΔV̇E/ΔV̇CO2) from rest to each level of exercise; PETCO2, end-tidal PCO2; Δ PETCO2, change in end-tidal PCO2; V̇E ventilation; V̇CO2,CO2 production; V̇O2, oxygen consumption; Rf, respiratory frequency; VT, tidal volume. Values are means ± SD.
significantly different from rest;
significantly different from exercise at 10W.
Figure 3.
Ventilatory response at rest and at 10W and 30W cycling exercise. Mean ± SD. The slope of ΔV̇E/ΔV̇CO2 was calculated from each individual subject’s linear regressions.
Figure 4.
Individual responses to submaximal 30W exercise. No association between the severity of sleep apnea (i.e., AHI) and the ventilatory response to exercise (i.e., slope of ΔV̇E/ΔV̇CO2).
Resting ventilatory response to added dead space
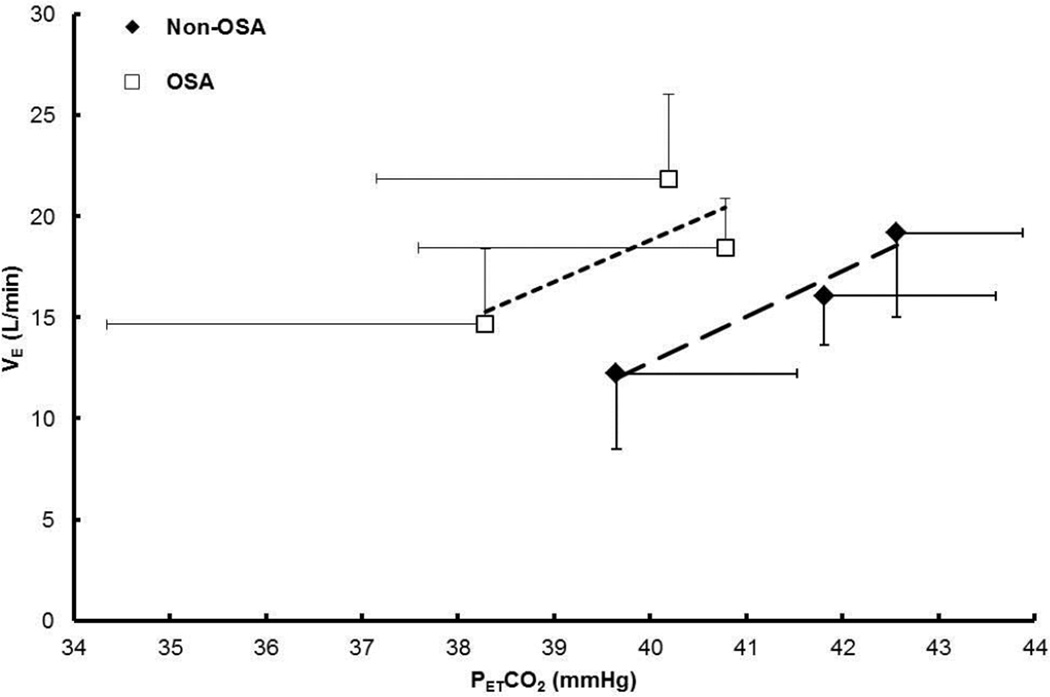
No statistically significant differences were observed between groups in the resting ventilatory response to added dead space (p-values in Table 3 and Figure 5). However, V̇E and V̇CO2 tended to be higher in the OSA compared with the Non-OSA group (p = 0.118 and p = 0.144, respectively). At rest, PETCO2 (p < 0.05) and V̇E (p < 0.05) were higher with added dead space than without in both groups, indicating that resting ventilatory response was augmented with dead space. The elevated V̇E was due to increases in VT (p < 0.05) only, not Rf (p > 0.05).
Table 3.
Ventilatory response to added dead space at rest.
| Non-OSA | OSA | p-value GRP | p-value interaction |
|
|---|---|---|---|---|
| PETCO2 (mmHg) | ||||
| Control | 39.4 ± 1.8 | 38.6 ± 3.7 | 0.348 | 0.051 |
| 200 ml DS a | 41.5 ± 1.9 | 40.8 ± 3.2 | ||
| 400 ml DS a | 42.4 ± 1.3 | 40.2 ± 3.0 | ||
| V̇E (L/min) | ||||
| Control | 12.5 ± 1.4 | 14.7 ± 3.8 | 0.118 | NS |
| 200 ml DS a | 16.4 ± 2.0 | 18.4 ± 2.5 | ||
| 400 ml DS a,b | 19.3 ± 3.6 | 24.9 ± 4.2 | ||
| V̇CO2 (mL/min) | ||||
| Control | 294 ± 65 | 345 ± 82 | 0.144 | NS |
| 200 ml DS | 291 ± 62 | 350 ± 57 | ||
| 400 ml DS | 284 ±83 | 340 ± 83 | ||
| Rf (b/min) | ||||
| Control | 15.6 ± 5.2 | 15.2 ± 2.9 | 0.857 | NS |
| 200 ml DS | 16.2 ± 5.5 | 17.2 ± 3.9 | ||
| 400 ml DS | 16.3 ± 5.3 | 17.0 ± 4.6 | ||
| VT (mL) | ||||
| Control | 852 ± 299 | 984 ± 273 | 0.503 | NS |
| 200 ml DS a | 1055 ± 256 | 1105 ± 227 | ||
| 400 ml DS a,b | 1236 ± 271 | 1326 ± 243 |
For abbreviations, see Table 2. DS, dead space. Values are means ± SD.
significantly different from control trial;
significantly different from 200ml trial.
Figure 5.
Resting ventilatory response without (i.e., control) and with added dead space (i.e., 200 mL and 400 mL).
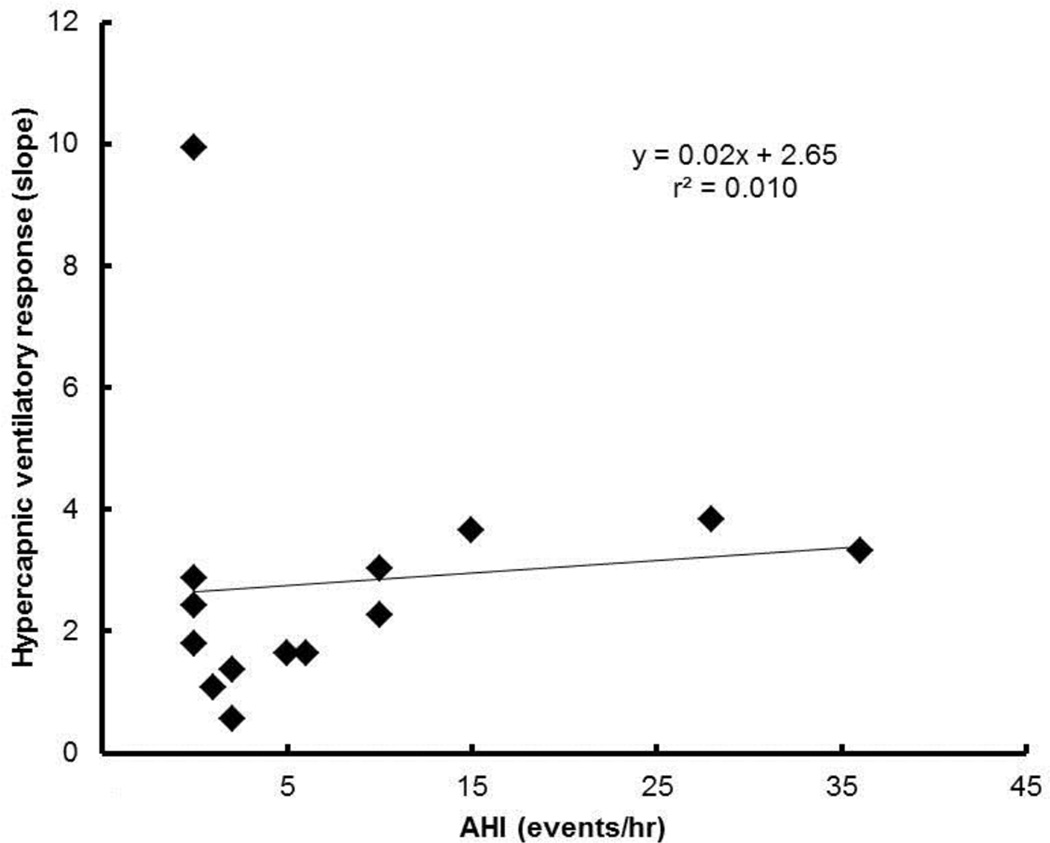
The hypercapnic ventilatory response was within normal limits (mean ± SD of individual slopes 2.8 ± 2.3 L/min/Torr) (Figure 6).
Figure 6.
Hypercapnic ventilatory response at rest for each subject.
Short-term modulation of the exercise ventilatory response
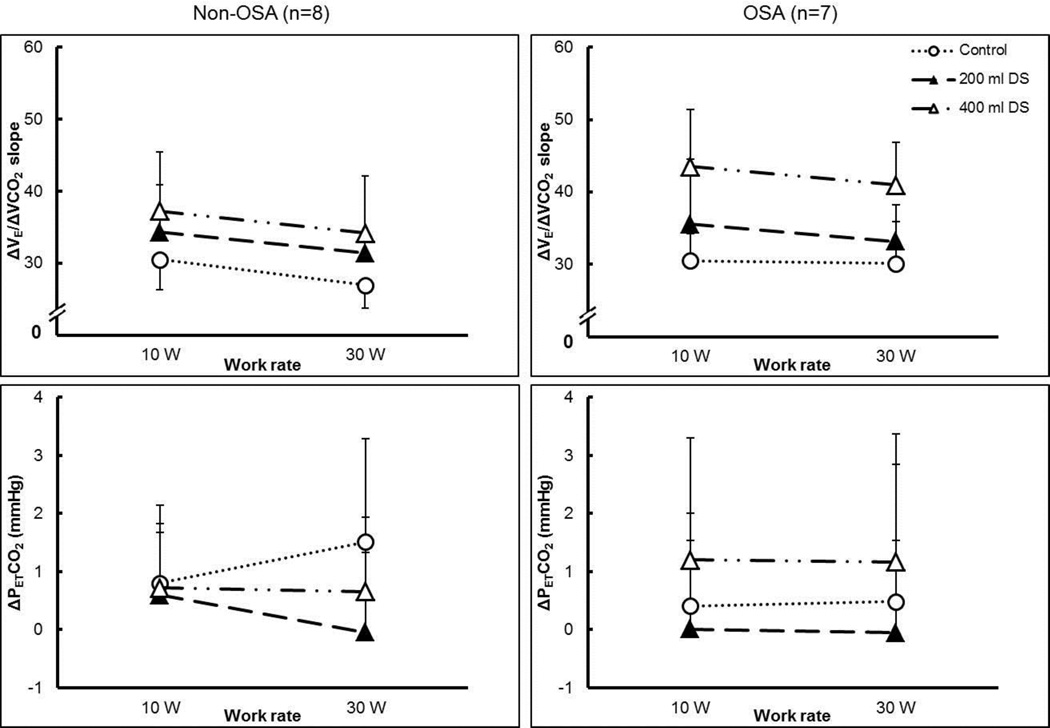
Table 4 shows the changes in ventilation, breathing pattern, and gas exchange variables in response to increasing exercise intensity and added dead space between the groups (three-way ANOVA). A main effect of dead space on the slope of the exercise ventilatory response (ΔV̇E/ΔV̇CO2) was observed (Figure 7), the slope increased with increasing dead space; but there was no main effect of group (p > 0.05). The slope tended to decrease with increasing exercise intensity (p = 0.051). ΔV̇E showed main effects of dead space and exercise intensity (p < 0.05), but no differences between groups; V̇E increased with increasing dead space and exercise intensity. The increased ΔV̇E in the OSA groups was due to both increased breathing frequency and tidal volume (ΔRf and ΔVT). There was a main effect of exercise intensity on ΔV̇CO2, CO2 production was higher at higher exercise intensity.
Table 4.
Ventilatory variables from STM protocol: values relative to rest.
| Non-OSA | OSA | |||||
|---|---|---|---|---|---|---|
| Control | 200 mL DS | 400 mL DS | Control | 200 mL DS | 400 mL DS | |
| ΔV̇E/ΔV̇CO2 slope(p<0.001)‖ | ||||||
| 10 W | 30.5 ± 4.2 | 34.3 ± 6.5 | 37.3 ± 8.2 | 30.5 ± 3.8 | 35.6 ± 9.0 | 43.5 ± 7.9 |
| 30W | 27.0 ± 3.3 | 31.5 ± 2.9 | 34.2 ± 8.0 | 30.1 ± 5.8 | 33.2 ± 5.1 | 41.0 ± 5.9 |
| ΔPETCO2 (mmHg) | ||||||
| 10 W | 0.8 ± 1.6 | 0.6 ± 1.1 | 0.7 ± 1.1 | 1.7 ± 4.6 | 0.0 ± 1.5 | 1.2 ± 2.1 |
| 30W | 1.5 ± 1.8 | 0.0 ± 1.4 | 0.7 ± 1.3 | 1.8 ± 5.7 | 0.0 ± 1.6 | 1.2 ± 2.2 |
| ΔV̇E (L/min)(p<0.001)|, (p=0.002)‖ | ||||||
| 10 W | 10.0 ± 3.9 | 9.4 ± 5.6 | 11.7 ± 5.5 | 12.6 ± 7.6 | 14.2 ± 9.0 | 17.0 ± 8.3 |
| 30W | 13.9 ± 4.7 | 11.8 ± 12.4 | 16.7 ± 7.4 | 17.2 ± 7.2 | 19.2 ± 12.2 | 26.0 ± 9.6 |
| ΔV̇CO2 (mL/min)(p<0.001)| | ||||||
| 10 W | 331 ± 131 | 328 ± 119 | 343 ± 118 | 400 ± 200 | 443 ± 177 | 400 ± 205 |
| 30W | 513 ± 150 | 450 ± 306 | 531 ± 170 | 560 ± 161 | 624 ± 238 | 643 ± 253 |
| ΔRf (breaths/min)(p=0.006)| | ||||||
| 10 W | 4.4 ± 2.8 | 4.1 ± 2.7 | 5.6 ± 4.0 | 6.7 ± 4.5 | 8.2 ± 5.5 | 8.3 ± 4.9 |
| 30W | 4.7 ± 3.2 | 5.9 ± 4.1 | 7.7 ± 6.8 | 10.4 ± 6.1 | 8.7 ± 4.4 | 11.6 ± 5.1 |
| ΔVT (L)(p=0.049)| | ||||||
| 10 W | 0.36 ± 0.14 | 0.36 ± 0.13 | 0.40 ± 0.18 | 0.27 ± 0.24 | 0.24 ± 0.17 | 0.24 ± 0.19 |
| 30W | 0.57 ± 0.22 | 0.29 ± 0.62 | 0.57 ± 0.27 | 0.29 ± 0.20 | 0.44 ± 0.19 | 0.37 ± 0.26 |
For abbreviations, see Table 2. Data were analyzed by 3-way ANOVA comparing effects of group (Non-OSA, OSA), exercise (10W, 30W) and dead space (control, 200 mL, 400 mL). Values are means ± SD.
Significant effect of group.
Significant effect of exercise.
Significant effect of dead space. (p-values shown)
Figure 7.
Interaction between the effects of exercise and dead space level on slope of the exercise ventilatory response (ΔV̇E/ΔV̇CO2), and change in PETCO2 (ΔPETCO2) from rest to each work rate for Non-OSA (left-hand panels) and OSA (right-hand panels) groups. DS, dead space. Dotted line with open circles, control (no added dead space); dashed line with filled triangles, 200 mL added dead space; dashed and dotted line with open triangles, 400 mL added dead space. Mean ± S.D.
No significant differences were found in ΔPETCO2. For both groups, ΔPETCO2 from rest to each exercise level with added dead space was lower or very close to that without added dead space (mean change <2 mmHg), indicating that CO2 was not retained.
Obesity Hypoventilation Syndrome
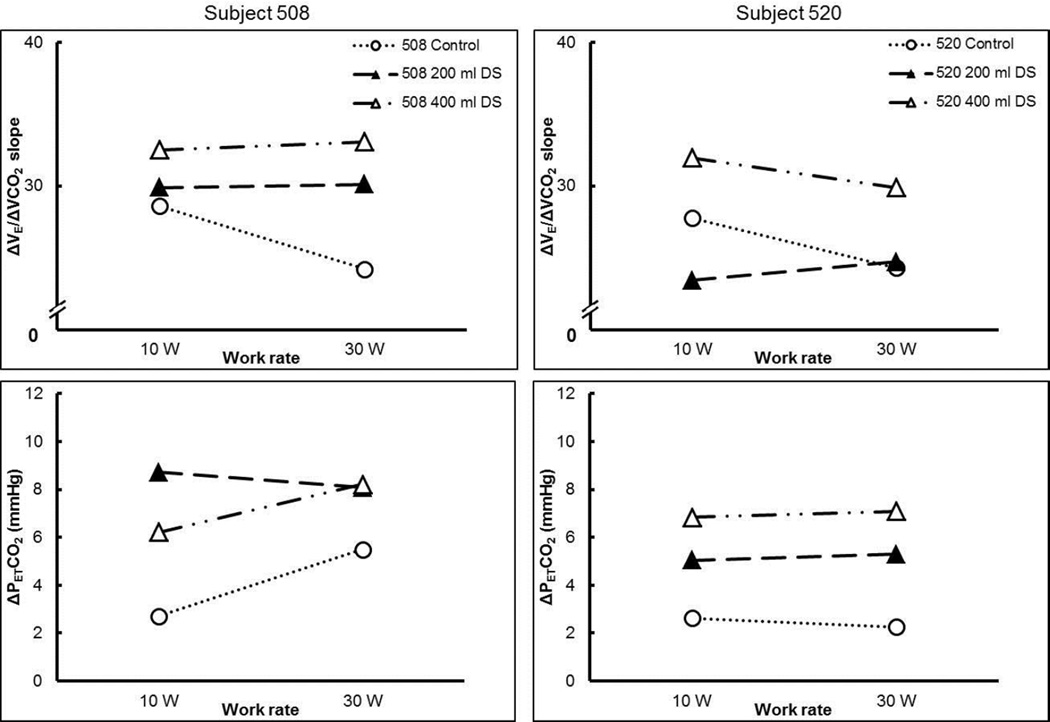
The two subjects with suspected OHS had two of the highest body mass indexes of the subjects in this study (Figure 2) and had lower than predicted lung function (Table 5). In line with the definition of OHS, they exhibited elevated resting PETCO2 values (44 and 46 mmHg, respectively). When challenged with increasing dead space and with increasing exercise intensity, ΔPETCO2 was increased (Figure 8) as PETCO2 increased up to 55 and 52 mmHg, respectively. The ΔV̇E/ΔV̇CO2 slope increased with increasing dead space (i.e., control to 400 ml DS) (Figure 8) but it cannot be determined whether this increase was due to STM or the retention of CO2. Nevertheless, ventilation was not adjusted to meet the demand of the increased dead space.
Table 5.
Subject characteristics for OHS subjects 508 and 520.
| Subject 508 | Subject 520 | |
|---|---|---|
| Sex | F | M |
| Age (yr) | 42 | 38 |
| Height (cm) | 149.7 | 185.9 |
| Weight (kg) | 106.3 | 175.2 |
| BMI (kg/m2) | 47.4 | 50.7 |
| AHI (events/hr) | 20 | 43 |
| Neck circumference (cm) | 37.6 | 49.5 |
| FVC (%pred) | 91 | 90 |
| FEV1 (%pred) | 85 | 83 |
| FEV1/FVC (%) | 78 | 75 |
| TLC (%pred) | 83 | 83 |
| FRC (%TLC) | 35 | 39 |
| IC (%pred) | 82 | 81 |
| ERV (L) | 0.2 | 0.5 |
| RV (%pred) | 78 | 90 |
| DLCO (%pred) | 68 | 69 |
| DLCO/VA (%pred) | 146 | 113 |
For abbreviations, see Table 1.
Figure 8.
Interaction between the effects of exercise and dead space level on slope of the exercise ventilatory response (ΔV̇E/ΔV̇CO2), and change in PETCO2 (ΔPETCO2) from rest to each work rate for subject 508 (left-hand panels) and 520 (right-hand panels). DS, dead space. Dotted line with open circles, control (no added dead space); dashed line with filled triangles, 200 mL added dead space; dashed and dotted line with open triangles, 400 mL added dead space.
DISCUSSION
The main findings of this study are: 1) the exercise ventilatory response is similar between obese OSA patients and obese adults without OSA, and 2) both groups had equal capacity for STM with added respiratory dead space, in contrast to our hypotheses. Additionally, two subjects with suspected OHS demonstrated a reduced ventilatory response to exercise and CO2 retention, which made determination of STM impossible; thus, careful evaluation of OSA patients who may also have OHS is clinically important.
This study demonstrates that STM of the exercise ventilatory response is preserved despite increased mechanical loads imposed by obesity or OSA. On the other hand, ventilatory responses to exercise or chemoreflex activation are diminished in OHS patients. These findings support the view that the respiratory control system exhibits considerable capacity for modulation and/or plasticity to increase neural respiratory muscle drive and ventilatory output in order to maintain a constant relative PCO2 in response to physiological (e.g. obesity, OSA) and imposed (e.g. external added dead space) conditions (Mitchell and Babb, 2006; Poon et al., 2007). However, the capacity seems to reach a limit in OHS, where the ventilatory output fails to compensate for the increasing PCO2 both at rest and during exercise. Although limited by the number of subjects, especially in the more severe OSA range, our results demonstrate that STM can be expressed in obesity and OSA. Interesting findings in a limited group of OHS subjects establish the need for more intensive research in this area.
Ventilatory response to exercise
The increase in ventilation during submaximal exercise occurs in direct proportion to the increased metabolic CO2 production, such that partial pressure of CO2 in the arterial blood is maintained constant (i.e., CO2 is not retained, but isocapnic). An increased slope of this V̇E/V̇CO2 relationship is associated with poorer mortality prognosis in chronic heart failure (Arena et al., 2007; Chua et al., 1997; Kleber et al., 2000; Ponikowski et al., 2001). In patients with OSA, Hargens et al (Hargens et al., 2009) found an increased ventilatory response. The results of the present study were different in that we did not observe an augmented ventilatory response in OSA patients (Figure 31 and Table 2). This discrepancy could be due to differences in patient selection (our subjects were older and more obese) or exercise assessments (our submaximal exercise levels were lower). Hargens et al suggested that chemoreflex sensitivity was altered; however, they did not report PCO2 to substantiate this assertion (Hargens et al., 2009). If PCO2 was maintained constant during exercise, chemoreflex is not a likely explanation. Lin et al (Lin et al., 2006) found no differences in the ventilatory response to maximal exercise, including V̇E/V̇CO2 and PETCO2 between OSA and healthy subjects, these results are in line with our observations.
Short-term modulation of the exercise ventilatory response
Exercise with added respiratory dead space adjusts the ventilatory response to exercise in order to maintain arterial PCO2 regulation with respect to its new, elevated resting level (Babb et al., 2010; Mitchell, 1990). STM is an experimental within-trial augmentation of the exercise ventilatory response; when the respiratory dead space is removed, the exercise ventilatory response reverts to normal. Thus, STM represents the ability of the respiratory control system to adjust breathing during exercise to accommodate other respiratory stimuli or imposed challenges (such as changes in dead space). First demonstrated in goats (Mitchell, 1990), STM is also present and robust in healthy, younger and older women and men (Wood et al., 2010, 2011; Wood et al., 2008b). Results of the current study extend those prior results to include healthy obese individuals as well as obese patients with OSA demonstrating functioning STM; PETCO2 is maintained within 2 mmHg. In the case of OSA patients, a notable difference is an increased V̇CO2 as well as increased V̇E, which results in an unchanged V̇E/V̇CO2 relationship.
Obesity Hypoventilation Syndrome
The two suspected OHS subjects were classified as obesity class III and exhibited decreased lung function, which is in agreement with previous studies (Basoglu and Tasbakan, 2014; Javaheri and Simbartl, 2014; Kessler et al., 2001). The ΔV̇E/ΔV̇CO2 slope was increased with added dead space; however, ventilation was not increased enough to maintain a constant PETCO2 (Figure 8). Thus, it is not clear whether the increased ΔV̇E/ΔV̇CO2 slope is due to chemoreceptor feedback or the feedforward short-term modulation but neither increased ventilation enough to prevent CO2 retention (Figure 1). The finding that PETCO2 was not maintained suggests that the respiratory control has reached its limit for increasing ventilatory output in response to hypercapnia. Eucapnic obesity is characterized by chronic systemic low grade inflammation and associated inflammatory changes in adipose tissue (Hotamisligil, 2006; Schenk et al., 2008), and OHS is associated with increased inflammatory and decreased antiinflammatory cytokines when compared with eucapnic obese patients (Borel et al., 2009). Thus, it is possible that the limitation of the respiratory controller to respond appropriately to hypercapnia may be due to chronic inflammation associated with obesity that undermines the serotonin-dependent STM and/or that OHS developed because of a deficiency in serotonergic function in the first place.
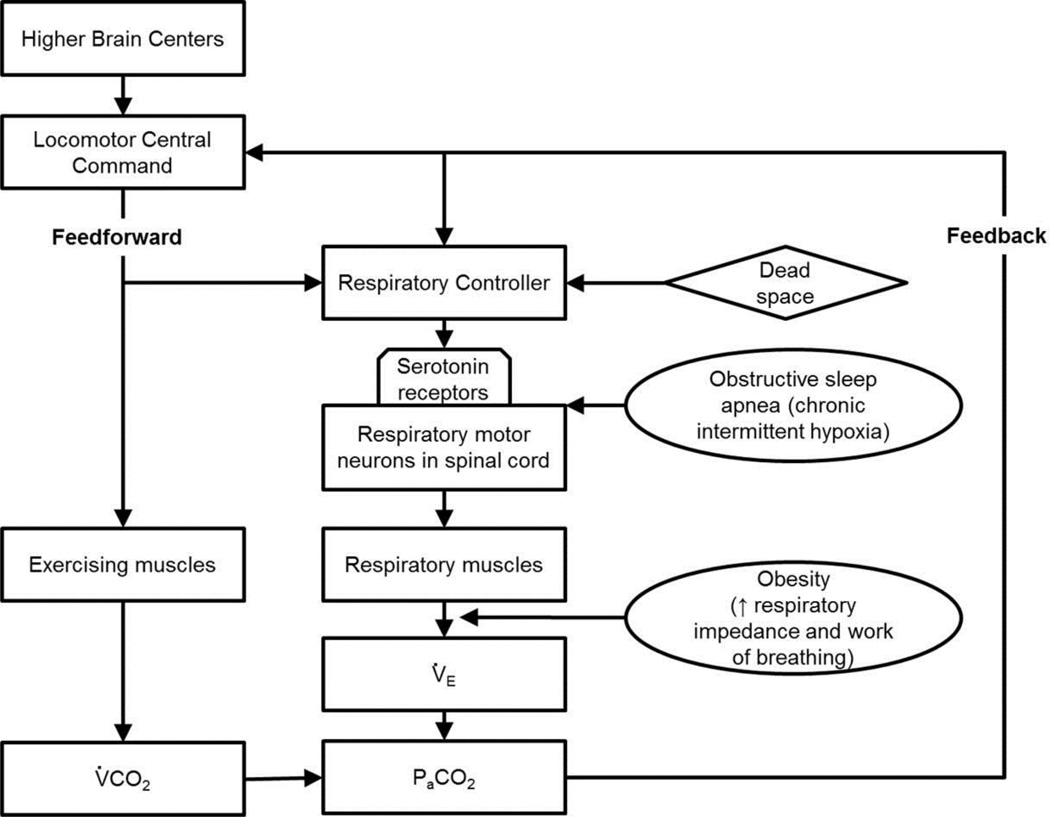
Figure 1.
Model of the interactions between the feedforward and feedback mechanisms when challenged with added ventilatory dead space, obesity, and obstructive sleep apnea.
Resting hypercapnic ventilatory response
Respiratory dead space increases resting ventilatory drive due to hypercapnia and CO2-chemoreceptor feedback caused by the dead space and reduced alveolar ventilation (for a given tidal volume) (Mitchell, 1990). The slope of the hypercapnic ventilatory response ranges from approximately 0.3 to 3.0 L/min/Torr in Bascom et al (Bascom et al., 1990) and similar values in Clement et al’s study (Clement et al., 1992), with the exception of one subject who failed to increase ventilation (the authors did not provide an explanation for the negative slope observed in this subject). The present findings are in agreement since most subjects showed a positive correlation between increased PETCO2 and increased V̇E (average slope 2.8 ± 2.3 L/min/Torr). Two subjects in the present study stood out as ventilation did not increase with increased PETCO2. Subject 528 presented with severe OSA (AHI=73 events/hr) and subject 508 with suspected OHS (due to elevated resting PETCO2 of 44 Torr). Based on this limited data, we cautiously suggest that a negative hypercapnic ventilatory response represents the inability of the respiratory system to detect and/or sufficiently correct for the increased CO2 and this may be due to advanced stages of OSA/OHS.
Limitations
Subject recruitment for this study was challenging due to the limited number of subjects meeting the inclusion criteria. For example, many patients also exhibited uncontrolled hypertension or other comorbidities of sleep apnea. Some were on selective serotonin re-uptake inhibitor medication for diagnosed depression, which we excluded due to complicating responses of the serotonin-dependent STM. The limited sample size, especially of OHS patients, may reduce the generalization of the results. Additionally, there was a wide range of OSA severity (i.e., number of AHI events) and a generally larger variability in the OSA patients compared with non-OSA. This high variability in the individual responses contributed to the lower statistical power. It is possible that with a more narrow range of OSA severity and with a greater number of subjects a statistically difference between groups could have been detected. Also, it is unknown for how long the patients had experienced OSA or OHS symptoms, or if the duration of symptoms can alter STM.
Conclusions
Here we establish that STM of the ventilatory response to exercise is preserved despite obesity and/or OSA, although it may be reduced in patients with obesity hypoventilation syndrome. This is an important development in our understanding of plasticity in the respiratory control system during exercise. STM represents the capacity to preserve homeostatic PCO2 regulation despite (patho-)physiological and environmental challenges. The limited findings from the OHS patients open up exiting avenues for future research.
Highlights.
The ventilatory response to exercise is of fundamental importance to every-day activity.
Short-term modulation alters the exercise ventilatory response to maintain PaCO2.
Obesity and/or obstructive sleep apnea could affect this neural mechanism.
The findings suggest that STM seems to be preserved in obesity and OSA.
However, it may be diminished in obesity hypoventilation syndrome patients.
Acknowledgments
The authors thank J. Todd Bassett, Raksa B. Moran, and Rubria Marines-Price for assistance with data collection and analysis, as well as Christina Dulock for helping with recruiting patients at UT Southwestern Clinical Center for Sleep and Breathing Disorders. This work was funded by King Charitable Foundation Trust, Texas Health Presbyterian Hospital, and NIH Grant R01 HL096782.
Footnotes
This is a PDF file of an unedited manuscript that has been accepted for publication. As a service to our customers we are providing this early version of the manuscript. The manuscript will undergo copyediting, typesetting, and review of the resulting proof before it is published in its final citable form. Please note that during the production process errors may be discovered which could affect the content, and all legal disclaimers that apply to the journal pertain.
REFERENCES
- Standardization of Spirometry, 1994 Update. American Thoracic Society. Am J Respir Crit Care Med. 1995;152:1107–1136. doi: 10.1164/ajrccm.152.3.7663792. [DOI] [PubMed] [Google Scholar]
- Arena R, Myers J, Hsu L, Peberdy MA, Pinkstaff S, Bensimhon D, Chase P, Vicenzi M, Guazzi M. The minute ventilation/carbon dioxide production slope is prognostically superior to the oxygen uptake efficiency slope. J Card Fail. 2007;13:462–469. doi: 10.1016/j.cardfail.2007.03.004. [DOI] [PubMed] [Google Scholar]
- Babb TG, Wood HE, Mitchell GS. Short- and long-term modulation of the exercise ventilatory response. Med Sci Sports Exerc. 2010;42:1681–1687. doi: 10.1249/MSS.0b013e3181d7b212. [DOI] [PMC free article] [PubMed] [Google Scholar]
- Babb TG, Wyrick BL, DeLorey DS, Chase PJ, Feng MY. Fat distribution and end-expiratory lung volume in lean and obese men and women. Chest. 2008;134:704–711. doi: 10.1378/chest.07-1728. [DOI] [PubMed] [Google Scholar]
- Bach KB, Lutcavage ME, Mitchell GS. Serotonin is necessary for short-term modulation of the exercise ventilatory response. Respir Physiol. 1993;91:57–70. doi: 10.1016/0034-5687(93)90089-s. [DOI] [PubMed] [Google Scholar]
- Bascom DA, Clement ID, Cunningham DA, Painter R, Robbins PA. Changes in peripheral chemoreflex sensitivity during sustained, isocapnic hypoxia. Respir Physiol. 1990;82:161–176. doi: 10.1016/0034-5687(90)90032-t. [DOI] [PubMed] [Google Scholar]
- Basoglu OK, Tasbakan MS. Comparison of clinical characteristics in patients with obesity hypoventilation syndrome and obese obstructive sleep apnea syndrome: a case-control study. Clin Respir J. 2014;8:167–174. doi: 10.1111/crj.12054. [DOI] [PubMed] [Google Scholar]
- Bernhardt V, Babb TG. Weight loss reduces dyspnea on exertion in obese women. Respir Physiol Neurobiol. 2014;204:86–92. doi: 10.1016/j.resp.2014.09.004. [DOI] [PMC free article] [PubMed] [Google Scholar]
- Bhammar DM, Stickford JL, Bernhardt V, Babb TG. Effect of weight loss on operational lung volumes and oxygen cost of breathing in obese women. Int J Obes (Lond) 2016;40:998–1004. doi: 10.1038/ijo.2016.21. [DOI] [PMC free article] [PubMed] [Google Scholar]
- Borel JC, Roux-Lombard P, Tamisier R, Arnaud C, Monneret D, Arnol N, Baguet JP, Levy P, Pepin JL. Endothelial dysfunction and specific inflammation in obesity hypoventilation syndrome. PloS one. 2009;4:e6733. doi: 10.1371/journal.pone.0006733. [DOI] [PMC free article] [PubMed] [Google Scholar]
- Carter R, Watenpaugh DE., 3rd Obesity and obstructive sleep apnea: Or is it OSA and obesity? Pathophysiology. 2008;15:71–77. doi: 10.1016/j.pathophys.2008.04.009. [DOI] [PubMed] [Google Scholar]
- Chua TP, Ponikowski P, Harrington D, Anker SD, Webb-Peploe K, Clark AL, Poole-Wilson PA, Coats AJ. Clinical correlates and prognostic significance of the ventilatory response to exercise in chronic heart failure. J Am Coll Cardiol. 1997;29:1585–1590. doi: 10.1016/s0735-1097(97)00078-8. [DOI] [PubMed] [Google Scholar]
- Clement ID, Bascom DA, Conway J, Dorrington KL, O'Connor DF, Painter R, Paterson DJ, Robbins PA. An assessment of central-peripheral ventilatory chemoreflex interaction in humans. Respir Physiol. 1992;88:87–100. doi: 10.1016/0034-5687(92)90031-q. [DOI] [PubMed] [Google Scholar]
- Epstein LJ, Kristo D, Strollo PJ, Jr, Friedman N, Malhotra A, Patil SP, Ramar K, Rogers R, Schwab RJ, Weaver EM, Weinstein MD Adult Obstructive Sleep Apnea Task Force of the American Academy of Sleep, M. Clinical guideline for the evaluation, management and long-term care of obstructive sleep apnea in adults. J Clin Sleep Med. 2009;5:263–276. [PMC free article] [PubMed] [Google Scholar]
- Frey WC, Pilcher J. Obstructive sleep-related breathing disorders in patients evaluated for bariatric surgery. Obes Surg. 2003;13:676–683. doi: 10.1381/096089203322509228. [DOI] [PubMed] [Google Scholar]
- Gerst DG, 3rd, Yokhana SS, Carney LM, Lee DS, Badr MS, Qureshi T, Anthouard MN, Mateika JH. The hypoxic ventilatory response and ventilatory long-term facilitation are altered by time of day and repeated daily exposure to intermittent hypoxia. J Appl Physiol. 2011;110:15–28. doi: 10.1152/japplphysiol.00524.2010. (1985) [DOI] [PMC free article] [PubMed] [Google Scholar]
- Gibson GJ. Obesity, respiratory function and breathlessness. Thorax 55 Suppl. 2000;1:S41–S44. doi: 10.1136/thorax.55.suppl_1.s41. [DOI] [PMC free article] [PubMed] [Google Scholar]
- Hargens TA, Guill SG, Aron A, Zedalis D, Gregg JM, Nickols-Richardson SM, Herbert WG. Altered ventilatory responses to exercise testing in young adult men with obstructive sleep apnea. Respir Med. 2009;103:1063–1069. doi: 10.1016/j.rmed.2009.01.010. [DOI] [PubMed] [Google Scholar]
- Henderson DR, Mitchell GS. Short-term modulation of the exercise ventilatory response in goats: effects of 8-OH-DPAT and MPPI. Am J Physiol Regul Integr Comp Physiol. 2000;279:R1880–R1888. doi: 10.1152/ajpregu.2000.279.5.R1880. [DOI] [PubMed] [Google Scholar]
- Hotamisligil GS. Inflammation and metabolic disorders. Nature. 2006;444:860–867. doi: 10.1038/nature05485. [DOI] [PubMed] [Google Scholar]
- Javaheri S, Simbartl LA. Respiratory determinants of diurnal hypercapnia in obesity hypoventilation syndrome. What does weight have to do with it? Ann Am Thorac Soc. 2014;11:945–950. doi: 10.1513/AnnalsATS.201403-099OC. [DOI] [PubMed] [Google Scholar]
- Kessler R, Chaouat A, Schinkewitch P, Faller M, Casel S, Krieger J, Weitzenblum E. The obesity-hypoventilation syndrome revisited: a prospective study of 34 consecutive cases. Chest. 2001;120:369–376. doi: 10.1378/chest.120.2.369. [DOI] [PubMed] [Google Scholar]
- Kleber FX, Vietzke G, Wernecke KD, Bauer U, Opitz C, Wensel R, Sperfeld A, Glaser S. Impairment of ventilatory efficiency in heart failure: prognostic impact. Circulation. 2000;101:2803–2809. doi: 10.1161/01.cir.101.24.2803. [DOI] [PubMed] [Google Scholar]
- Kress JP, Pohlman AS, Alverdy J, Hall JB. The impact of morbid obesity on oxygen cost of breathing (VO(2RESP)) at rest. Am J Respir Crit Care Med. 1999;160:883–886. doi: 10.1164/ajrccm.160.3.9902058. [DOI] [PubMed] [Google Scholar]
- Lee DS, Badr MS, Mateika JH. Progressive augmentation and ventilatory long-term facilitation are enhanced in sleep apnoea patients and are mitigated by antioxidant administration. J Physiol. 2009;587:5451–5467. doi: 10.1113/jphysiol.2009.178053. [DOI] [PMC free article] [PubMed] [Google Scholar]
- Lin CC, Hsieh WY, Chou CS, Liaw SF. Cardiopulmonary exercise testing in obstructive sleep apnea syndrome. Respir Physiol Neurobiol. 2006;150:27–34. doi: 10.1016/j.resp.2005.01.008. [DOI] [PubMed] [Google Scholar]
- Ling L, Fuller DD, Bach KB, Kinkead R, Olson EB, Jr, Mitchell GS. Chronic intermittent hypoxia elicits serotonin-dependent plasticity in the central neural control of breathing. J Neurosci. 2001;21:5381–5388. doi: 10.1523/JNEUROSCI.21-14-05381.2001. [DOI] [PMC free article] [PubMed] [Google Scholar]
- Lopez PP, Stefan B, Schulman CI, Byers PM. Prevalence of sleep apnea in morbidly obese patients who presented for weight loss surgery evaluation: more evidence for routine screening for obstructive sleep apnea before weight loss surgery. Am Surg. 2008;74:834–838. [PubMed] [Google Scholar]
- Mitchell GS. Ventilatory control during exercise with increased respiratory dead space in goats. J Appl Physiol. 1990;69:718–727. doi: 10.1152/jappl.1990.69.2.718. [DOI] [PubMed] [Google Scholar]
- Mitchell GS, Babb TG. Layers of exercise hyperpnea: modulation and plasticity. Respir Physiol Neurobiol. 2006;151:251–266. doi: 10.1016/j.resp.2006.02.003. [DOI] [PubMed] [Google Scholar]
- Mitchell GS, Baker TL, Nanda SA, Fuller DD, Zabka AG, Hodgeman BA, Bavis RW, Mack KJ, Olson EB., Jr Invited review: Intermittent hypoxia and respiratory plasticity. J Appl Physiol. 2001;90:2466–2475. doi: 10.1152/jappl.2001.90.6.2466. [DOI] [PubMed] [Google Scholar]
- Mitchell GS, Johnson SM. Neuroplasticity in respiratory motor control. J Appl Physiol. 2003;94:358–374. doi: 10.1152/japplphysiol.00523.2002. (1985) [DOI] [PubMed] [Google Scholar]
- Mitchell GS, Turner DL, Henderson DR, Foley KT. Spinal serotonin receptor activation modulates the exercise ventilatory response with increased dead space in goats. Respir Physiol Neurobiol. 2008;161:230–238. doi: 10.1016/j.resp.2008.02.007. [DOI] [PMC free article] [PubMed] [Google Scholar]
- Mokhlesi B. Obesity hypoventilation syndrome: a state-of-the-art review. Respir Care. 2010;55:1347–1362. discussion 1363-1345. [PubMed] [Google Scholar]
- O'Keeffe T, Patterson EJ. Evidence supporting routine polysomnography before bariatric surgery. Obes Surg. 2004;14:23–26. doi: 10.1381/096089204772787248. [DOI] [PubMed] [Google Scholar]
- Pellegrino R, Viegi G, Brusasco V, Crapo RO, Burgos F, Casaburi R, Coates A, van der Grinten CP, Gustafsson P, Hankinson J, Jensen R, Johnson DC, MacIntyre N, McKay R, Miller MR, Navajas D, Pedersen OF, Wanger J. Interpretative strategies for lung function tests. Eur Respir J. 2005;26:948–968. doi: 10.1183/09031936.05.00035205. [DOI] [PubMed] [Google Scholar]
- Ponikowski P, Francis DP, Piepoli MF, Davies LC, Chua TP, Davos CH, Florea V, Banasiak W, Poole-Wilson PA, Coats AJ, Anker SD. Enhanced ventilatory response to exercise in patients with chronic heart failure and preserved exercise tolerance: marker of abnormal cardiorespiratory reflex control and predictor of poor prognosis. Circulation. 2001;103:967–972. doi: 10.1161/01.cir.103.7.967. [DOI] [PubMed] [Google Scholar]
- Poon CS, Tin C, Yu Y. Homeostasis of exercise hyperpnea and optimal sensorimotor integration: the internal model paradigm. Respir Physiol Neurobiol. 2007;159:1–13. doi: 10.1016/j.resp.2007.02.020. discussion 14–20. [DOI] [PMC free article] [PubMed] [Google Scholar]
- Schenk S, Saberi M, Olefsky JM. Insulin sensitivity: modulation by nutrients and inflammation. J Clin Invest. 2008;118:2992–3002. doi: 10.1172/JCI34260. [DOI] [PMC free article] [PubMed] [Google Scholar]
- Shah N, Roux F. The relationship of obesity and obstructive sleep apnea. Clin Chest Med. 2009;30:455–465. vii. doi: 10.1016/j.ccm.2009.05.012. [DOI] [PubMed] [Google Scholar]
- Wasserman K, Whipp BJ. Excercise physiology in health and disease. Am Rev Respir Dis. 1975;112:219–249. doi: 10.1164/arrd.1975.112.2.219. [DOI] [PubMed] [Google Scholar]
- Wood HE, Mitchell GS, Babb TG. Short-term modulation of the exercise ventilatory response in young men. J Appl Physiol. 2008a;104:244–252. doi: 10.1152/japplphysiol.00820.2007. [DOI] [PubMed] [Google Scholar]
- Wood HE, Mitchell GS, Babb TG. Short-term modulation of the exercise ventilatory response in older men. Respir Physiol Neurobiol. 2010;173:37–46. doi: 10.1016/j.resp.2010.06.003. [DOI] [PubMed] [Google Scholar]
- Wood HE, Mitchell GS, Babb TG. Short-term modulation of the exercise ventilatory response in younger and older women. Respir Physiol Neurobiol. 2011 doi: 10.1016/j.resp.2011.08.011. [DOI] [PubMed] [Google Scholar]
- Wood HE, Semon TL, Comeau LA, Schwartz B, MacDougall RM, Klocko MN, Babb TG. The ventilatory response to exercise does not differ between obese women with and without dyspnea on exertion. Adv Exp Med Biol. 2008b;605:514–518. doi: 10.1007/978-0-387-73693-8_90. [DOI] [PubMed] [Google Scholar]
- Young T, Palta M, Dempsey J, Skatrud J, Weber S, Badr S. The occurrence of sleep-disordered breathing among middle-aged adults. N Engl J Med. 1993;328:1230–1235. doi: 10.1056/NEJM199304293281704. [DOI] [PubMed] [Google Scholar]


