

Abstract
Alzheimer's disease (AD) researchers commonly use MRI as a quantitative measure of disease severity. Historically, hippocampal volume has been favored. Recently, “AD signature” measurements of gray matter (GM) volumes or cortical thicknesses have gained attention. Here, we systematically evaluate multiple thickness- and volume-based candidate-methods side-by-side, built using the popular FreeSurfer, SPM, and ANTs packages, according to the following criteria: (a) ability to separate clinically normal individuals from those with AD; (b) (extent of) correlation with head size, a nuisance covariatel (c) reliability on repeated scans; and (d) correlation with Braak neurofibrillary tangle stage in a group with autopsy. We show that volume- and thickness-based measures generally perform similarly for separating clinically normal from AD populations, and in correlation with Braak neurofibrillary tangle stage at autopsy. Volume-based measures are generally more reliable than thickness measures. As expected, volume measures are highly correlated with head size, while thickness measures are generally not. Because approaches to statistically correcting volumes for head size vary and may be inadequate to deal with this underlying confound, and because our goal is to determine a measure which can be used to examine age and sex effects in a cohort across a large age range, we thus recommend thickness-based measures. Ultimately, based on these criteria and additional practical considerations of run-time and failure rates, we recommend an AD signature measure formed from a composite of thickness measurements in the entorhinal, fusiform, parahippocampal, mid-temporal, inferior-temporal, and angular gyrus ROIs using ANTs with input segmentations from SPM12.
Highlights
-
•
Evaluate thickness- and volume-based quantitative measures of AD severity
-
•
Volume- and thickness-based measures perform similarly for separating by diagnosis.
-
•
Volume-based measures are correlated with head size; thickness-based mostly aren't.
-
•
We recommend an AD signature measure formed from cortical thickness measures.
-
•
We recommend thicknesses using ANTs software with input segmentations from SPM12.
1. Introduction
Accurate, reliable quantitative measures of disease severity from magnetic resonance imaging (MRI) have been a mainstay of research in the imaging of Alzheimer's disease (AD) for many years. Based on arguably the most dominant feature of visual examination, hippocampal volume quickly emerged as the prevailing standard MRI biomarker for quantifying AD severity from MRI (Jack et al., 1992, Kesslak et al., 1991, Scheltens et al., 1992, Seab et al., 1988). Of the two major proteinopathies characteristic of AD, ß-amyloid and tau, spatiotemporal patterns of neurodegeneration and atrophy, as well as temporal progression of clinical symptoms, correspond with the spatiotemporal pattern of tau deposition much more than with that of ß-amyloid (Jack et al., 2008, Whitwell et al., 2008). Because pathological studies suggest that the regions first affected by tau in the typical disease progression are specifically those in layers II and IV of the entorhinal cortex followed by the subiculum/CA1 of the hippocampus (Braak and Braak, 1991, Gómez-Isla et al., 1996, Hyman et al., 1984), volume of the entorhinal cortex was also soon proposed as an AD imaging biomarker, and the relative merits of hippocampal volume versus entorhinal cortex volume have been debated (Bobinski et al., 1999, de Leon et al., 2001, Dickerson et al., 2001, Du et al., 2003, Juottonen et al., 1999, Kesslak et al., 1991, Killiany et al., 2002, Tapiola et al., 2008, Xu et al., 2000). Some studies have found superior or comparable separation or predictive power of the entorhinal cortex (Bobinski et al., 1999, Dickerson et al., 2001, Du et al., 2003, Killiany et al., 2002, Tapiola et al., 2008), while others have favored hippocampal volumes with the explanation that greater reliability of measuring hippocampal volumes compensates for its slightly later stage of being affected by the disease (Juottonen et al., 1999, Kesslak et al., 1991, Xu et al., 2000). Methods using machine learning classifiers were later proposed to analyze volume-based features of voxels/regions across the whole brain in search of a measure based on a “signature” region of interest (ROI) (i.e. a set of voxels, or a set of ROIs combined into a meta-ROI) to measure Alzheimer's disease (Fan et al., 2008, Ortiz et al., 2014, Vemuri et al., 2011, Vemuri et al., 2008, Xia et al., 2013).
When methods designed to measure in-vivo cortical thickness from MRI were introduced (Das et al., 2007, Fischl and Dale, 2000, MacDonald et al., 2000), regional thickness values, particularly in the entorhinal cortex, were quickly proposed as measures of AD severity (Bakkour et al., 2009, Dickerson et al., 2009, Fischl et al., 2009, Lerch et al., 2005). Thickness of the (whole) hippocampus is generally not considered as an option (FreeSurfer FAQ, 2015): the structure of the hippocampal cortex folds upon itself and appears bulbous, rather than thin and ribbon-like as in the rest of the cortex. Some software methods have been designed to segment hippocampal subfields, but these do not produce thickness measures (Iglesias et al., 2015, van Leemput et al., 2008). The use of cortical thickness measurements combined from multiple regions into an “AD Signature” meta-ROI has also been proposed (Dickerson and Wolk, 2012, Dickerson et al., 2009). Others have proposed longitudinal AD signature methods based on tensor-based morphometry features (Hua et al., 2009), but longitudinal measures will not be the focus of this manuscript.
Since the introduction of hippocampal volumes, these and other volume measurements have been normalized by or corrected for inter-subject variation in brain size or head size (Jack et al., 1992, Jack et al., 1989, Kesslak et al., 1991, Scheltens et al., 1992, Seab et al., 1988). Most commonly, head size is defined and measured as total intracranial volume (TIV), and volume measurements are applied as a ratio after dividing by TIV (Bobinski et al., 1999, Jack et al., 1992, Juottonen et al., 1999), as a residual after adjusting for TIV in a regression model (Jack et al., 2014, Voevodskaya et al., 2014), or simply as a covariate in a regression model. However, there has been no universal agreement on how to adjust volume measures for TIV, and differing methods have been shown to produce differing analyses (Hansen et al., 2015, Nordenskjöld et al., 2013, Voevodskaya et al., 2014).
Although cortical thickness and surface area seem to be biologically distinct quantities (Panizzon et al., 2009), GM volume measurements are a combination of both that is dominated by surface area much more than thickness (Winkler et al., 2010). Because surface area is highly correlated with TIV (Barnes et al., 2010), it follows that volume (which is highly correlated with surface area) is also highly correlated with TIV, while thickness (which is much less correlated with surface area) is not. This has led to previous recommendations to adjust for head size when using volume, but not thickness, measurements (Barnes et al., 2010, Westman et al., 2013). Despite these methodological differences, hippocampal volume and entorhinal cortical thickness offer similar diagnostic separability performance, and thus the degree of nuisance correlation with TIV becomes an important practical difference.
Our goal in this study is to produce a measure suitable for epidemiological assessment of disease burden over the entire age range, which includes examining the effects of sex. To assess their suitability for this purpose, we perform large-scale comparisons of several distinct techniques (volume measurements based on SPM12 and on FreeSurfer, and cortical thickness measurements based on ANTs and FreeSurfer) for creating volume- and thickness-based meta-ROI “signature” measures of AD according to a variety of desirable properties. Our evaluation criteria are the following: (a) separation of clinically normal (CN) older adults from AD patients according to clinical diagnosis; (b) (extent of) correlation with TIV in CN older adults; (c) reliability in a single-site short-time repeat-scan study of CN subjects of varying ages and in a larger, multi-site 3-month repeat-scan study of older CN subjects; and (d) correlation of these in-vivo measurements with Braak neurofibrillary tangle stage at autopsy.
2. Methods
First, we describe each of the four datasets used in this work. Additional characteristics of the subjects included in each are provided in Supplementary Table S1. All studies were approved by their respective institutional review boards and all subjects or their surrogates provided informed consent compliant with HIPAA regulations. Next, we describe all employed software pipelines. MRI scanning parameters are described later, in Section 3.
2.1. Subject characteristics
2.1.1. Mayo clinical diagnostic separability dataset
This dataset includes scans of 216 subjects from the Mayo Clinic Study of Aging (MCSA) and the Mayo Clinic Alzheimer's Disease Research Center (ADRC) studies. MCSA is an epidemiological study of cognitive aging in Rochester, Olmsted County, Minnesota (Petersen et al., 2010, Roberts et al., 2008). The ADRC study recruits and follows subjects initially seen as patients at the Mayo Clinic Behavioral Neurology practice. 108 subjects were clinically diagnosed with either AD dementia or mild cognitive impairment (MCI) according to established criteria, and 108 clinically normal control subjects were matched one-to-one to the MCI/AD subjects according to age, sex, and TIV. The MCI/AD subjects were documented to be amyloid positive and the CN subjects amyloid negative, to create an impaired group within the AD pathway and a non-impaired group not in the AD pathway (Jack et al., 2014). Amyloid positivity was determined from late uptake PET scans of each subject with Pittsburgh compound B (Klunk et al., 2004). PET image analysis was performed using a previously-described in-house automated pipeline (Senjem et al., 2005) using structural MRI to perform two-class partial volume correction and provide ROI placement (Jack et al., 2008). An amyloid-PET standardized uptake value ratio (SUVR) was calculated as the median uptake over voxels in the prefrontal, orbitofrontal, parietal, temporal, anterior cingulate, and posterior cingulate/precuneus regions divided by the median uptake from the cerebellar GM (Jack et al., 2013). A previously determined cut point of SUVR 1.4 was used to denote amyloid positive/negative (Jack et al., 2014).The clinical diagnosis criteria for normal subjects were: no cognitive complaints, normal neurological exam, no active psychiatric or neurological conditions, no psychoactive medications, and prior resolution of any previous neurological or psychiatric conditions. Subject ages were between 60 and 91 years, median 77. Two subjects, one with a diagnosis of MCI and one with AD, failed FreeSurfer processing (defined as either program failure to produce an output, or a produced output with a portion of cortical ribbon placed incorrectly) and were excluded from all FreeSurfer-based volume and thickness analyses.
2.1.2. Mayo Clinic reliability dataset
This dataset includes scans of 21 clinically normal control subjects from the Mayo Clinic MCSA/ADRC studies, pooled from two groups. It includes eight subjects, ages 30–47, with pairs of baseline and follow-up scans on the same scanner within a range of 5.9–8.2 months, and thirteen subjects, ages 75–90, with pairs of baseline and follow-up scans on the same scanner within two weeks.
2.1.3. ADNI reliability dataset
We identified a total of 133 ADNI subjects with pairs of serial T1-weighted MRI scans on the same scanner within a median of 3.0 months (range 1.8–3.9 months) with a clinical diagnosis of CN that remained for at least 12 months after the baseline scans. Subject ages were 59–88, median 72. The data used in this dataset were obtained from the Alzheimer's Disease Neuroimaging Initiative (ADNI) database (adni.loni.usc.edu). For up-to-date information, see the ADNI homepage (ADNI Home, 2013).
2.1.4. Mayo Clinic pathology (Braak-stage) correlation dataset
This dataset includes scans of 82 subjects, ages at death ranged from 51 to 101, median 84, from Mayo Clinic MCSA/ADRC studies with Braak neurofibrillary tangle stage (Braak and Braak, 1991) determined at autopsy and a usable in-vivo structural MRI scan within five years before death (range 0.2 to 4.5, median: 2.3 years). These subjects were determined to be part of the AD spectrum based on their pathology; subjects with high likelihood of other dementia (i.e. DLB, FTD, vascular, etc.) were not included. One subject failed FreeSurfer processing and was excluded from all FreeSurfer-based volume and thickness analyses.
2.2. Common preprocessing
Mayo-study data were acquired with gradient distortion correction in the sagittal plane performed on the scanner. Through plane correction was performed as part of image processing (Jovicich et al., 2006). For ADNI data, distortion correction was applied on the scanner as available, with offline correction as necessary using the same method as above, to create datasets also with full 3D correction. After this step, the images entered each of the five software pipelines (two for gray matter volume, and three for cortical thickness) described below.
2.3. Volume and thickness methods
2.3.1. SPM12 GM volume methods
SPM12 gray matter volumes were calculated from each preprocessed T1-weighted image using the “Segment” (formerly “New Segment” in SPM8) implementation of the Unified Segmentation algorithm (Ashburner and Friston, 2005) included in the original release version of SPM12 (revision 6225). Inhomogeneity (B0 bias-field) correction was performed as part of this process. In order to produce more accurate segmentations for older-adult populations, we altered several parameters in SPM12 from their defaults. Firstly, we used an in-house customized population-specific template, tissue priors, and atlas labels (see Section 2.5). Secondly, we used two Gaussians to model white matter (WM) intensities, rather than the default of one, to account for the increased variance in WM intensities due to higher prevalence of WM disease in these populations. We also reduced each of the stiffness penalty parameters of the nonlinear normalization of the segmentation priors to half of their defaults, allowing for increased inter-subject variability due to increased prevalence and severity of atrophy and other pathologies. Formal validation of these parameter alterations is beyond the scope of this manuscript, but will be presented separately in a future publication. Output tissue segmentations from this method were used directly to produce the regional values in the SPM GM volume pipeline. The bias-corrected T1 and segmentation outputs produced by this process were also used as inputs to some of the following pipelines, where specified.
2.3.2. FreeSurfer GM volume methods
FreeSurfer GM volumes were produced using the recon-all script, in cross-sectional mode, of FreeSurfer version 5.3 (Fischl, 2012) on each T1-weighted scan. We used the recon-all flag -3T, which alters FreeSurfer's internal N3 bias field correction (Sled et al., 1998) parameters to be more appropriate for 3T MRI (Zheng et al., 2009) and uses a 3T-based atlas for Talairach alignment (FreeSurfer Release Notes, 2015). Use of this flag improved diagnostic separability and reduced failure rates of FreeSurfer cortical thicknesses during preliminary internal testing (data not presented). Volumes in each ROI of FreeSurfer's atlas were obtained directly from FreeSurfer's output aseg.stats and aparc.stats files. FreeSurfer segmentation outputs were each visually inspected for severe errors. When severe errors occurred, or when FreeSurfer crashed without providing outputs and this was not fixed by repeated attempts, FreeSurfer analyses of those scans were omitted, and we noted these instances in Section 2.1. No manual correction of FreeSurfer segmentations was performed.
2.3.3. FreeSurfer cortical thickness methods
FreeSurfer cortical thickness values were also output by the same recon-all script executions that produced GM volumes as described in Section 2.3.2. Thicknesses in each ROI of FreeSurfer's atlas were obtained from FreeSurfer's output *.aparc.stats files. Internally, FreeSurfer's cortical thickness algorithm calculates the mean distance between vertices of a corrected, triangulated estimated GM/WM surface and GM/CSF (pial) surface (Fischl and Dale, 2000).
2.3.4. ANTs cortical thickness methods
ANTs cortical thickness was run using its included antsCorticalThickness.sh script, dubbed the ANTs Cortical Thickness Processing Pipeline (Tustison et al., 2014). This was applied to the bias-corrected, preprocessed image as output by our customized SPM12 pipeline described in Section 2.3.1, because preliminary internal testing showed slightly increased diagnostic separability by using the bias-corrected image as input (despite then-redundant correction by N4 later within the pipeline), rather than the preprocessed input corrected only for gradient-warping (data not presented). Improvement by this double-bias correction may reflect an additive combination of two methods with highly-differing assumptions, but it may also reflect a combination of both methods' errors producing increased disease-dependent errors. We include in our comparison this variant that produced superior separation in order to compare each method with its optimal parameters, but we leave further exploration of bias correction methods and their effects to future work. Because the ANTs package does not include a stock template or segmentation priors, we used our in-house population-specific template/priors, which we describe in Section 2.5 and show in Supplementary Fig. S1.
Internally, the ANTs cortical thickness pipeline performs its own bias correction using the N4 algorithm (Tustison et al., 2010), segmentation using ANTs' Atropos algorithm (Avants et al., 2011), and finally cortical thickness calculation using these segmentations as input. ANTs' cortical thickness algorithm, DiReCT, performs a nonlinear registration between a mask of voxels segmented as WM and a mask of voxels segmented as either GM or WM, measuring the distance from start to finish at each GM-segmented location. This can be thought of as growing the WM/GM surface (outer contour of the WM-segmented voxels) across the GM ribbon to reach the GM/CSF surface (outer contour of a mask of GM voxels + WM voxels) and measuring the distance moved (Das et al., 2009). We compiled the most recent ANTs package source code from the public repository (GitHub - stnava/ANTs: Advanced Normalization Tools, 2015) at the time, February 25, 2014.
2.3.5. SPM12 segmentations input to ANTs thickness (SPM+DiReCT) cortical thickness methods
While the ANTs cortical thickness pipeline provides an end-to-end solution to produce cortical thickness values, it is also possible to run only the cortical thickness algorithm (DiReCT) using directly-input tissue segmentations. For this approach, we used the SPM12 GM and WM tissue segmentations produced as described in Section 2.3.1 directly as input into ANTs' DiReCT algorithm (implemented by its included KellyKapowski software), after relabeling subcortical GM structures as WM, mirroring the standard ANTs thickness pipeline's process. Parameters to KellyKapowski matched those used in antsCorticalThickness.sh.
2.4. TIV calculation methods
TIV obtained from FreeSurfer was used in assessing correlations between FreeSurfer methods and TIV. Internally, FreeSurfer TIVs are calculated using the warp parameters calculated for transforming subject scans to a template, a method which has been previously described and validated (Buckner et al., 2004).
SPM and the ANTs cortical thickness pipeline do not provide standard measures of TIV. To calculate TIV values used for assessing correlation of TIV with volume and thickness measures from each pipeline, we calculated TIV from SPM12 segmentations as follows. The segmentation output images for GM, WM and CSF were summed and thresholded at 0.5 to form a binary image. Empirically, this image may contain some extra-cranial voxels if they are particularly isointense to the intra-cranial tissues. The binary images were eroded with three passes of a 27-connected kernel. The largest connected component was selected, and all smaller components were removed. Four passes of image dilation were performed using a 27-connected kernel. Any voxels in the dilated mask which were not included in the original binary image were excluded. Lastly, a 3D hole-fill was performed to arrive at a final TIV mask. TIV then measured as the product of voxel size and the number of voxels in the final mask. The first steps of this independently-developed method, prior to the morphological cleanup steps, match a previously validated method using SPM5 that was shown to be more reliable than TIV estimates from FreeSurfer 3.0.2 (Pengas et al., 2009). Similar TIV estimation methods based on thresholded SPM12 segmentations have also been shown to have significantly higher agreement with ground truth than those from either FreeSurfer 5.1.0 or SPM8 (Malone et al., 2015).
2.5. Atlas and ROI parcellation methods
For methods based on SPM and ANTs, we employed a common anatomical template/atlas to parcellate each method's output per-voxel, native-space measurements into a set of ROIs. Rather than employ popular public templates derived from younger populations, we used an in-house template, specific to our study population, called MCSA202. This template was created from scans of 202 subjects in the Mayo Clinic Study of Aging and the Mayo Clinic Alzheimer's Disease Research Center studies (Petersen et al., 2010, Roberts et al., 2008). Briefly, each subject's T1-weighted MRI was segmented using the SPM12 software with default settings and a custom template was created from these segmentations using the DARTEL groupwise, nonlinear registration algorithm as included in SPM12 (Ashburner, 2007). For each input T1-weighted image in this work, we calculated a nonlinear registration between it and our MCSA202 template using the ANTs SyN registration algorithm (Avants et al., 2008) using multiple channels including the T1-weighted images, segmented tissue probabilities, and a mask of TIV. In the space of the MCSA202 template, we have produced a set of 122 anatomically-defined gray matter ROIs that we call our ADIR122 atlas. The ROIs defined in this template space were then warped and resampled with the nearest-neighbor method to the space of each input T1-weighted image. These subject-space atlas labels were then used to parcellate voxel-wise volume/thickness measurements into a set of ROIs. For volumes, we calculated the sum of the segmented GM probabilities per-voxel, and for thicknesses we calculated the mean thickness value across voxels segmented as GM by each method. The MCSA202 template, its associated tissue priors, and the ADIR122 atlas will be fully described as part of a subsequent publication, and are visualized in Fig. S1 in the Supplementary material.
For methods based on FreeSurfer, we directly used the volume and thickness values provided by FreeSurfer, which are calculated using FreeSurfer's native Desikan-Killiany atlas (Desikan et al., 2006).
3. Experiments
This section provides descriptions of the experiments performed using each dataset. All scans used were validated in-house by expert analysts to confirm acceptable image quality and lack of significant confounding pathology. All segmentation, cortical thickness, and ROI parcellation outputs from each method were examined to assess failure rates and exclude subjects from each analysis where necessary. Descriptions of subject characteristics and any failure-based exclusions were noted in Section 2.1.
3.1. Mayo clinical diagnostic separability dataset
T1-weighted MRI scans were performed on 3T scanners (models Discovery MR750, Signa Excite, Signa Excite, Signa HDx, Signa HDxt) manufactured by General Electric (GE) using a Sagittal 3D magnetization prepared rapid acquisition gradient recalled echo (MP-RAGE) sequence. Repetition time (TR) was ≈ 2300 ms, echo time (TE) ≈ 3 ms, and inversion time (TI) = 900 ms.Voxel dimensions were ≈ 1.20 × 1.015 × 1.015 mm.
The area under the receiver operating characteristic curve (AUROC) with 95% confidence limits was calculated using this dataset to assess the ability of volume or thickness measures produced by each method to separate clinically normal subjects from those diagnosed with either MCI or AD. Spearman rank correlations with 95% confidence limits were used to assess correlations between volume or thickness measures and TIV among the CN subjects in this dataset.
3.2. Mayo Clinic reliability dataset
MRI acquisition parameters for these subjects were the same as those in Section 3.1.
Intraclass correlation coefficients (ICC) with 95% confidence limits were calculated using this dataset to assess repeatability of the volume and thickness measures produced by each method. It is assumed that these subjects should not have significant structural changes within such a small time window, and thus all differences between serial measurements can be attributed to measurement error.
3.3. ADNI reliability dataset
Details of ADNI-standard acquisitions have been previously published (Jack et al., 2010). Scans were included from three manufacturers: 34 GE-scanned subjects, 77 Siemens-scanned subjects, and 22 Philips-scanned subjects.
We used this dataset to assess repeatability of each method's measurements in a multi-site, multi-vendor setting using publically available data. Again, we assume no significant neurological changes occurred and thus all differences between serial measurements can be attributed to noise and error. ICCs were calculated within manufacturers as well as among all manufacturers combined.
3.4. Mayo Clinic pathology (Braak-stage) correlation dataset
Neuropathologic sampling followed recommendations of the Consortium to Establish a Registry for Alzheimer's Disease (CERAD). Further details were previously published (Knopman et al., 2003). MRI parameters were identical to those in Section 3.1. For each method, volume or thickness values were taken only from the hemisphere on which pathological assessment was performed.
Spearman rank correlations with 95% confidence limits were calculated using this dataset to assess the ability of each method's measurements to predict pathology-based AD severity staging at later autopsy. Braak neurofibrillary tangle stages worsen from 1–6. For reporting purposes, to show positive correlation coefficients, correlations between volume or thickness measures and negative Braak stage are shown. We include data for all ROIs, including those for which high correlation with Braak stage is expected (e.g. entorhinal cortex, fusiform, etc.) and those for which low correlation with Braak stage is expected (e.g. postcentral, supplementary motor, etc.), according to accepted biological models of AD.
3.5. Meta-ROI definition and evaluation
We formed an “AD-signature” composite or “meta ROI” for each method to compare our evaluation criteria across all methods. Meta-ROIs were created by combining volume or thickness measures across the top six performing individual ROIs on the diagnostic separability criteria (i.e. highest AUROC values). Volume measures were summed across ROIs, FreeSurfer thicknesses were averaged across ROIs, and ANTs and SPM+DiReCT thicknesses were averaged across ROIs and weighted by each ROI's size. We describe the rationale for using the top six ROIs below in Section 4.1.
Pair-wise differences in the evaluation criteria were tested across all methods for the meta-ROIs. AUROCs between methods were tested using the Delong standard error method (DeLong et al., 1988). Bootstrap methods with 10,000 bootstrap samples were used to test the differences in the magnitude of correlation between the meta-ROI thickness and TIV and the differences in ICC between each pair of methods. Choi's test (Choi, 1977) was used to assess the difference in dependent correlations between the meta-ROI thickness and negative Braak stage.
4. Results and discussion
First, in Section 4.1 we describe our selection of signature meta-ROIs for each method. Next, we discuss in Section 4.2 the comparative performance of these meta-ROIs on each criterion. Finally, in Section 4.3 we compare other practical considerations (failure rate and runtimes) of each method.
4.1. Selection of meta-ROIs for each method
First, we describe the rationale by which we chose our recommended meta-ROIs according to our goals (see Section 3.5). For economy of presentation, we present the data used in their selection only in Supplementary material.
For most methods, including more regions in the meta-ROI after the top-performing ROI alone did not strongly improve diagnostic separability, but did often improve reliability and correlation with Braak stage. Based on these data, we wished to design a signature measure that would maximize performance according to each criterion, while also including a large enough area to increase the power of the measure to quantify a wider range of disease stages (i.e. increase the dynamic range of the measure). Using these criteria, we selected and recommend using the top six ROIs for each method, ranked according to their diagnostic separability. For most methods, these six ROIs generally covered an area large enough to be reliably measured without compromising diagnostic separability or correlation with -Braak stage. In Fig. 1, we show the performance of the top six individual component ROIs for each method that make up its meta-ROI. For visualization purposes, we also provide a figure of the regions included for the SPM+DiReCT method in Fig. 2.
Fig. 1.

Performance of individual ROIs included in meta-ROIs for each of the five methods. For each method, regions in each row are ordered best to worst by their performance in the diagnostic separability (CN vs. MCI/AD) criteria, measured as an area under the receiver operating characteristic curve (AUROC), and plotted in the leftmost column. We show the six regions with the highest AUROC for each method, which together form the meta-ROIs. The second column plots the Spearman rank correlation (rho) between the ROI and total intracranial volume (TIV). The following two columns plot reliability of the measure in each ROI across successive scans, in the two Mayo and ADNI datasets respectively, as measured by intraclass correlation coefficients (ICC). In the ADNI reliability dataset, the ICCs are shown by manufacturer and indicated by colored points. The rightmost column plots the Spearman rank correlation between the ROI and negative Braak stage at autopsy. 95% confidence intervals are shown for all but the per-manufacturer Reliability-ADNI data. AUROC, rho, and ICC values are shown to the right of each panel. Numeric volumes listed for the ADNI reliability panel are for all manufacturers combined. Larger values (toward the right) are preferred in all columns with exception of the second, correlation with TIV, for which values near zero are preferred. Plots of performance for the top 20 ROIs by each method are included in the Supplementary material.
Fig. 2.

Regions included in our recommended AD signature meta-ROIs using the SPM+DiReCT thickness method: entorhinal cortex, fusiform, parahippocampal, mid-temporal, inferior temporal, and angular gyrus.
The top six ROIs from each method were generally a mixture of limbic and inferior lateral temporal regions. The hippocampus and amygdala regions performed highly for volume-based methods, but these are not quantified by thickness-based methods, which favored the entorhinal cortex. These regions are highly consistent with those regions commonly associated with tau deposition in Alzheimer's disease at pathology (Braak and Braak, 1991), and in in-vivo studies using Tau-PET imaging (Lowe et al., 2016).
4.2. Performance of meta-ROIs for each method
We present in Fig. 3 the performance of each meta-ROI for each method, according to each of our performance criteria. Confidence intervals are presented in the figure, but we also provide a table of p-values of each pairwise comparison in Supplementary Table S2.
Fig. 3.
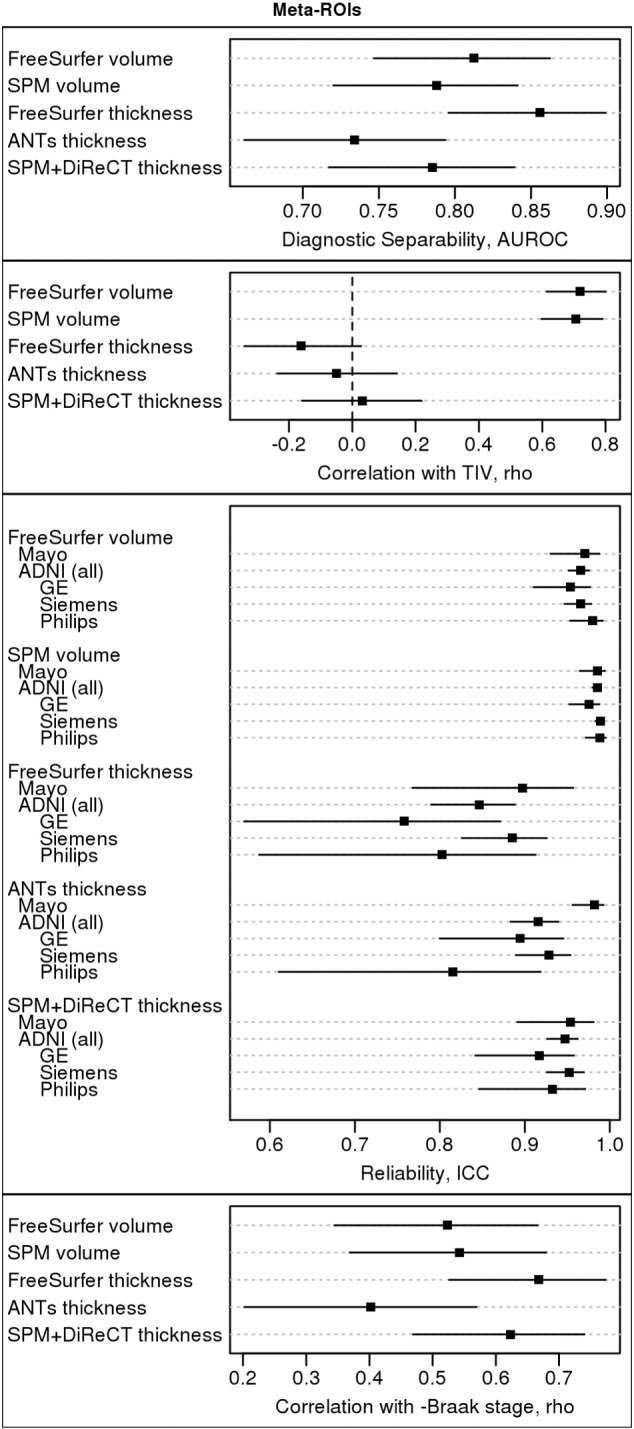
Comparative performance summary of AD Signature Meta-ROIs. A table of pair-wise p-values for comparisons between methods by each criterion is provided in Supplementary Table S2.
4.2.1. Clinical diagnostic separability criterion
According to clinical diagnostic separability AUROCs, FreeSurfer thickness had the highest performance of all signature meta-ROI measures, but its performance was not significantly better (with a significance threshold of p < 0.05) than the next-best method, FreeSurfer volumes (p = 0.12). Its performance was, however, significantly better than that of SPM volumes (p = 0.04) and SPM+DiReCT thickness (p = 0.02). ANTS thickness had the worst performance, which was significantly worse than the FreeSurfer thickness (p < 0.001) and FreeSurfer volume (p = 0.01) methods.
4.2.2. Correlation with TIV criterion
Both volume methods were similarly highly correlated with TIV (p = 0.85) and significantly more correlated with TIV (p < 0.001 for all) than all three thickness measures. This result is expected, and agrees with previously reported studies (Barnes et al., 2010). Although some previous studies have suggested that the method of TIV calculation used in FreeSurfer is more accurate than methods based on segmented T1 images, such as that we use for our SPM- and ANTs-based pipelines (Buckner et al., 2004), we did not find any significant differences in the level of correlation between each volume-based signature and its respective TIV measurement, suggesting that the differences in TIV calculation methodology are not relevant to each signature measure's level of correlation with TIV. There were no significant differences in the correlation with TIV across the three thickness measures (p ≥ 0.13).
4.2.3. Reliability criterion
Volume measures were very reliably measured and generally more reliable than thickness measures, likely due to the increased computational challenge in measuring thickness from MRI. SPM volumes were the most reliable, and this difference was significant versus FreeSurfer volumes in the ADNI dataset (p < 0.001), but was not significant in the Mayo dataset (p = 0.15). FreeSurfer volumes were significantly more reliable than FreeSurfer thickness in all datasets (p ≤ 0.002). SPM+DiReCT was the most reliable among thickness methods: it was not significantly worse than FS volumes (p ≥ 0.11), but it was significantly more reliable than FS thicknesses in the ADNI dataset (p < 0.001), although this difference was not significant for the Mayo dataset (p = 0.24). The reliability of ANTS thicknesses was inconsistent across datasets, making it difficult to draw conclusions about them.
4.2.4. Correlation with Braak stage (pathology)
FreeSurfer thickness and SPM+DiReCT thickness had the largest inverse correlations with Braak stage at pathology; however, these correlations were not significantly higher than the correlations seen with the volume measures (p ≥ 0.14) and were not significantly different from each other (p = 0.68). ANTS thickness had by far the worst performance. This difference was only significant versus the FreeSurfer and SPM+DiReCT thickness methods (p = 0.001 and 0.01, respectively), but not versus either volume (p ≥ 0.23).
4.3. Comparison of practical considerations between methods
While ease-of-use concerns are difficult to quantify and are not an explicit criteria for differentiating methods in this manuscript, we recognize that these can play an important role in many analyses and discuss them here.
4.3.1. Failure rates
For FreeSurfer we define failures either as failing to produce thickness values for a given scan, or producing cortical ribbon segmentations that are significantly misplaced (i.e. located outside the true cortical ribbon) for a given scan. After carefully running our datasets through FreeSurfer under a variety of runtime flags that appeared reasonable according to the documentation, we determined the optimum method of running recon_all for both failure rate and diagnostic separability: using the -3T flag, but not the -MPRAGE flag, on our 3T, MPRAGE scans which had not undergone other preprocessing. With this we achieved a FreeSurfer failure rate of only three subjects across all datasets (3 / (216 + 21 + 133 + 82) = 3/452 ≈ 0.66%). FreeSurfer failures, when encountered, occurred in scans of brains more impacted by AD and vascular pathologies (Supplementary Fig. S12). This suggests, but does not prove, that FreeSurfer failure rates are influenced by the severity of disease in input brain scans, and thus are a potentially biasing source of missing data. Regardless, we did not encounter any such failures for the SPM volume, ANTS thickness, or SPM+DiReCT pipelines. We hypothesize that such differences in failure rates, and possibly systematic sources of missing data, would be a possible consideration when designing clinical trials with MRI-based endpoints.
4.3.2. Program runtime
Runtime is another practical consideration that can influence choice of algorithm. In Fig 4 we plot the comparative runtimes for each method while varying the number of processor cores used. A random Mayo subject was chosen for this experiment, because it is not feasible to run a large number of subjects using all of these variations on multi-user computing grids while keeping each run isolated from each other and from other users' jobs. However, these results are typical to our anecdotal experiences running each algorithm. Runtime testing was performed using multiple identical systems each with 2 Intel XEON X5670 (6 core) hyperthreaded processors, for a total of 12 physical cores, or 24 with hyperthreading, and 24GB DDR3 1333 MHz RAM. These systems were free of other significant computing load at the time of testing. Values for the SPM pipeline include the time to generate a warp to the template using the ANTS algorithm for atlas propagation. Values for SPM+DiReCT include the time for the SPM pipeline, which produces the required input segmentations and nonlinear transformations to the standard atlas. Values for FreeSurfer are given once for both volume and thickness, because the surface-based algorithm that produces thickness values is also what produces the cortical parcellation for gray matter volumes.
Fig. 4.

Runtimes for candidate methods run on a single random Mayo subject scan.
Although it does not use multiple cores, the SPM volumes pipeline, without DiReCT for thicknesses, was the fastest (approximately 80 min). SPM+DiReCT using a single core ran in about 70% of the time required for FreeSurfer (approximately 7 h vs. 10 h). If more processing cores were allowed, FreeSurfer required approximately 7 h (using the -openmp recon-all flag), while SPM+DiReCT required approximately 2 h (increasing the ITK_GLOBAL_DEFAULT_NUMBER_OF_THREADS environment variable). ANTS thickness pipeline runtimes were similar to those of SPM+DiReCT, also using the same environment variable. All multi-core-enabled algorithms reached diminishing speedups or began to slow down with more than six cores, potentially because there were six cores per each of two processors on the test systems. Overall, for volumes-only, SPM was far faster than FreeSurfer. Among thickness pipelines, ANTS and SPM+DiReCT were comparable and both clearly faster than FreeSurfer, ranging from 2–5 h faster at each number of cores allocated.
5. Discussion
5.1. Discussion
In this work we have tested many methods for a meta-ROI-based “signature” measure of AD severity suitable for broad spectrum use which includes epidemiological studies. While many of the methods performed well, ultimately we and other groups must choose one.
In the diagnostic separability criterion, volume- and thickness-based methods generally performed comparably to each other, while in the pathology-correlation criterion, the FreeSurfer and SPM+DiReCT thickness measures outperformed both volume-based methods, although those differences were not statistically significant. Volume-based measures were generally more reliable than thickness-based measures, and SPM volumes were significantly more reliable than all other methods. SPM+DiReCT was the most reliable of all thickness-based measures, and its reliability was not significantly worse than FS volumes, the second-most reliable method. The strongest finding was that volume measures are significantly more correlated with TIV than thickness measures, which confirms previous studies (Barnes et al., 2010).
When choosing whether to use volume- or thickness-based methods, performance in diagnostic separability was generally comparable between them. Correlation with pathology findings was also generally better for thickness, although those differences were not significant. These suggest that applications desiring only these criteria could reasonably select either volume- or thickness-based methods. However, correlation with TIV was by far the most discriminating difference between volumes and thicknesses. Correlation with TIV is an important consideration when choosing a measure that will be used to examine age and sex effects in epidemiological studies, but it is important to note that correcting for TIV is not straightforward. On average, men have larger heads than women, and consequently any apparent sex effects in MRI measures are potentially confounded with TIV. In any mixed-sex cohort over a wide range of ages, genuine differences by sex are of interest and may be expected since, on average, men have a greater relative risk for brain atrophy, hypothesized to be due to increased prevalence of alpha-synuclein proteinopathies and increased lifetime-cumulative exposure to cardiovascular and other risk factors (DeCarli et al., 2005, Petersen et al., 2010, Savica et al., 2013). The absence of an estrogen protective effect may also contribute. Additionally, the increased prevalence of disease with age naturally reduces the correlation between volumes and TIV in older populations. These factors suggest that attempts to correct volume measurements for TIV should also be dependent upon both age and sex, i.e. more complex than the traditional, simple linear regression method or ratio division by TIV. Because a hypothetical multivariate correction requires a more complex statistical model with interaction terms, these parameters must be fine-tuned and validated. However, attempts to do this become inherently circular, because it is impossible to separate sex-based differences in relative risk factors from biases due to imaging-based volume measurements being correlated with TIV. Such a process has limitations because over/under-correction could introduce artifactual age/sex effects or hide true age/sex effects in an analysis. Furthermore, because the amount of correlation between volume and TIV varies across regions (Im et al., 2008), these age- and sex-dependent corrections must also be created and validated separately for each ROI, making them even more unwieldy in a multi-ROI environment. It has been demonstrated that differing methods of estimating TIV and normalizing volume measurements by TIV can produce associates that can depend on gender, age, and atrophy (Nordenskjöld et al., 2013, Voevodskaya et al., 2014), can affect study power (Hansen et al., 2015), and can depend on the study populations and fine-tuning of algorithm parameters (Sargolzaei et al., 2015).
For these reasons, we propose that the best solution for any researcher desiring an epidemiological assessment of neurodegeneration in regions characteristic of Alzheimer's disease in a cohort with a large age range is to use thickness measurements rather than volumes, because thickness is sufficiently uncorrelated with TIV to render this challenging correction unnecessary. This choice allows for a measure capable of investigating sex differences. It is important to note that our recommendation here is limited to this epidemiological use case for subjects across the entire age spectrum, and we are not challenging the use of hippocampal volumes or other volume-based measures as a diagnostic measure in older impaired individuals. Volume-based measures, unlike thickness, also allow measurement of values in regions such as the hippocampus, amygdala, cerebellum, etc. that are not typically available in thickness pipelines either due to resolution constraints, or challenging anatomic shape. They also allow measurement of structures that are not composed of gray matter, such as the pons and midbrain. However, for typical AD most of the excluded structures are less relevant, so this less of a concern.
Among thickness methods, ANTS thicknesses (using the ANTs Cortical Thickness Pipeline as described in Sec. 2.3.4) had the worst performance in the separability and pathology-correlation criteria, while performing comparably in the other criteria versus the other thickness measures. Therefore, this ANTs method is not recommended. Among the remaining two candidates, FreeSurfer thickness significantly outperformed SPM+DiReCT in the diagnostic separability criteria, although the two were not significantly different in the correlation with TIV or in the pathology-correlation criteria. SPM+DiReCT was more reliable than FreeSurfer thickness, which was significant in the ADNI dataset, but not in the Mayo dataset.
Overall, the FreeSurfer and SPM+DiReCT thickness-based signatures both performed well in our analyses. However, our group and others must make a choice between them. Although somewhat worse in diagnostic separability than FreeSurfer thickness (0.79 versus 0.86), our group will ultimately use and recommend the SPM+DiReCT cortical thickness method because of its superior reliability and runtime/failure rates, while achieving similar performance in pathology- and TIV- correlation measures. For this method we recommend a meta-ROI combining values from the entorhinal cortex, fusiform, parahippocampal, mid-temporal, inferior temporal, and angular gyrus regions. Other groups may choose to use FreeSurfer because it is a publically available, supported, end-to-end package: with this we recommend an AD signature based on cortical thickness estimates from the entorhinal cortex, inferior temporal, mid-temporal, inferior parietal, fusiform, and precuneus regions.
It is important to note that the AD signature we describe here is that of typical late onset AD characterized by a predominantly amnestic onset evolving to a multi-domain clinical presentation. Since clinical phenotype closely matches the topographic pattern of atrophy in neurodegenerative diseases, MRI signatures of atypical AD (e.g. logopenic aphasia or posterior cortical atrophy syndromes) could be developed using a similar approach.
5.2. Strengths and limitations of current study
The strength of this study lies primarily in providing a thorough comparison of modern, popular methods for designing a “signature” composite severity measure of AD-related neurodegeneration. We provide testing for both accuracy and precision (reliability) measures, and we include correlation with Braak stage at later autopsy, which is ultimately the gold standard measurement of AD severity, in a large cohort of 82 subjects. We carefully tested each method in preliminary analyses to modify parameters and optimize accuracy, and we provide details of these optimizations as a further benefit to the field.
While this study tests several popularly available candidate methods for volume and thickness, several others remain untested, such as GM volumes provided by FSL segmentations (Zhang et al., 2001) or ANTs ATROPOS segmentations (Avants et al., 2011), or thicknesses measured by algorithms like CIVET (Lerch and Evans, 2005) or Brainsuite (Shattuck and Leahy, 2002). One could also examine other combinations of segmentation methods input to thickness methods, or methods that include a combination of volume, thickness, and/or other measures together. These are left for future work. We also did not examine machine-learning-based feature selection methods for meta-ROI selection, or selection of individual voxels using voxel-based morphometry, principle components analysis, etc., because such data-driven methods would generally not have knowledge of biological plausibility to produce signature ROIs consistent with known pathophysiology of typical AD (i.e. Braak staging), and imposing such constraints upon them via statistical priors would severely limit their theoretical gains in performance. We also did not present an analysis of surface area or curvature measures produced by FreeSurfer in order to limit manuscript length and complexity, but these were examined internally using the diagnostic separability criterion, and their performances were sufficiently lower than those of GM volumes and thicknesses such that we did not explore them further. Surface area was, as expected, also highly correlated with TIV, limiting its potential attractiveness. To limit manuscript complexity, we also did not present the results of combinations of the FreeSurfer- and SPM-based signatures using the differing approaches to TIV from each, because these would not represent the natural use cases for each method. However, we did internally assess correlation between FreeSurfer volumes using TIV measures from SPM at an earlier stage of the analysis, and it did not alter the requirement that such volumes would require correction by TIV.
Because autopsy is the gold-standard measurement of AD severity, we examined correlation between Braak stage and each of our imaging-based measures. Between imaging and death, it is possible that brain changes could have occurred that reduced these correlations. However, this limitation was identical for all volume- and thickness-based methods compared in this work, and thus should not have influenced comparisons across methods.
We also only tested the most-current release of each algorithm at the time the work began. We recognize that at time of writing, FreeSurfer 6 release is imminent. It is not known to us whether this version will contain updates to algorithms relevant to our comparisons.
Acknowledgements
The authors would like to thank these funding sources: R01-AG040042; R01-AG011378; R00-AG37573, P50-AG16574/P1; R01-AG041851; U01-AG24904; U01-AG06786; P50-AG16574; R01-AG034676; The Alexander Family Professorship of Alzheimer's Disease Research, Mayo Clinic; the GHR Foundation.
Data collection and sharing for the ADNI dataset used in this project was funded by the Alzheimer's Disease Neuroimaging Initiative (ADNI) (National Institutes of Health Grant U01 AG024904) and DOD ADNI (Department of Defense award number W81XWH-12-2-0012). ADNI is funded by the National Institute on Aging, the National Institute of Biomedical Imaging and Bioengineering, and through generous contributions from the following: AbbVie, Alzheimer's Association; Alzheimer's Drug Discovery Foundation; Araclon Biotech; BioClinica, Inc.; Biogen; Bristol-Myers Squibb Company; CereSpir, Inc.; Eisai Inc.; Elan Pharmaceuticals, Inc.; Eli Lilly and Company; EuroImmun; F. Hoffmann-La Roche Ltd. and its affiliated company Genentech, Inc.; Fujirebio; GE Healthcare; IXICO Ltd.; Janssen Alzheimer Immunotherapy Research & Development, LLC.; Johnson & Johnson Pharmaceutical Research & Development LLC.; Lumosity; Lundbeck; Merck & Co., Inc.; Meso Scale Diagnostics, LLC.; NeuroRx Research; Neurotrack Technologies; Novartis Pharmaceuticals Corporation; Pfizer Inc.; Piramal Imaging; Servier; Takeda Pharmaceutical Company; and Transition Therapeutics. The Canadian Institutes of Health Research is providing funds to support ADNI clinical sites in Canada. Private sector contributions are facilitated by the Foundation for the National Institutes of Health (www.fnih.org). The grantee organization is the Northern California Institute for Research and Education, and the study is coordinated by the Alzheimer's Disease Cooperative Study at the University of California, San Diego. ADNI data are disseminated by the Laboratory for Neuro Imaging at the University of Southern California.
Footnotes
Supplementary data to this article can be found online at http://dx.doi.org/10.1016/j.nicl.2016.05.017.
Appendix A. Supplementary data
Supplementary figures and tables.
References
- ADNI Home . 2013. [WWW Document] (URL www.adni-info.org (accessed 1.1.15)) [Google Scholar]
- Ashburner J. A fast diffeomorphic image registration algorithm. NeuroImage. 2007;38:95–113. doi: 10.1016/j.neuroimage.2007.07.007. [DOI] [PubMed] [Google Scholar]
- Ashburner J., Friston K.J. Unified segmentation. NeuroImage. 2005;26:839–851. doi: 10.1016/j.neuroimage.2005.02.018. [DOI] [PubMed] [Google Scholar]
- Avants B.B., Epstein C.L., Grossman M., Gee J.C. Symmetric diffeomorphic image registration with cross-correlation: evaluating automated labeling of elderly and neurodegenerative brain. Med. Image Anal. 2008;12:26–41. doi: 10.1016/j.media.2007.06.004. [DOI] [PMC free article] [PubMed] [Google Scholar]
- Avants B.B., Tustison N.J., Wu J., Cook P.A., Gee J.C. An open source multivariate framework for n-tissue segmentation with evaluation on public data. Neuroinformatics. 2011;9:381–400. doi: 10.1007/s12021-011-9109-y. [DOI] [PMC free article] [PubMed] [Google Scholar]
- Bakkour A., Morris J.C., Dickerson B.C. The cortical signature of prodromal AD: regional thinning predicts mild AD dementia. Neurology. 2009;72:1048–1055. doi: 10.1212/01.wnl.0000340981.97664.2f. [DOI] [PMC free article] [PubMed] [Google Scholar]
- Barnes J., Ridgway G.R., Bartlett J., Henley S.M.D., Lehmann M., Hobbs N., Clarkson M.J., MacManus D.G., Ourselin S., Fox N.C. Head size, age and gender adjustment in MRI studies: a necessary nuisance? NeuroImage. 2010;53:1244–1255. doi: 10.1016/j.neuroimage.2010.06.025. [DOI] [PubMed] [Google Scholar]
- Bobinski M., de Leon M.J., Convit A., de Santi S., Wegiel J., Tarshish C.Y., Louis L.A.S., Wisniewski H.M. MRI of entorhinal cortex in mild Alzheimer's disease. Lancet. 1999;353:38–40. doi: 10.1016/s0140-6736(05)74869-8. [DOI] [PubMed] [Google Scholar]
- Braak H., Braak E. Neuropathological stageing of Alzheimer-related changes. Acta Neuropathol. 1991;82:239–259. doi: 10.1007/BF00308809. [DOI] [PubMed] [Google Scholar]
- Buckner R.L., Head D., Parker J., Fotenos A.F., Marcus D., Morris J.C., Snyder A.Z. A unified approach for morphometric and functional data analysis in young, old, and demented adults using automated atlas-based head size normalization: reliability and validation against manual measurement of total intracranial volume. NeuroImage. 2004;23:724–738. doi: 10.1016/j.neuroimage.2004.06.018. [DOI] [PubMed] [Google Scholar]
- Choi S.C. Tests of equality of dependent correlation coefficients. Biometrika. 1977;64:645–647. [Google Scholar]
- Das S.R., Avants B.B., Grossman M., Gee J.C. Registration based cortical thickness measurement. NeuroImage. 2009;45:867–879. doi: 10.1016/j.neuroimage.2008.12.016. [DOI] [PMC free article] [PubMed] [Google Scholar]
- Das S.R., Avants B.B., Grossman M., Gee J.C. Measuring cortical thickness using an image domain local surface model and topology preserving segmentation. Comput. Vision Int. Conf. 2007 [Google Scholar]
- de Leon M., Bobinski M., Convit A., Wolf O., Insausti R. Usefulness of MRI measures of entorhinal cortex. Neurology. 2001;56:820–823. doi: 10.1212/wnl.56.6.820. [DOI] [PubMed] [Google Scholar]
- DeCarli C., Massaro J., Harvey D., Hald J., Tullberg M., Au R., Beiser A., D'Agostino R., Wolf P.A. Measures of brain morphology and infarction in the Framingham heart study: establishing what is normal. Neurobiol. Aging. 2005;26:491–510. doi: 10.1016/j.neurobiolaging.2004.05.004. [DOI] [PubMed] [Google Scholar]
- DeLong E.R., DeLong D.M., Clarke-Pearson D.L. Comparing the areas under two or more correlated receiver operating characteristic curves: a nonparametric approach. Biometrics. 1988;44:837–845. [PubMed] [Google Scholar]
- Desikan R.S., Ségonne F., Fischl B., Quinn B.T., Dickerson B.C., Blacker D., Buckner R.L., Dale A.M., Maguire R.P., Hyman B.T., Albert M.S., Killiany R.J. An automated labeling system for subdividing the human cerebral cortex on MRI scans into gyral based regions of interest. NeuroImage. 2006;31:968–980. doi: 10.1016/j.neuroimage.2006.01.021. [DOI] [PubMed] [Google Scholar]
- Dickerson B.C., Bakkour A., Salat D.H., Feczko E., Pacheco J., Greve D.N., Grodstein F., Wright C.I., Blacker D., Rosas H.D., Sperling R.A., Atri A., Growdon J.H., Hyman B.T., Morris J.C., Fischl B., Buckner R.L. The cortical signature of Alzheimer's disease: regionally specific cortical thinning relates to symptom severity in very mild to mild AD dementia and is detectable in asymptomatic amyloid-positive individuals. Cereb. Cortex. 2009;19:497–510. doi: 10.1093/cercor/bhn113. [DOI] [PMC free article] [PubMed] [Google Scholar]
- Dickerson B.C., Goncharova I., Sullivan M.P., Forchetti C., Wilson R.S., Bennett D.A., Beckett L.A., DeToledo-Morrell L. MRI-derived entorhinal and hippocampal atrophy in incipient and very mild Alzheimer's disease. Neurobiol. Aging. 2001;22:747–754. doi: 10.1016/s0197-4580(01)00271-8. [DOI] [PubMed] [Google Scholar]
- Dickerson B.C., Wolk D.A. MRI cortical thickness biomarker predicts AD-like CSF and cognitive decline in normal adults. Neurology. 2012;78:84–90. doi: 10.1212/WNL.0b013e31823efc6c. [DOI] [PMC free article] [PubMed] [Google Scholar]
- Du A.T., Schuff N., Zhu X.P., Jagust W.J., Miller B.L., Reed B.R., Kramer J.H., Mungas D., Yaffe K., Chui H.C., Weiner M.W. Atrophy rates of entorhinal cortex in AD and normal aging. Neurology. 2003;60:481–486. doi: 10.1212/01.wnl.0000044400.11317.ec. [DOI] [PMC free article] [PubMed] [Google Scholar]
- Fan Y., Resnick S.M., Wu X., Davatzikos C. Structural and functional biomarkers of prodromal Alzheimer's disease: a high-dimensional pattern classification study. NeuroImage. 2008;41:277–285. doi: 10.1016/j.neuroimage.2008.02.043. [DOI] [PMC free article] [PubMed] [Google Scholar]
- Fischl B. FreeSurfer. NeuroImage. 2012;62:774–781. doi: 10.1016/j.neuroimage.2012.01.021. [DOI] [PMC free article] [PubMed] [Google Scholar]
- Fischl B., Dale A.M. Measuring the thickness of the human cerebral cortex from magnetic resonance images. Proc. Natl. Acad. Sci. U. S. A. 2000;97:11050–11055. doi: 10.1073/pnas.200033797. [DOI] [PMC free article] [PubMed] [Google Scholar]
- Fischl B., Stevens A.A., Rajendran N., Yeo B.T.T., Greve D.N., Van Leemput K., Polimeni J.R., Kakunoori S., Buckner R.L., Pacheco J., Salat D.H., Melcher J., Frosch M.P., Hyman B.T., Grant P.E., Rosen B.R., van der Kouwe A.J.W., Wiggins G.C., Wald L.L., Augustinack J.C. Predicting the location of entorhinal cortex from MRI. NeuroImage. 2009;47:8–17. doi: 10.1016/j.neuroimage.2009.04.033. [DOI] [PMC free article] [PubMed] [Google Scholar]
- Freesurfer FAQ . 2015. [WWW Document] (URL https://surfer.nmr.mgh.harvard.edu/fswiki/UserContributions/FAQ (accessed 7.1.15)) [Google Scholar]
- FreeSurfer Release Notes . 2015. [WWW Document] (URL http://freesurfer.net/fswiki/ReleaseNotes (accessed 5.28.15)) [Google Scholar]
- GitHub - stnava/ANTs: Advanced Normalization Tools . 2015. [WWW Document] (URL https://github.com/stnava/ANTs/(accessed 1.1.16)) [Google Scholar]
- Gómez-Isla T., Price J.L., McKeel D.W., Morris J.C., Growdon J.H., Hyman B.T. Profound loss of layer II entorhinal cortex neurons occurs in very mild Alzheimer's disease. J. Neurosci. 1996;16:4491–4500. doi: 10.1523/JNEUROSCI.16-14-04491.1996. [DOI] [PMC free article] [PubMed] [Google Scholar]
- Hansen T.I., Brezova V., Eikenes L., Håberg A., Vangberg X.T.R. How does the accuracy of intracranial volume measurements affect normalized brain volumes? Sample size estimates based on 966 subjects from the HUNT MRI cohort. Am. J. Neuroradiol. 2015;36:1450–1456. doi: 10.3174/ajnr.A4299. [DOI] [PMC free article] [PubMed] [Google Scholar]
- Hua X., Lee S., Yanovsky I., Leow A.D., Chou Y.Y., Ho A.J., Gutman B., Toga A.W., Jack C.R., Bernstein M.A., Reiman E.M., Harvey D.J., Kornak J., Schuff N., Alexander G.E., Weiner M.W., Thompson P.M. Optimizing power to track brain degeneration in Alzheimer's disease and mild cognitive impairment with tensor-based morphometry: an ADNI study of 515 subjects. NeuroImage. 2009;48:668–681. doi: 10.1016/j.neuroimage.2009.07.011. [DOI] [PMC free article] [PubMed] [Google Scholar]
- Hyman B.T., Van Hoesen G.W., Damasio A.R., Barnes C.L. Alzheimer's disease: cell-specific pathology isolates the hippocampal formation. Science. 1984;225:1168–1170. doi: 10.1126/science.6474172. (80-.) [DOI] [PubMed] [Google Scholar]
- Iglesias J.E., Augustinack J.C., Nguyen K., Player C.M., Player A., Wright M., Roy N., Frosch M.P., McKee A.C., Wald L.L., Fischl B., Van Leemput K. A computational atlas of the hippocampal formation using ex vivo, ultra-high resolution MRI: application to adaptive segmentation of in vivo MRI. NeuroImage. 2015;115:117–137. doi: 10.1016/j.neuroimage.2015.04.042. [DOI] [PMC free article] [PubMed] [Google Scholar]
- Im K., Lee J.M., Lyttelton O., Kim S.H., Evans A.C., Kim S.I. Brain size and cortical structure in the adult human brain. Cereb. Cortex. 2008;18:2181–2191. doi: 10.1093/cercor/bhm244. [DOI] [PubMed] [Google Scholar]
- Jack C.R.J., Bernstein M.A., Borowski B.J., Gunter J.L., Fox N.C., Thompson P.M., Schuff N., Krueger G., Killiany R.J., DeCarli C.S., Dale A.M., Weiner M.W., Carmichael O.W., Tosun D., Weiner M.W. Update on the magnetic resonance imaging core of the Alzheimer's disease neuroimaging initiative. Alzheimers Dement. 2010;6:212–220. doi: 10.1016/j.jalz.2010.03.004. [DOI] [PMC free article] [PubMed] [Google Scholar]
- Jack C.R.J., Lowe V.J., Senjem M.L., Weigand S.D., Kemp B.J., Shiung M.M., Knopman D.S., Boeve B.F., Klunk W.E., Mathis C.A., Petersen R.C. 11C PiB and structural MRI provide complementary information in imaging of Alzheimer's disease and amnestic mild cognitive impairment. Brain. 2008;131:665–680. doi: 10.1093/brain/awm336. [DOI] [PMC free article] [PubMed] [Google Scholar]
- Jack C.R.J., Petersen R.C., O'Brien P.C., Tangalos E.G. MR-based hippocampal volumetry in the diagnosis of Alzheimer's disease. Neurology. 1992;42:183–188. doi: 10.1212/wnl.42.1.183. [DOI] [PubMed] [Google Scholar]
- Jack C.R.J., Twomey C.K., Zinsmeister A.R., Sharbrough F.W., Petersen R.C., Cascino G.D. Anterior temporal lobes and hippocampal formations: normative volumetric measurements from MR images in young adults. Radiology. 1989;172:549–554. doi: 10.1148/radiology.172.2.2748838. [DOI] [PubMed] [Google Scholar]
- Jack C.R.J., Wiste H.J., Lesnick T.G., Weigand S.D., Knopman D.S., Vemuri P., Pankratz V.S., Senjem M.L., Gunter J.L., Mielke M.M., Lowe V.J., Boeve B.F., Petersen R.C. Brain β-amyloid load approaches a plateau. Neurology. 2013;80:890–896. doi: 10.1212/WNL.0b013e3182840bbe. [DOI] [PMC free article] [PubMed] [Google Scholar]
- Jack C.R.J., Wiste H.J., Weigand S.D., Rocca W.A., Knopman D.S., Mielke M.M., Lowe V.J., Senjem M.L., Gunter J.L., Preboske G.M., Pankratz V.S., Vemuri P., Petersen R.C. Age-specific population frequencies of cerebral β-amyloidosis and neurodegeneration among people with normal cognitive function aged 50–89 years: a cross-sectional study. Lancet Neurol. 2014;13:997–1005. doi: 10.1016/S1474-4422(14)70194-2. [DOI] [PMC free article] [PubMed] [Google Scholar]
- Jovicich J., Czanner S., Greve D., Haley E., Van Der Kouwe A., Gollub R., Kennedy D., Schmitt F., Brown G., MacFall J., Fischl B., Dale A. Reliability in multi-site structural MRI studies: effects of gradient non-linearity correction on phantom and human data. NeuroImage. 2006;30:436–443. doi: 10.1016/j.neuroimage.2005.09.046. [DOI] [PubMed] [Google Scholar]
- Juottonen K., Laakso M.P., Partanen K., Soininen H. Comparative MR analysis of the entorhinal cortex and hippocampus in diagnosing Alzheimer disease. Am. J. Neuroradiol. 1999;20:139–144. [PubMed] [Google Scholar]
- Kesslak J.P., Nalcioglu O., Cotman C.W. Quantification of magnetic resonance scans for hippocampal and parahippocampal atrophy in Alzheimer's disease. Neurology. 1991;41:51–54. doi: 10.1212/wnl.41.1.51. [DOI] [PubMed] [Google Scholar]
- Killiany R.J., Hyman B.T., Gomez-Isla T., Moss M.B., Kikinis R., Jolesz F., Tanzi R., Jones K., Albert M.S. MRI measures of entorhinal cortex vs hippocampus in preclinical AD. Neurology. 2002;58:1188–1196. doi: 10.1212/wnl.58.8.1188. [DOI] [PubMed] [Google Scholar]
- Klunk W.E., Engler H., Nordberg A., Wang Y., Blomqvist G., Holt D.P., Bergström M., Savitcheva I., Huang G.F., Estrada S., Ausén B., Debnath M.L., Barletta J., Price J.C., Sandell J., Lopresti B.J., Wall A., Koivisto P., Antoni G., Mathis C.A., Långström B. Imaging brain amyloid in Alzheimer's disease with Pittsburgh compound-B. Ann. Neurol. 2004;55:306–319. doi: 10.1002/ana.20009. [DOI] [PubMed] [Google Scholar]
- Knopman D.S., Parisi J.E., Salviati A., Floriach-Robert M., Boeve B.F., Ivnik R.J., Smith G.E., Dickson D.W., Johnson K.A., Petersen L.E., McDonald W.C., Braak H., Petersen R.C. Neuropathology of cognitively normal elderly. J. Neuropathol. Exp. Neurol. 2003;62:1087–1095. doi: 10.1093/jnen/62.11.1087. [DOI] [PubMed] [Google Scholar]
- Lerch J.P., Evans A.C. Cortical thickness analysis examined through power analysis and a population simulation. NeuroImage. 2005;24:163–173. doi: 10.1016/j.neuroimage.2004.07.045. [DOI] [PubMed] [Google Scholar]
- Lerch J.P., Pruessner J.C., Zijdenbos A., Hampel H., Teipel S.J., Evans A.C. Focal decline of cortical thickness in Alzheimer's disease identified by computational neuroanatomy. Cereb. Cortex. 2005;15:995–1001. doi: 10.1093/cercor/bhh200. [DOI] [PubMed] [Google Scholar]
- Lowe V., Wiste H., Pandey M., Senjem M., Boeve B., Josephs K., Fang P., Kantarci K., Jones D., Schwarz C., Knopman D., Petersen R., Jack C. Tau-PET imaging with AV-1451 in Alzheimer's disease. In: Johnson K.A., Jagust W.J., Klunk W.E., Mathis C.A., editors. Human Amyloid Imaging. World Events Forum, Inc.; Miami Beach, FL, USA: 2016. p. 114. [Google Scholar]
- MacDonald D., Kabani N., Avis D., Evans A.C. Automated 3-D extraction of inner and outer surfaces of cerebral cortex from MRI. NeuroImage. 2000;12:340–356. doi: 10.1006/nimg.1999.0534. [DOI] [PubMed] [Google Scholar]
- Malone I.B., Leung K.K., Clegg S., Barnes J., Whitwell J.L., Ashburner J., Fox N.C., Ridgway G.R. Accurate automatic estimation of total intracranial volume: a nuisance variable with less nuisance. NeuroImage. 2015;104:366–372. doi: 10.1016/j.neuroimage.2014.09.034. [DOI] [PMC free article] [PubMed] [Google Scholar]
- Nordenskjöld R., Malmberg F., Larsson E.-M., Simmons A., Brooks S.J., Lind L., Ahlström H., Johansson L., Kullberg J. Intracranial volume estimated with commonly used methods could introduce bias in studies including brain volume measurements. NeuroImage. 2013;83:355–360. doi: 10.1016/j.neuroimage.2013.06.068. [DOI] [PubMed] [Google Scholar]
- Ortiz A., Górriz J.M., Ramírez J., Martinez-Murcia F.J. Automatic ROI selection in structural brain MRI using SOM 3D projection. PLoS One. 2014;9:1–12. doi: 10.1371/journal.pone.0093851. [DOI] [PMC free article] [PubMed] [Google Scholar]
- Panizzon M.S., Fennema-Notestine C., Eyler L.T., Jernigan T.L., Prom-Wormley E., Neale M., Jacobson K., Lyons M.J., Grant M.D., Franz C.E., Xian H., Tsuang M., Fischl B., Seidman L., Dale A., Kremen W.S. Distinct genetic influences on cortical surface area and cortical thickness. Cereb. Cortex. 2009;19:2728–2735. doi: 10.1093/cercor/bhp026. [DOI] [PMC free article] [PubMed] [Google Scholar]
- Pengas G., Pereira J.M.S., Williams G.B., Nestor P.J. Comparative reliability of total intracranial volume estimation methods and the influence of atrophy in a longitudinal semantic dementia cohort. J. Neuroimaging. 2009;19:37–46. doi: 10.1111/j.1552-6569.2008.00246.x. [DOI] [PubMed] [Google Scholar]
- Petersen R.C., Roberts R.O., Knopman D.S., Geda Y.E., Cha R.H., Pankratz V.S., Boeve B.F., Tangalos E.G., Ivnik R.J., Rocca W.A. Prevalence of mild cognitive impairment is higher in men. The Mayo Clinic Study of Aging. Neurology. 2010;75:889–897. doi: 10.1212/WNL.0b013e3181f11d85. [DOI] [PMC free article] [PubMed] [Google Scholar]
- Roberts R.O., Geda Y.E., Knopman D.S., Cha R.H., Pankratz V.S., Boeve B.F., Ivnik R.J., Tangalos E.G., Petersen R.C., Rocca W.A. The Mayo clinic study of aging: design and sampling, participation, baseline measures and sample characteristics. Neuroepidemiology. 2008;30:58–69. doi: 10.1159/000115751. [DOI] [PMC free article] [PubMed] [Google Scholar]
- Sargolzaei S., Sargolzaei A., Cabrerizo M., Chen G., Goryawala M., Pinzon-Ardila A., Gonzalez-Arias S.M., Adjouadi M. Estimating intracranial volume in brain research: an evaluation of methods. Neuroinformatics. 2015 doi: 10.1007/s12021-015-9266-5. [DOI] [PubMed] [Google Scholar]
- Savica R., Grossardt B.R., Bower J.H., Ahlskog J.E., Rocca W.A. Incidence and pathology of synucleinopathies and tauopathies related to parkinsonism. JAMA Neurol. 2013;70:859–866. doi: 10.1001/jamaneurol.2013.114. [DOI] [PMC free article] [PubMed] [Google Scholar]
- Scheltens P., Leys D., Barkhof F., Huglo D., Weinstein H.C., Vermersch P., Kuiper M., Steinling M., Wolters E.C., Valk J. Atrophy of medial temporal lobes on MRI in “probable” Alzheimer's disease and normal ageing: diagnostic value and neuropsychological correlates. J. Neurol. Neurosurg. Psychiatry. 1992;55:967–972. doi: 10.1136/jnnp.55.10.967. [DOI] [PMC free article] [PubMed] [Google Scholar]
- Seab J.P., Jagust W.J., Wong S.T., Roos M.S., Reed B.R., Budinger T.F. Quantitative NMR measurements of hippocampal atrophy in Alzheimer's disease. Magn. Reson. Med. 1988;8:200–208. doi: 10.1002/mrm.1910080210. [DOI] [PubMed] [Google Scholar]
- Senjem M.L., Gunter J.L., Shiung M.M., Petersen R.C., Jack C.R.J. Comparison of different methodological implementations of voxel-based morphometry in neurodegenerative disease. NeuroImage. 2005;26:600–608. doi: 10.1016/j.neuroimage.2005.02.005. [DOI] [PMC free article] [PubMed] [Google Scholar]
- Shattuck D.W., Leahy R.M. Brainsuite: an automated cortical surface identification tool. Med. Image Anal. 2002;6:129–142. doi: 10.1016/s1361-8415(02)00054-3. [DOI] [PubMed] [Google Scholar]
- Sled J.G., Zijdenbos A.P., Evans A.C. A nonparametric method for automatic correction of intensity nonuniformity in MRI data. Med. Imaging IEEE Trans. 1998;17:87–97. doi: 10.1109/42.668698. [DOI] [PubMed] [Google Scholar]
- Tapiola T., Pennanen C., Tapiola M., Tervo S., Kivipelto M., Hänninen T., Pihlajamäki M., Laakso M.P., Hallikainen M., Hämäläinen A., Vanhanen M., Helkala E.L., Vanninen R., Nissinen A., Rossi R., Frisoni G.B., Soininen H. MRI of hippocampus and entorhinal cortex in mild cognitive impairment: a follow-up study. Neurobiol. Aging. 2008;29:31–38. doi: 10.1016/j.neurobiolaging.2006.09.007. [DOI] [PubMed] [Google Scholar]
- Tustison N.J., Avants B.B., Cook P.A., Zheng Y., Egan A., Yushkevich P.A., Gee J.C. N4ITK: improved N3 bias correction. Med. Imaging IEEE Trans. 2010;29:1310–1320. doi: 10.1109/TMI.2010.2046908. [DOI] [PMC free article] [PubMed] [Google Scholar]
- Tustison N.J., Cook P.A., Klein A., Song G., Das S.R., Duda J.T., Kandel B.M., van Strien N., Stone J.R., Gee J.C., Avants B.B. Large-scale evaluation of ANTs and FreeSurfer cortical thickness measurements. NeuroImage. 2014;99:166–179. doi: 10.1016/j.neuroimage.2014.05.044. [DOI] [PubMed] [Google Scholar]
- van Leemput K., Bakkour A., Benner T., Wiggins G., Wald L.L., Augustinack J., Dickerson B.C., Golland P., Fischl B. Model-based segmentation of hippocampal subfields in ultra-high resolution in vivo MRI. Med. Image Comput. Comput. Interv. 2008;11:235–243. doi: 10.1007/978-3-540-85988-8_29. [DOI] [PMC free article] [PubMed] [Google Scholar]
- Vemuri P., Gunter J.L., Senjem M.L., Whitwell J.L., Kantarci K., Knopman D.S., Boeve B.F., Petersen R.C., Jack C.R.J. Alzheimer's disease diagnosis in individual subjects using structural MR images: validation studies. NeuroImage. 2008;39:1186–1197. doi: 10.1016/j.neuroimage.2007.09.073. [DOI] [PMC free article] [PubMed] [Google Scholar]
- Vemuri P., Simon G., Kantarci K., Whitwell J.L., Senjem M.L., Przybelski S.A., Gunter J.L., Josephs K.A., Knopman D.S., Boeve B.F., Ferman T.J., Dickson D.W., Parisi J.E., Petersen R.C., Jack C.R.J. Antemortem differential diagnosis of dementia pathology using structural MRI: differential-STAND. NeuroImage. 2011;55:522–531. doi: 10.1016/j.neuroimage.2010.12.073. [DOI] [PMC free article] [PubMed] [Google Scholar]
- Voevodskaya O., Simmons A., Nordenskjöld R., Kullberg J., Ahlström H., Lind L., Wahlund L.-O., Larsson E.-M., Westman E. The effects of intracranial volume adjustment approaches on multiple regional MRI volumes in healthy aging and Alzheimer's disease. Front. Aging Neurosci. 2014;6:264. doi: 10.3389/fnagi.2014.00264. [DOI] [PMC free article] [PubMed] [Google Scholar]
- Westman E., Aguilar C., Muehlboeck J.S., Simmons A. Regional magnetic resonance imaging measures for multivariate analysis in Alzheimer's disease and mild cognitive impairment. Brain Topogr. 2013;26:9–23. doi: 10.1007/s10548-012-0246-x. [DOI] [PMC free article] [PubMed] [Google Scholar]
- Whitwell J.L., Josephs K.A., Murray M.E., Kantarci K., Przybelski S.A., Weigand S.D., Vemuri P., Senjem M.L., Parisi J.E., Knopman D.S., Boeve B.F., Petersen R.C., Dickson D.W., Jack C.R. MRI correlates of neurofibrillary tangle pathology at autopsy: a voxel-based morphometry study. Neurology. 2008;71:743–749. doi: 10.1212/01.wnl.0000324924.91351.7d. [DOI] [PMC free article] [PubMed] [Google Scholar]
- Winkler A.M., Kochunov P., Blangero J., Almasy L., Zilles K., Fox P.T., Duggirala R., Glahn D.C. Cortical thickness or grey matter volume? The importance of selecting the phenotype for imaging genetics studies. NeuroImage. 2010;53:1135–1146. doi: 10.1016/j.neuroimage.2009.12.028. [DOI] [PMC free article] [PubMed] [Google Scholar]
- Xia C.-F., Arteaga J., Chen G., Gangadharmath U., Gomez L.F., Kasi D., Lam C., Liang Q., Liu C., Mocharla V.P., Mu F., Sinha A., Su H., Szardenings A.K., Walsh J.C., Wang E., Yu C., Zhang W., Zhao T., Kolb H.C. [(18)F]T807, a novel tau positron emission tomography imaging agent for Alzheimer's disease. Alzheimers Dement. 2013;9:666–676. doi: 10.1016/j.jalz.2012.11.008. [DOI] [PubMed] [Google Scholar]
- Xu Y., Jack C.R., O'Brien P.C., Kokmen E., Smith G.E., Ivnik R.J., Boeve B.F., Tangalos R.G., Petersen R.C. Usefulness of MRI measures of entorhinal cortex versus hippocampus in AD. Neurology. 2000;54:1760–1767. doi: 10.1212/wnl.54.9.1760. [DOI] [PubMed] [Google Scholar]
- Zhang Y., Brady M., Smith S. Segmentation of brain MR images through a hidden Markov random field model and the expectation-maximization algorithm. Med. Imaging IEEE Trans. 2001;20:45–57. doi: 10.1109/42.906424. [DOI] [PubMed] [Google Scholar]
- Zheng W., Chee M.W.L., Zagorodnov V. Improvement of brain segmentation accuracy by optimizing non-uniformity correction using N3. NeuroImage. 2009;48:73–83. doi: 10.1016/j.neuroimage.2009.06.039. [DOI] [PubMed] [Google Scholar]
Associated Data
This section collects any data citations, data availability statements, or supplementary materials included in this article.
Supplementary Materials
Supplementary figures and tables.