

Abstract
MS-based proteomics usually involves the fragmentation of tryptic peptides (tandem MS or MS2) and their identification by searching protein sequence databases. In ion trap instruments fragments can be further fragmented and analyzed, a process termed MS/MS/MS or MS3. Here, we report that efficient ion capture in a linear ion trap leads to MS3 acquisition times and spectra quality similar to those for MS2 experiments with conventional 3D ion traps. Fragmentation of N- or C-terminal ions resulted in informative and low-background spectra, even at subfemtomol levels of peptide. Typically C-terminal ions are chosen for further fragmentation, and the MS3 spectrum greatly constrains the C-terminal amino acids of the peptide sequence. MS3 spectra allow resolution of ambiguities in identification, a crucial problem in proteomics. Because of the sensitivity and rapid scan rates of the linear ion trap, several MS3 spectra per peptide can be obtained even when sequencing very complex mixtures. We calculate the probability that an experimental MS3 spectrum originates from fragmentation of a given N- or C-terminal ion of a peptide under consideration. This MS3 identification score can be combined with the MS2 scores of the precursor peptide from existing search engines. When MS3 is performed on the linear ion trap–Fourier transform mass spectrometer combination, accurate peptide masses further increase confidence in peptide identification.
Keywords: linear quadrupole ion trap, Fourier transform MS, peptide sequencing, protein modification
The identification of proteins by MS is a fundamental issue in proteomics (1). Initially, proteins were identified solely by the measured peptide masses after enzymatic digestion by sequence-specific proteases. Although this mass fingerprinting method works well for isolated proteins, the resulting protein identifications are not sufficiently specific for protein mixtures, where peptide fragmentation by tandem MS (MS2) is currently the method of choice (2–4). Peptide mixtures are resolved by nanoscale liquid chromatography, and peptides are ionized on-line by electrospray (5). Mass spectra are taken every few seconds, followed by isolation of the most intense peptide ions, fragmentation by collisions with an inert gas, and finally the recording of a mass spectrum of the fragments. This fragment mass spectrum, also termed MS/MS spectrum, tandem mass spectrum, or MS2 spectrum, consists mainly of N- and C-terminal fragments of the peptide ions at the amide bonds, called b ions and y ions, respectively (6, 7). Unfortunately, the sequence of the peptide cannot easily be derived from the fragmentation spectrum. Instead, algorithms have been developed to match these spectra to sequence databases (8–10). For each MS2 spectrum, a list of peptides with associated scores is returned. Peptide identification is one of the cornerstones of proteomics; however, the reliability of these identifications continues to be controversial, especially in the very large data sets that can be produced by modern mass spectrometers (11–13). For example, Keller et al. (14) and Peng et al. (15) have shown that commonly used scoring criteria for ion trap data and the popular sequest database searching program (9) can result in a large percentage of misidentified proteins (as large as 25% or more). Very high scoring thresholds, on the other hand, lead to very low error rates but discard most true peptide hits. Great progress has been made recently in statistical analysis of protein identification by MS2, which now allows estimation of false-positive and false-negative rates in any data set (11, 16, 17), without, however, increasing the confidence in the identification of any given peptide.
To improve peptide identification, the mass of the precursor ion (MS1 mass) can be measured more accurately or additional stages of mass spectrometric fragmentation (MSn) can be acquired. Very high mass accuracy is only available from specialized types of mass spectrometers, but compact ion trap instruments are capable of additional rounds of fragmentation. Just as one stage of MS2 provides more information than the molecular mass alone, additional stages provides further information on the fragments (18–21). Even though the signal decreases in every stage of MS2, the signal-to-noise ratio increases, and additional information about the structure of the analyte ion is obtained (22). Ion traps have been used for the structural analysis of small molecules by several stages of MS. In the proteomics field only MS2 has been widely applied because ion traps previously could not be filled with a number of ions sufficient to allow recording of a spectrum after several stages of fragmentation and because MS/MS/MS (MS3) was too slow to be performed on a time scale compatible with chromatographic separation. Furthermore, no algorithms that incorporate MS3 information in peptide identification have been available, although an algorithm for the use of MS3 information in de novo sequencing has been reported (23).
Here, we use a linear ion tap with greatly increased capture efficiency and storage capacity compared to conventional, 3D ion traps (24). We demonstrate sensitive and rapid MS3 and describe an algorithm that scores MS3 spectra to peptide fragment sequences and thereby significantly increases confidence in peptide identification.
Materials and Methods
Mouse Liver Cytosolic Protein Preparation. A crude mouse liver protein fraction was obtained from an ongoing experiment in our laboratory (kindly supplied by L. Foster, Center for Experimental BioInformatics) and was prepared as described (12). The cytosolic fraction was harvested from contaminating subcellular organelles by high-speed centrifugation through a sucrose gradient and collected in fractions. The protein fractions were precipitated by dilution with 5× excess of absolute ethanol, and protein concentration was determined by Bradford assay (Bio-Rad).
In-Solution Digestion. One milligram of lyophilized BSA (Sigma-Aldrich) or alternatively 190 μg of mouse liver cytosolic protein pellet was resolubilized in a buffer containing 6 M urea (Invitrogen) and 2 M thiourea (Fluka) and reduced, alkylated, and digested essentially as described (25). To reduce disulfide bonds 100 mM DTT was added to a final concentration of 10 mM in the protein solutions and incubated for 1 h at 56°C in the dark. The free thiol (–SH) groups were subsequently alkylated with iodoacetamide (50 mM final concentration) for 30 min at room temperature.
The reduced and alkylated protein mixtures were digested with endoproteinase Lys-C (Wako Biochemicals, Osaka, wt/wt 1:50) for 4 h and with sequence grade-modified trypsin (Promega, wt/wt 1:50) for 8 h at 37°C after dilution to 1.5 M urea with 50 mM NH4HCO3, pH 8.0. Proteolysis was quenched by acidification of the reaction mixtures with glacial acetic acid. Finally, the resulting peptide mixtures were desalted on RP-C18 STAGE tips as described (26) and diluted in 0.1% trifluoroacetic acid for nano-HPLC-MS analysis.
Nano-HPLC-MS2 and Data Analysis. All nano-HPLC-MS2-experiments were performed on a Agilent 1100 nanoflow system connected to a 7-Tesla Finnigan linear quadrupole ion trap-Fourier transform (LTQ-FT) mass spectrometer (Thermo Electron, Bremen, Germany) equipped with a nanoelectrospray ion source (Proxeon Biosystems, Odense, Denmark) as described (12) with a few modifications. Briefly, the mass spectrometer was operated in the data-dependent mode to automatically switch between MS, MS2, and MS3 acquisition. Survey full-scan MS spectra (m/z 300–1,500) were acquired in the Fourier transform ion cyclotron resonance (FT ICR) with resolution R = 25,000 at m/z 400 (after accumulation to a target value of 10,000,000 in the linear ion trap). The three most intense ions were sequentially isolated for accurate mass measurements by a FT ICR-selected ion monitoring (SIM) scan with 10-Da mass range, R = 50,000 and target accumulation value of 50,000. These were then fragmented in the linear ion trap by using collisionally induced dissociation at a target value of 5,000. For MS3, up to three ions in each MS2 spectra (the most intense ions with m/z >300) were further isolated and fragmented. Former target ions selected for MS2 were dynamically excluded for 30 s. Total cycle time was ≈3 s. The general mass spectrometric conditions were: spray voltage, 2.4 kV; no sheath and auxiliary gas flow; ion transfer tube temperature, 100°C; collision gas pressure, 1.3 mTorr; and normalized collision energy, 30% for MS2 and 28% for MS3. Ion selection thresholds were: 500 counts for MS2 and 50 counts for MS3. An activation q = 0.25 and activation time of 30 ms was applied in both MS2 and MS3 acquisitions.
Peptides and proteins were identified via automated database searching (Matrix Science, London) of all MS2 against an in-house curated version of the Mouse International Protein Index protein sequence database (versions 2.18, 40,402 protein sequences, www.ebi.ac.uk/IPI) containing all mouse protein entries from Swiss-Prot, TrEMBL, RefSeq, and Ensembl as well as frequently observed contaminants, porcine trypsin, achromobactor protease I (lysyl endoproteinase), and human keratins. Spectra were normally searched with a mass tolerance of 3 ppm and strict trypsin specificity. However, to simulate ion trap-only conditions loose search parameters were applied as follows: MS tolerance 0.25 and MS2 tolerance 0.5 Da, semitryptic specificity allowing for up to two missed cleavages; fixed modification: carbamidomethylation of cysteine; variable modification: oxidation of methionine and protein N-acetylation.
Automatic MS3 Spectra Score and Validation. MS3 spectra were automatically scored with a modified version of msquant, open-source software available at http://msquant.sourceforge.net. The msquant software is a validation tool that parses out the mascot peptide identifications and allows manual verification against the raw MS data (LTQ-FT raw files). The MS3 scoring algorithm described in the text was integrated into msquant and is also freely available under public license.
Results and Discussion
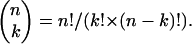
Linear ion traps have greatly increased ion storage capacities compared to standard 3D ion traps (24, 27), which should make it possible to routinely perform an additional step of MS2.Totest this possibility, we enzymatically digested standard proteins and a centrifugation fraction of homogenized mouse liver and analyzed them by HPLC/MS3 on a linear ion trap (Finnigan LTQ, ThermoElectron, San Jose, CA). Fig. 1a shows the mass spectrum (MS1 spectrum) of the peptides eluting at 99.27 min in the LC gradient of the separation of mouse liver peptides. Isolation and fragmentation in the LTQ resulted in the MS2 spectrum shown in Fig. 1b. The y5 ion and the b8 ions were separately isolated, collisionally activated, and mass analyzed. Fig. 1 c and d is marked with the MS3 fragment ions. Note that y ions have the same chemical structure as peptide ions, except that they are N-terminally truncated by one or more amino acid residues. Consequently, they give rise to the same ion types upon further fragmentation, mainly b and y ions. The MS3 y ions derived from y-ion fragmentation are at the same m/z values as the y ions in the MS2 spectrum. The b ions are offset to lower mass values by the sum of the N-terminal amino acids of the peptide that are not contained in the y-precursor ion plus the mass of the peptide N terminus if it is modified. We designate these offset or moving b ions in the MS3 spectrum b̂ (pronounced b hat).
Fig. 1.

Overview of MS3 analysis in the LTQ-FT. (a) MS1 full scan acquired in the FT ICR cell for a high dynamic range survey of the total mass range. (Inset) SIM FT ICR–MS1 experiment of a precursor from the survey scan to obtain low-ppm mass accuracy. (b) MS2 scan. The precursor ion is isolated and fragmented in the linear ion trap to obtain sequence information. (c) MS3 scan. The b8 ion derived from MS2 is isolated and fragmented further. (d) MS3 scan of the y5 ion.
The peptide C terminus is absent in b ions, therefore y ions originating from b-ion fragmentation (which we designate ŷ), have the mass of internal fragments, that is the added amino acid residue masses plus the proton mass. MS3 ŷ ions are offset from the y ions in the tandem mass spectra by the sum of the amino acids not contained in the b-precursor ion plus the mass of the C terminus (mass of OH for unmodified peptides). In this designation, the stationary b and y ions have the same name, m/z, and chemical nature in MS2 and MS3 spectra, whereas b̂ and ŷ ions do not contain the original N or C terminus of the peptide but are the middle product of the two cleavages of the peptide sequence. They are equivalent to the internal cleavage products sometimes observed at low intensity in MS2 spectra.
The most intense fragment ions of doubly or triply charged tryptic peptide are usually y ions in the range of 500 to 900 Da, and they contain the C-terminal 4–8 amino acids of the peptide. However, b ions in this mass range may also be picked for sequencing. Inspection of hundreds of spectra of such ions revealed that they typically have low background and therefore a high signal-to-noise ratio, a principal advantage of MSn, which tends to decrease background faster than analyte-related fragments at every fragmentation step. The trapping and fragmentation potentials used in the LTQ are only capable of containing fragment ions larger than 1/3 of the fragmented m/z value. Therefore, the y1 and the characteristic a2,b2 ion pair are often missing from the spectra. However, the y-ion series from y-ion precursors are usually among the most intense ions and several b ions may also be apparent, suggesting very information-rich spectra. This has also been the conclusion of Zhang et al. (28) who have studied the ion trap fragmentation of singly charged peptide ions produced by matrix-assisted laser desorption/ionization (MALDI). That situation is analogous to the fragmentation of y ions in our system, which are also usually singly charged and should have the same characteristics as MALDI ions after collisional cooling in the ion trap. These researchers noted that, despite facile cleavage at preferred sites, these fragmentation spectra were sufficient for extensive manual de novo sequence interpretation if the signal-to-noise ratio was sufficiently high. Recent progress in modeling fragmentation peptide events (29–31) may further help in the interpretation of MS3 spectra.
MS3 Spectra at Low Sample Amount. To test whether it was possible to obtain MS3 spectra at high sensitivity, we loaded 0.5 fmol of a BSA digest on column and performed MS3 analysis. As shown in Fig. 2, excellent signal-to-noise spectra were obtained with accumulation of peptide precursor for only 250 ms. Since most analysis of peptide mixtures is performed in the femtomol range of peptide loaded on the column, routine MS3 analysis is very feasible from a sensitivity standpoint.
Fig. 2.

MS3 at high sensitivity. (a) FT ICR SIM-MS1 spectra of two tryptic BSA peptides from a 0.5-fmol injection on-column. Fill time refers to the ion accumulation time in the linear ion trap. (b) MS2 fragmentation spectra of the two peptides, LVTDLTK and LVVVSTQTALA. (c) MS3 spectra of a selected fragment from each peptide, y5 (TDLTK) and b6 (LVVSTQ), respectively. For fragmentation symbols see ref. 19.
MS3 Acquisition Cycle on a Combined Ion Trap FT Instrument. The MS3 fragmentation will be most useful for increasing confidence in peptide identification for low mass accuracy, low-resolution ion trap instruments. However, the combined LTQ-FT mass spectrometer used in these experiments allows accumulation and fragmentation in the linear ion trap section at the same time as ions are analyzed in the FT ICR (Penning trap) (32). We routinely analyze complex mixtures by taking a survey MS1 spectrum of the whole mass range in the FT ICR part, followed by SIM MS1 scans at high resolution and mass accuracy (12). While the signals for a particular m/z are acquired by SIM FT ICR detection, the ion trap accumulates the same precursor ion and obtains the MS2 spectrum. Normally, this would be followed by idle time in the LTQ, while the FT still acquires the SIM spectrum. In the scheme depicted in Fig. 3, we used this time slot to obtain one or more MS3 scans before the next SIM and MS2 scans. Since the fill times for MS2 or MS3 spectra are shorter than the times required for measuring the SIM scan (see accumulation times in Fig. 2), the MS3 scan takes away little or no time from the sequencing of new precursors if one or two MS3 spectra are obtained per MS2 spectrum, at least for the acquisition scheme used in this experiment. However, in the analysis of very complex mixtures, the addition of an MS3 step could decrease the number of total MS2 spectra acquired. In the analysis of the complex mixture of mouse liver peptides, fill times for the MS3 experiment were typically ≈1 ms, much smaller than the ion activation times (two times 30 ms) and the scan times (≈50 ms). This finding suggests that many more MS3 scans could be acquired if ion activation times were shortened, faster scan times were used, and remaining electronic delay times were eliminated.
Fig. 3.

LTQ-FT MS3 optimized scan cycle. Scan times and set-up for complex peptide mixture identification by MS3. The LTQ-FT mass spectrometer is a dual instrument with two independent detection systems (FT ICR and LTQ), which can be operated simultaneously. The peptide precursors analyzed by SIM in the FT ICR are fragmented simultaneously in the LTQ by MS2 and MS3. No additional dead time is introduced by the MS3 scan.
MS3 Spectra Increase Confidence in Database Identifications. Fig. 4a shows the MS2 spectrum of a mouse liver peptide. The mass spectrum had been searched with mass tolerance typical of ion trap instruments and also without requiring strict tryptic cleavage by using the mascot search engine (10). Under these conditions, the peptide IEFGVDEVIE was the top match closely followed by the peptide IFVWDWQR. The peak matched as the b8 and y6 fragment of the two sequences, respectively, was subjected to MS3. As seen in Fig. 4b, the full series of b̂ ions and the y3 and y4 ions were matched, assuming that the precursor was the y5 ion of the second-highest-scoring peptide sequence. Furthermore, the prominent y3 ion is easily explained as facile cleavage C terminal to acidic residues (in this case glutamic acid) of singly charged ions in ion traps (33). The fragment derived assuming the top mascot score, however, only matched the same y4 ion that was already matched in the MS2 spectrum. In this case, accurate mass measurement had already identified the correct peptide match (see Fig. 4). However, accurate mass measurement is not available on many instruments, and low mass accuracy combined with loose criteria for trypsin specificity would have led to misidentification of the peptide had MS3 not been used.
Fig. 4.

MS3 spectra increase identification specificity. (a) HPLC-MS2 spectrum of doubly charged peptide ion at m/z 575.29 from a complex liver sample. (Inset) FT ICR SIM scan of precursor ion. The peak assignments of the b- and y-ion peaks of the top-ranked peptide match (IEFGVDEVIE) are in gray. Ions matching the second-ranked peptide (IFVWDWQR) are indicated in black. (b) MS3 spectrum of the most intense ion from the MS2 spectrum at m/z 889.4 supports the second and not the first peptide, in agreement with the accurate mass values.
An Algorithm to Identify Peptides by MS3 Spectra. Several different algorithmic approaches have been developed for matching fragmentation spectra to their cognate sequences in protein databases. However, no database searching programs have been described for matching MS3 ions.
Since MS3 fragmentation spectra are relatively simple, we directly calculated a probability for a given peptide MS3 spectrum to match a given fragment ion sequence in the following way. First, the mass list was reduced to the top four fragments per 100 Da. We derived this value empirically but also note that a recent and highly efficient algorithm for spectrum, spectrum matching, uses a value of four signals per 100 Da (34), suggesting that this is a good balance between retaining significant ions and discriminating against background. We then calculated the b and ŷ ion masses in the case of putative b-ion precursors or b̂ and y ions in the case of putative y-ion precursors and determined the number of matches, k. Then the probability P of obtaining k random matches between calculated and measured MS3 peaks is a measure of the significance of the fragment under consideration and can be obtained by simple statistics. It is the same as the probability of obtaining k successful events, each with probability P, with a total number of n tries:
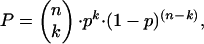 |
where n over k is the number of permutations of a subset of k elements in a set of n elements
 |
The probability of a calculated fragment, p, to match one of the experimental masses by chance is simply 4/100 or 0.04, independently of the mass range considered, because we allow four measured masses per 100 Da. n is the number of calculated fragments in the mass range under consideration.
As an example, we consider the case in Fig. 4b. We calculate the four most intense signals per 100 Da in the mass range 250 to 870. We then calculate the masses of the fragments of the putative b8-precursor ion of sequence IEFGVDEV of which the b3 to b7 and the y2 to y5 ions are in the mass range of the spectrum (n = 9). There is only one match (k = 1), for the y4 ion, and the probability for this to be a random match is 9 × 0.04 × 0.968 = 0.26, so this single MS3 fragment match is not statistically significant. For the correct fragment, the y6 precursor of sequence VWDWQR, however, k = 6 and P = 3 × 10⁻⁷, so this match is highly significant. In fact, this significance value is not far from that of a completely de novo-derived sequence of six amino acids. In this case, P = 1/(186) = 3 × 10⁻⁸, which is the likelihood to determine the sequence correctly by chance (recognizing that there are only 18 distinguishable amino acids within the mass accuracy of an ion trap).
We have expressed the likelihood for random match as –10 × log(P), to make them comparable to the output of the mascot search engine (10). The algorithm used in mascot is not published but also involves probability-based matching. Therefore, the total probability of the MS2 and the MS3 matches to be incorrect should be the product of the probabilities of the mascot and the MS3 score calculated here, and the combined score should be the sum of the scores since they are expressed as logarithms. However, we caution that the MS2 and MS3 scores need not be completely independent. For example, a random match may erroneously label a series of low-mass y ions. Since these ions may not move upon MS3 fragmentation, they could contribute to the score in both the MS2 and MS3 spectra. We also note that the MS3 scoring is against a single sequence or a few sequences and does not involve a database search. The MS3 mass range is frequently relatively small and the spectra quite information rich, to the point of allowing partial de novo sequencing of the sequence. These factors combine to make the MS3 score for correct matches statistically highly significant.
We have integrated the algorithm to calculate the MS3 score into msquant, an open source MS validation and quantification software written in-house. Here, we have combined the MS3 score with output of the mascot search engine, but it can in principle be combined with the output of any other MS2 search engines, too. If the output of those search engines is not a probability, then the two scores can be combined in more sophisticated fashion, as for example, demonstrated in ref. 14. It should also be possible to combine the information in the MS2 and MS3 spectra directly, making use of the fact that one ion series remains stationary, whereas the other ion series moves by the mass difference between peptide precursor and fragment mass.
Application to Complex Peptide Mixtures. To obtain a statistical overview of MS3 fragmentation in complex peptide mixtures, we analyzed all of the peptides sequenced in the mouse liver nano-HPLC MS3 experiment by either high-stringency or low-stringency database search. For the high-stringency search, requiring mass deviations of no more than 5 ppm and fully tryptic peptides, Table 2, which is published as supporting information on the PNAS web site, lists all of the measured peptides, their sequences as well as the fragment types selected for further sequencing and the score added by MS3 matching. Inspection of ≈2,000 such peptides in Table 2 reveals that there were generally one or two MS3 events per peptide that led to successful matching against the expected part for the sequence. In ions with a low mascot score, MS3 events often did not target b or y ions predicted from the peptide sequence, or else the MS3 spectrum did not yield significant matches. As mentioned above almost all precursors were singly charged y ions (79%), but doubly charged y ions and b ions also occurred. Not unexpectedly, y ions with N-terminal prolines were frequently picked for MS3 sequencing, since they are often the dominant fragment ion in proline-containing peptides. A summary of MS3 fragment ion types is given in Table 1.
Table 1. MS2 and MS3 statistics from complex mixture analysis.
| Single LC-MS3 of complex mouse liver preparation | |
| Identified IT-MS2 spectra by mascot | 2,972 |
| Assigned and scored MS3 spectra by msquant | 2,365 |
| b ions fragmented | 400 |
| y ions fragmented | 1,965 |
| [proline-directed y ions] | 367 |
| [doubly-charged y ions] | 135 |
| 10 different LC-MS3 experiments combined | |
| Identified IT-MS2 spectra by mascot | 11,311 |
| Assigned and scored MS3 spectra by msquant | 8,127 |
| b ions fragmented | 1,584 |
| y ions fragmented | 6,543 |
In Fig. 5a, we have plotted the distribution of mascot search scores and the distribution of combined mascot results with the best MS3 scores for each peptide. The mascot scores show the typical distribution with many peptides close to cut-off and a rapid decrease to higher values. Only 20% of the peptides score >50. The combined MS2 and MS3 score, however, has a broad distribution extending beyond scores of 100. More than 70% of the peptides are above a combined score of 50. In effect, a large proportion of the peptides is now identified with near certainty. Peptides that remain at their original location may be misidentifications, particularly the peptides close to the cut-off of 15. For some of the peptides with relatively high mascot scores, no MS3 score exists because the acquisition software for a variety of reasons did not select b or y ions for further fragmentation. We note that a number of proteins were identified with single peptides, as is typical of the analysis of very complex mixtures. These proteins are often discarded, because a protein based on a single peptide match may not be significant. Many of these single peptide hits can be rescued by MS3, which tends to independently confirm the C-terminal sequence of the single peptide.
Fig. 5.

Distributions of mascot peptide scores and distributions of combinedmascot score with MS3 score. (a) mascot peptide scores (binned in decades) from a high-stringency mascot search (tryptic constrains and 5-ppm mass accuracy of precursor ion) are shown in gray bars. The black bars indicate the distributions of mascot results combined with the best MS3 scores for each peptide. (b) Same as a but with results of a low-stringency mascot search (half-tryptic peptides allowed and 0.25-Da mass accuracy of precursor ion). Note that the number of high-scoring peptides caused by combined MS2 and MS3 score is very similar in the high- and low-stringency cases. (c) Subtraction of tryptic from semitryptic peptides, showing that essentially all peptides verified by MS3 were fully tryptic.
Finally, in Fig. 5b we have plotted simulated ion trap only results by searching the data with relatively poor mass accuracy (0.25 Da for the precursor) and requiring tryptic peptide specificity only for one terminus of the peptide (Table 3, which is published as supporting information on the PNAS web site). Under these conditions, many more MS2 spectra match a peptide sequence and the number of false positives is much higher than before. Note that there are many more peptides with marginal scores. It has been shown that score distributions under such conditions can be modeled by two curves, of correct and incorrect matches, respectively (14). Adding the MS3 scores leads to essentially the same distribution as the combined distribution in Fig. 5a, whereas the peptides matched with relaxed mass accuracy and semitryptic peptide specificity are not supported by MS3 scores (Fig. 5b and Table 2). This finding is also in agreement with a recent report by our group, which found that nontryptic or semitryptic peptides are very rare occurrences, and usually the product disintegration of tryptic peptide in solution or in the source of the mass spectrometer (12). Comparison of the shifts between the MS2 only and the combined MS2 and MS3 distributions in Fig. 5 demonstrates that an additional step of MS3 is even more effective, on average, than a highly accurate mass, in enhancing confidence in peptide identification. The highest confidence, of course, is obtained by both MS3 and accurate mass determination.
Since initial testing of the MS3 procedure and algorithm, we have routinely used it in our laboratory. Table 1 summarizes the analysis of >10,000 peptides with a variety of different acquisition schemes. The results show that the MS3 procedure is robust and yields added information, that is, increased peptide identification scores, for almost all peptides.
Conclusion
In summary, we have shown that a second step of peptide fragmentation, MS3, is both practical and informative when carried out on a linear ion trap with high capture efficiency and ion storage capacity. MS3 can be performed at subfemtomol sensitivity while still involving only relatively short ion accumulation times of <1 s. A statistical score for MS3 fragment spectra revealed highly significant fragment matches for correct but not for incorrect peptide matches. An MS3 step can readily be integrated into the acquisition cycle in complex peptide mixture, and our data show that this is highly desirable for low-mass accuracy instruments such as linear ion traps. For high-mass accuracy instruments, such as the linear ion trap–FT MS combination, the added certainty in peptide identification will also in most cases outweigh the fact that fewer M2 spectra can be acquired. Intelligent, real-time decisions on which peptides to perform MS3 on would clearly allow the greatest depth of proteomic analysis.
Supplementary Material
Acknowledgments
We thank Dr. L. Foster for providing the mouse liver sample and other members of the Center for Experimental BioInformatics for constructive comments and discussion. The Center for Experimental BioInformatics is supported by a generous grant by the Danish National Research Foundation. The LTQ-FT was a kind loan of the Max Plank Institute for Biochemistry, Martinsried, Germany.
Abbreviations: FT ICR, Fourier transform ion cyclotron resonance; LTQ, linear quadrupole ion trap; MS2, tandem MS; MS3, MS/MS/MS; SIM, selected ion monitoring.
References
- 1.Aebersold, R. & Mann, M. (2003) Nature 422, 198–207. [DOI] [PubMed] [Google Scholar]
- 2.Peng, J. & Gygi, S. P. (2001) J. Mass Spectrom. 36, 1083–1091. [DOI] [PubMed] [Google Scholar]
- 3.Lin, D., Tabb, D. L. & Yates, J. R., III (2003) Biochim. Biophys. Acta 1646, 1–10. [DOI] [PubMed] [Google Scholar]
- 4.Patterson, S. D. & Aebersold, R. H. (2003) Nat. Genet. 33, Suppl., 311–323. [DOI] [PubMed] [Google Scholar]
- 5.Fenn, J. B., Mann, M., Meng, C. K., Wong, S. F. & Whitehouse, C. M. (1989) Science 246, 64–71. [DOI] [PubMed] [Google Scholar]
- 6.Roepstorff, P. & Fohlman, J. (1984) Biomed. Mass Spectrom. 11, 601. [DOI] [PubMed] [Google Scholar]
- 7.Biemann, K. (1990) Methods Enzymol. 193, 886–887. [DOI] [PubMed] [Google Scholar]
- 8.Mann, M. & Wilm, M. S. (1994) Anal. Chem. 66, 4390–4399. [DOI] [PubMed] [Google Scholar]
- 9.Eng, J. K., McCormack, A. I. & Yates, J. R. (1994) J. Am. Soc. Mass Spectrom. 5, 976–989. [DOI] [PubMed] [Google Scholar]
- 10.Perkins, D. N., Pappin, D. J., Creasy, D. M. & Cottrell, J. S. (1999) Electrophoresis 20, 3551–3567. [DOI] [PubMed] [Google Scholar]
- 11.Nesvizhskii, A. I., Keller, A., Kolker, E. & Aebersold, R. (2003) Anal. Chem. 75, 4646–4658. [DOI] [PubMed] [Google Scholar]
- 12.Olsen, J. V., Ong, S. E. & Mann, M. (2004) Mol. Cell Proteomics 3, 608–614. [DOI] [PubMed] [Google Scholar]
- 13.Steen, H. & Mann, M. (2004) Nat. Rev. Mol. Cell. Biol., 5, 699–711.. [DOI] [PubMed] [Google Scholar]
- 14.Keller, A., Nesvizhskii, A. I., Kolker, E. & Aebersold, R. (2002) Anal. Chem. 74, 5383–5392. [DOI] [PubMed] [Google Scholar]
- 15.Peng, J., Elias, J. E., Thoreen, C. C., Licklider, L. J. & Gygi, S. P. (2003) J. Proteome Res. 2, 43–50. [DOI] [PubMed] [Google Scholar]
- 16.Anderson, D. C., Li, W., Payan, D. G. & Noble, W. S. (2003) J. Proteome Res. 2, 137–146. [DOI] [PubMed] [Google Scholar]
- 17.MacCoss, M. J., Wu, C. C. & Yates, J. R., III (2002) Anal. Chem. 74, 5593–5599. [DOI] [PubMed] [Google Scholar]
- 18.Schey, K. L., Schwartz, J. C. & Cooks, R. G. (1989) Rapid Commun. Mass Spectrom. 3, 305–309. [Google Scholar]
- 19.Schwartz, J. C., Wade, A. P., Enke, C. G. & Cooks, R. G. (1990) Anal. Chem. 62, 1809–1818. [DOI] [PubMed] [Google Scholar]
- 20.Lin, T. & Glish, G. L. (1998) Anal. Chem. 70, 5162–5165. [DOI] [PubMed] [Google Scholar]
- 21.Marshall, A. G., Hendrickson, C. L. & Jackson, G. S. (1998) Mass Spectrom. Rev. 17, 1–35. [DOI] [PubMed] [Google Scholar]
- 22.Cooks, R. G., Busch, K. L. & Glish, G. L. (1983) Science 222, 273–291. [DOI] [PubMed] [Google Scholar]
- 23.Zhang, Z. & McElvain, J. S. (2000) Anal. Chem. 72, 2337–2350. [DOI] [PubMed] [Google Scholar]
- 24.Schwartz, J. C., Senko, M. W. & Syka, J. E. (2002) J. Am. Soc. Mass Spectrom. 13, 659–669. [DOI] [PubMed] [Google Scholar]
- 25.Foster, L. J., De Hoog, C. L. & Mann, M. (2003) Proc. Natl. Acad. Sci. USA 100, 5813–5818. [DOI] [PMC free article] [PubMed] [Google Scholar]
- 26.Rappsilber, J., Ishihama, Y. & Mann, M. (2003) Anal. Chem. 75, 663–670. [DOI] [PubMed] [Google Scholar]
- 27.Hager, J. W. (2002) Rapid Commun. Mass Spectrom. 16, 512–526. [Google Scholar]
- 28.Zhang, W., Krutchinsky, A. N. & Chait, B. T. (2003) J. Am. Soc. Mass Spectrom. 14, 1012–1021. [DOI] [PubMed] [Google Scholar]
- 29.Tsaprailis, G., Nair, H., Zhong, W., Kuppannan, K., Futrell, J. H. & Wysocki, V. H. (2004) Anal. Chem. 76, 2083–2094. [DOI] [PMC free article] [PubMed] [Google Scholar]
- 30.Tabb, D. L., Huang, Y., Wysocki, V. H. & Yates, J. R., III (2004) Anal. Chem. 76, 1243–1248. [DOI] [PMC free article] [PubMed] [Google Scholar]
- 31.Zhang, Z. (2004) Anal. Chem. 76, 3908–3922. [DOI] [PubMed] [Google Scholar]
- 32.Syka, J. E. P., Marto, J. A., Bai, D. L., Horning, S., Senko, M. W., Schwartz, J. C., Ueberheide, B., Garcia, B., Busby, S., Muratore, T., et al. (2004) J. Proteome Res. 3, 621–626. [DOI] [PubMed] [Google Scholar]
- 33.Krutchinsky, A. N., Kalkum, M. & Chait, B. T. (2001) Anal. Chem. 73, 5066–5077. [DOI] [PubMed] [Google Scholar]
- 34.Beer, I., Barnea, E., Ziv, T. & Admon, A. (2004) Proteomics 4, 950–960. [DOI] [PubMed] [Google Scholar]
Associated Data
This section collects any data citations, data availability statements, or supplementary materials included in this article.