Significance
Skeletal diseases place a huge burden on patients and society, and yet their genetic basis remains poorly understood. In this article, we identify Speckle-type POZ protein (Spop) as a regulator of skeletal development, loss of which leads to shorter digit bones and lower bone density. We also show that, in striking contrast to the current dogma positing Spop as a negative regulator of Hedgehog (Hh) signaling, Spop regulates skeletal development by promoting Indian Hedgehog (Ihh) signaling. Therefore, our work represents an important conceptual advance in the understanding of Ihh signaling and skeletal development and provides a potential new target for the diagnosis and intervention of bone diseases such as osteoporosis.
Keywords: endochondral ossification, Gli3, ubiquitin ligase, skeletal development, osteoporosis
Abstract
Indian Hedgehog (Ihh) regulates chondrocyte and osteoblast differentiation through the Glioma-associated oncogene homolog (Gli) transcription factors. Previous in vitro studies suggested that Speckle-type POZ protein (Spop), part of the Cullin-3 (Cul3) ubiquitin ligase complex, targets Gli2 and Gli3 for degradation and negatively regulates Hedgehog (Hh) signaling. In this study, we found defects in chondrocyte and osteoblast differentiation in Spop-null mutant mice. Strikingly, both the full-length and repressor forms of Gli3, but not Gli2, were up-regulated in Spop mutants, and Ihh target genes Patched 1 (Ptch1) and parathyroid hormone-like peptide (Pthlh) were down-regulated, indicating compromised Hh signaling. Consistent with this finding, reducing Gli3 dosage greatly rescued the Spop mutant skeletal defects. We further show that Spop directly targets the Gli3 repressor for ubiquitination and degradation. Finally, we demonstrate in a conditional mutant that loss of Spop results in brachydactyly and osteopenia, which can be rescued by reducing the dosage of Gli3. In summary, Spop is an important positive regulator of Ihh signaling and skeletal development.
The human skeleton provides essential mechanical support, mobility, and mineral storage critical for health (1). In development, most bones form through endochondral ossification in which chondrocytes in the growth plate proliferate, undergo hypertrophic differentiation, and secrete calcium-containing extracellular matrix (2). The osteoblasts in the perichondrium, a thin layer of tissue surrounding the cartilage, replace the dying chondrocytes and secrete more bone matrix. On the other hand, osteoclasts, derived from white blood cells, invade and digest bone matrix. The balance between the osteoblast and osteoclast activities allows calcium homeostatic control and bone health. In osteopenia and osteoporosis, conditions afflicting more than 10 million Americans, an abnormal decrease in osteoblast activity or increase in osteoclast activity results in the loss of bone mass (1, 3). Unfortunately, our understanding of these bone diseases has been hindered by incomplete knowledge in the molecular mechanisms underlying endochondral bone development and remodeling.
Indian Hedgehog (Ihh), a member of the Hedgehog (Hh) family of signaling proteins, is essential for endochondral bone development (4). Ihh regulates gene expression through the Gli family of transcription factors, which act as both transcriptional activators and repressors (5). In the absence of Hh, efficient proteolytic processing turns Gli3 into a transcriptional repressor (Gli3R) whereas processing of Gli2 is rather inefficient (6–8). Hh inhibits Gli processing and converts the full-length Gli proteins into transcriptional activators. Both Gli2 and Gli3 play important roles in the regulation of bone formation downstream of Ihh (9–12).
Ihh maintains the expression of parathyroid hormone-like peptide (Pthlh) (Mouse Genome Informatics) in the periarticular perichondrium (13), which then stimulates the proliferation and delays the hypertrophic differentiation of chondrocytes, in part through Gli3R (14, 15). Ihh also promotes chondrocyte proliferation (13, 16) and hypertrophic differentiation through Pthlh-independent mechanisms (17). In addition, Ihh signaling is required in the perichondrium for osteoblast differentiation and bone formation (4, 12).
Speckle-type POZ protein (Spop) is the substrate-recognition subunit of a Cullin-Ring E3 ubiquitin ligase that targets mammalian Gli2 and the full-length form of Gli3 (Gli3FL) for ubiquitination and degradation in vitro (18–21). The Spop homolog in Drosophila, known as hib or rdx, also mediates the degradation of Ci, the sole Gli family member in flies, and inhibits Hh signaling (22, 23). Overexpression of Spop in Xenopus similarly reduces Hh pathway activation (24). An Spop mutant mouse strain was analyzed previously, but defects only in endocrine pancreas were reported (25). Another Speckle-type POZ protein, Spop-like (Spopl), exhibits similar substrate specificity and similar, albeit somewhat weaker, ubiquitination activity as Spop (26). Its in vivo biological function has not been studied.
Here, we report that loss of Spop, but not Spopl, disrupts chondrocyte hypertrophy and osteoblast differentiation in the mouse, suggesting the requirement for Spop-mediated protein degradation in mouse skeletal development. Surprisingly, loss of Spop results in an increase in the level of Gli3R and a decrease in Ihh signaling. Consistent with this in vivo observation, we find that overexpressed Spop targets both Gli3FL and Gli3R for ubiquitination and degradation. Supporting the role of increased Gli3R in Spop mutant phenotype, reducing the dosage of Gli3 restores normal Ihh signaling and endochondral ossification. Finally, we show that limb mesenchyme-specific loss of Spop results in shorter distal limb bones and lower bone density in the adults, which can be rescued by reducing the dosage of Gli3.
Results
Spop, but Not Spopl, Is Required for Normal Skeletal Development.
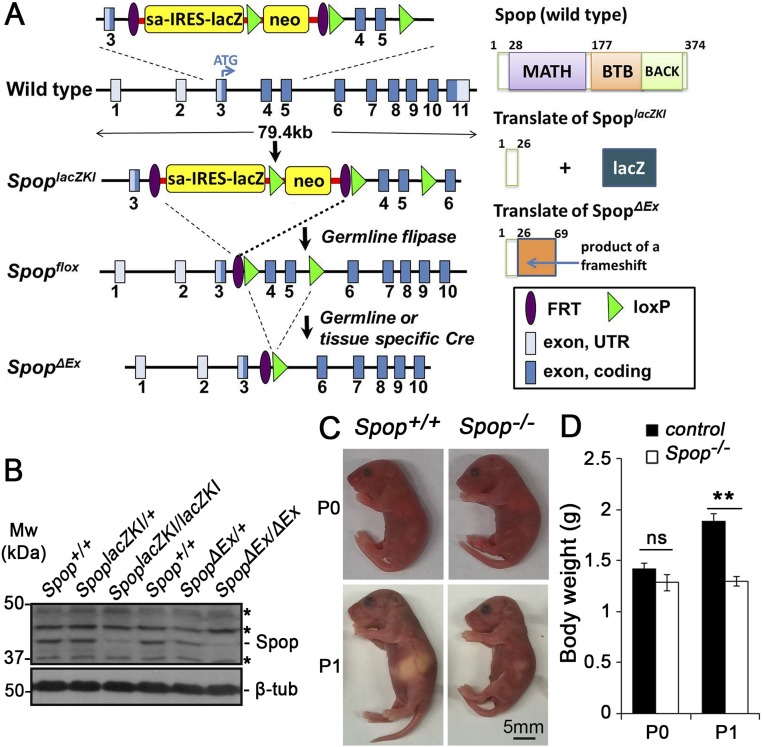
To determine the requirement for Spop in development, we characterized two Spop mutant mouse strains (Fig. S1A). The first strain, Spoptm1a(KOMP)Mbp, or SpoplacZKI, contained a bacterial β-galactosidase (lacZ) reporter in the third intron of Spop, which was predicted to terminate Spop transcription after the third exon. The removal of the fourth and fifth exons of Spop in the second strain, Spop∆Ex, similarly truncated the Spop protein after exon 3 due to a frameshift (Fig. S1A). Both alleles were likely null because the predicted protein products lacked the entire POZ (Cul3-binding) and MATH (substrate-binding) domains (Fig. S1A). We confirmed the absence of Spop protein in the homozygotes of both mutant alleles by immunoblot analyses using an Spop-specific antibody (Fig. S1B). Homozygous mutant pups of both strains died shortly after birth, similar to a previous report, consistent with the prediction that they are both likely null (25) (Fig. S1 C and D and Tables S1–S3). Therefore, we refer to both mutant alleles as Spop− for brevity.
Fig. S1.
Spop mutants are smaller than their littermates at postnatal day (P) 1. (A) Spop mutant alleles and predicted protein products. (B) Immunoblots of E10.5 embryos with Spop and β-tubulin antibodies. Asterisks, nonspecific bands. (C) Lateral views of Spop mutants and WT littermates at P0 and P1. (D) Quantitative analyses of the body weight of Spop mutant and control pups at P0 (control, n = 24; Spop mutants, n = 5) and P1 (control, n = 12; Spop mutants, n = 8). Chart represents mean ± SEM; **P < 0.01; ns, P > 0.05 (t test).
Table S1.
Number of embryos or pups that survive to given stages from a crossing between heterozygotes (SpoplacZKI/+ × SpoplacZKI/+)
| Stage | Total | Spop+/+ | SpoplacZKI/+ | SpoplacZKI/lacZKI | Mutant% |
| E8.5 to E16.5 | 197 | 55 | 96 (1) | 46 | 23.4 |
| E17.5 to E18.5 | 41 | 9 | 24 | 8 (1) | 19.5 |
| P0 | 37 | 11 | 19 | 7 | 18.9 |
| P1 | 47 | 12 | 29 (1) | 6 (5) | 12.8 |
| P2 | 25 | 5 | 18 | 2 (3) | 8.0 |
| At weaning (P21) | 90 | 28 | 62 | 0 | 0.0 |
The number in parentheses is the number of embryos/pups recovered at indicated stages that were already dead. This number was excluded from the subtotal. Mutant%, the percentage of homozygous mutants among all of the genotypes.
Table S3.
Number of embryos or pups that survive to given stages from a crossing between heterozygotes (SpopΔEx/+ × SpopΔEx/+)
| Stage | Total | Spop+/+ | SpopΔEx/+ | SpopΔEx/ΔEx | Mutant% |
| E9.5 to E16.5 | 300 | 77 (1) | 162 (3) | 61 (4) | 20.3 |
| E17.5 to E18.5 | 98 | 35 (1) | 47 | 15 (3) | 15.5 |
| P0 | 40 | 7 | 28 | 5 | 12.5 |
| P1 | 22 | 7 | 13 | 2 (2) | 9.1 |
| P2 | 38 | 15 | 23 | 0 | 0.0 |
| At weaning (P21) | 50 | 21 | 29 | 0 | 0.0 |
The number in parentheses is the number of embryos/pups recovered at indicated stages that were already dead. This number was excluded from the subtotal. Mutant%, the percentage of homozygous mutants among all of the genotypes.
Table S2.
Number of embryos or pups that survive to given stages from a crossing between heterozygotes (Spopflox/+ × Spopflox/+)
| Stage | Total | Spop+/+ | Spopflox/+ | Spopflox/flox | flox/flox% |
| At weaning (P21) | 61 | 17 | 26 | 18 | 29.5 |
flox/flox%, the percentage of Spopflox/flox pups among all of the genotypes.
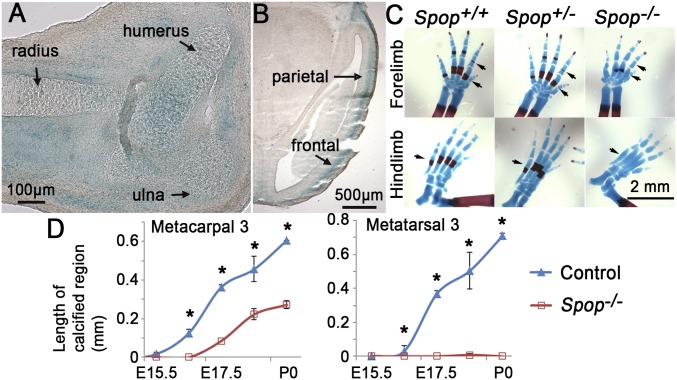
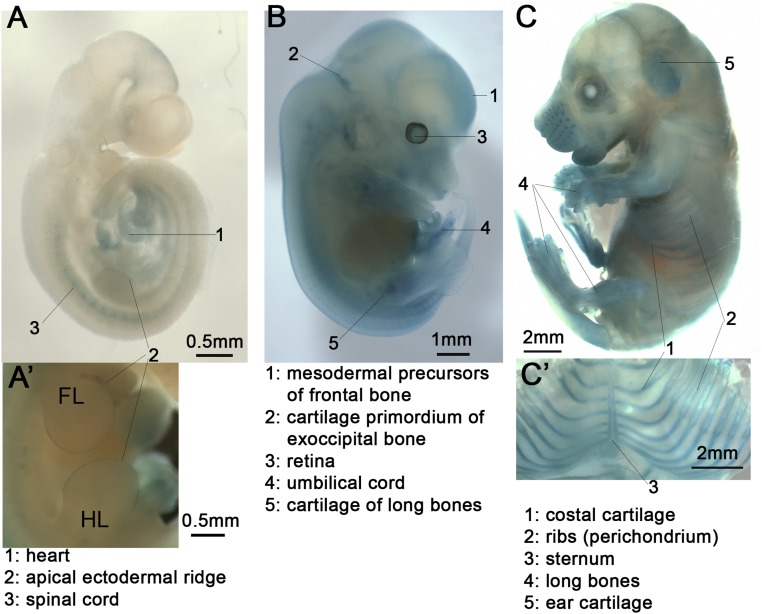
The lacZ reporter in the SpoplacZKI allele allowed us to detect the expression pattern of Spop with great sensitivity. We found that, starting from embryonic day (E) 12.5, Spop-lacZ was expressed at high levels in the developing endochondral skeleton, including the long bones, costal cartilage, ribs, and vertebrae (Fig. 1A and Fig. S2). A closer look revealed lacZ expression in the chondrocytes and perichondrium, as well as surrounding mesenchymal cells that are possibly muscle precursors. Robust expression of Spop was also present in the primordium of dermal bones (Fig. 1B).
Fig. 1.
Spop regulates skeletal development. (A and B) Xgal-stained sections of an E14.5 SpoplacZKI/+ embryo showing Spop-lacZ expression (blue) in the cartilage and perichondrium of the forelimb (A) and in the developing skull (B). (C) Alcian blue- and Alizarin red-stained E17.5 autopods. Arrows, the ossification centers that are diminished in Spop mutants. (D) The length of the calcified region on metacarpal 3 and metatarsal 3. n ≥ 3 embryos per genotype and stage. *P < 0.05 (t test).
Fig. S2.
A lacZ reporter indicates Spop expression in skeletal tissues. (A) A lateral view of an Xgal-stained E10.5 SpoplacZKI/+ embryo. (A′) A side view of an Xgal-stained E11.5 SpoplacZKI/lacZKI embryo. FL, forelimb bud; HL, hindlimb bud. (B) An Xgal-stained E13.5 SpoplacZKI/+ embryo. (C) An Xgal-stained E16.5 SpoplacZKI/+ embryo. Frontal view of the sternum, costal cartilage, and ribs is shown in C′.
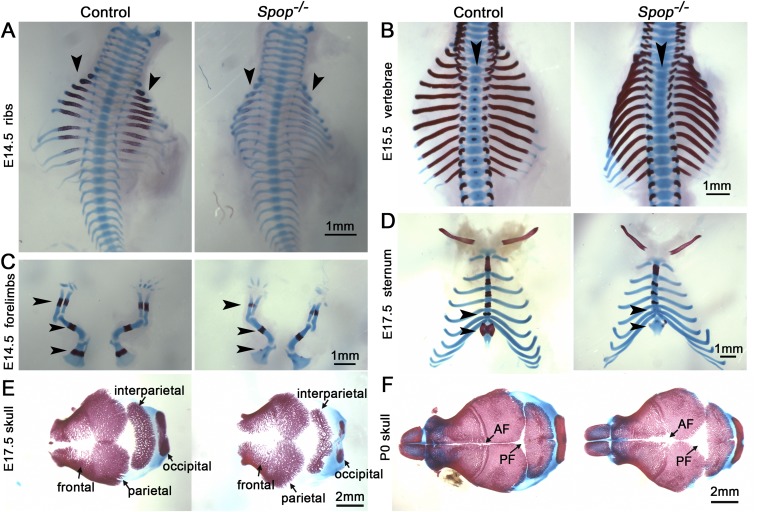
The strong Spop expression in the developing cartilage prompted us to examine endochondral ossification in Spop mutants. Indeed, we found delayed calcification in the ribs, vertebrae, and long bones in Spop mutants at multiple stages (Fig. S3 A–D). In particular, the calcification of the metacarpals and metatarsals was severely compromised in Spop mutants, with the defects more severe in the hindlimbs (Fig. 1 C and D). The enlarged fontanelles and fenestrated dermal bones in Spop mutants suggested that intramembranous ossification was also affected in the absence of Spop (Fig. S3 E and F).
Fig. S3.
Spop mutants exhibit widespread skeletal defects. (A) Ossification centers are already evident in WT ribs (arrowheads) at E14.5 but still look faint in Spop mutants. (B) Ossification centers appear in WT, but not Spop mutant, vertebrae (arrowheads) at E15.5. (C) Ossification centers are much smaller in Spop mutant ulna, radius, and scapula (arrowheads) than in WT littermates at E14.5. (D) At E17.5, the ossification centers in Spop mutant sternum and Xiphoid process fail to form compared with WT littermates. Arrowheads indicate the ossification centers not formed or greatly reduced in Spop mutants. (E and F) Top view of skulls at E17.5 and P0 shows fenestrated dermal bones and expansion of fontanelles in Spop mutants. AF, anterior fontanelle; PF, posterior fontanelle. n ≥ 3 embryos/pups per genotype were analyzed for all experiments.
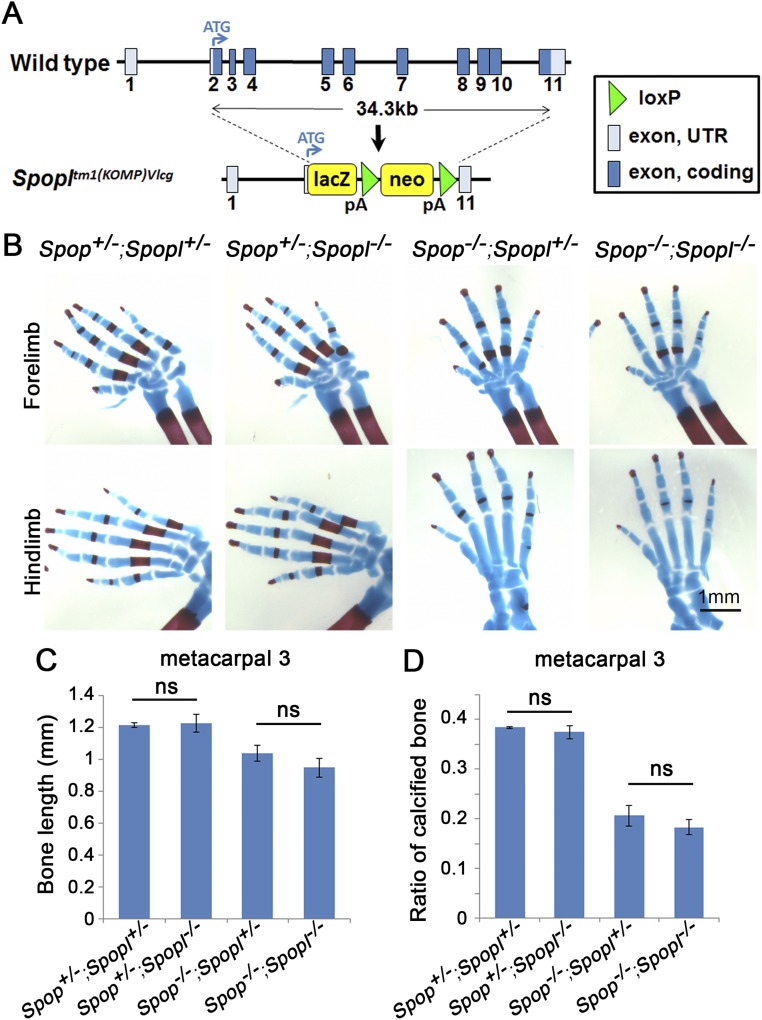
Spopl shares 85% sequence identity with Spop and exhibits similar, but weaker, E3 ubiquitin ligase activity than Spop (26). To investigate whether Spop and Spopl play redundant roles in mouse development, we characterized Spopl mutants and Spop;Spopl double mutants. Spopl homozygous mutants were viable and fertile with no apparent morphological and skeletal defects, and Spop;Spopl double mutants exhibited similar skeletal defects to Spop mutants (Fig. S4), indicating that Spopl did not compensate for the loss of Spop in mouse development.
Fig. S4.
Loss of Spopl does not lead to obvious skeletal defects. (A) A schematic illustration of Spopl knockout strategy. The entire Spopl coding sequence was replaced with a lacZ-neomycin expression-selection cassette. The resulting Spopltm1(KOMP)Vlcg allele is a null allele and hereby abbreviated as Spopl−. (B) Alcian blue and Alizarin red staining of E18.5 limb autopods. (C) Measurement of the length of metacarpal 3. (D) The ratio of ossified metacarpal 3 was calculated as the length of its calcified region divided by the total length. Ns, P > 0.05 (t test, n = 3 embryos per genotype).
Spop Regulates Hypertrophic Differentiation of Chondrocytes.
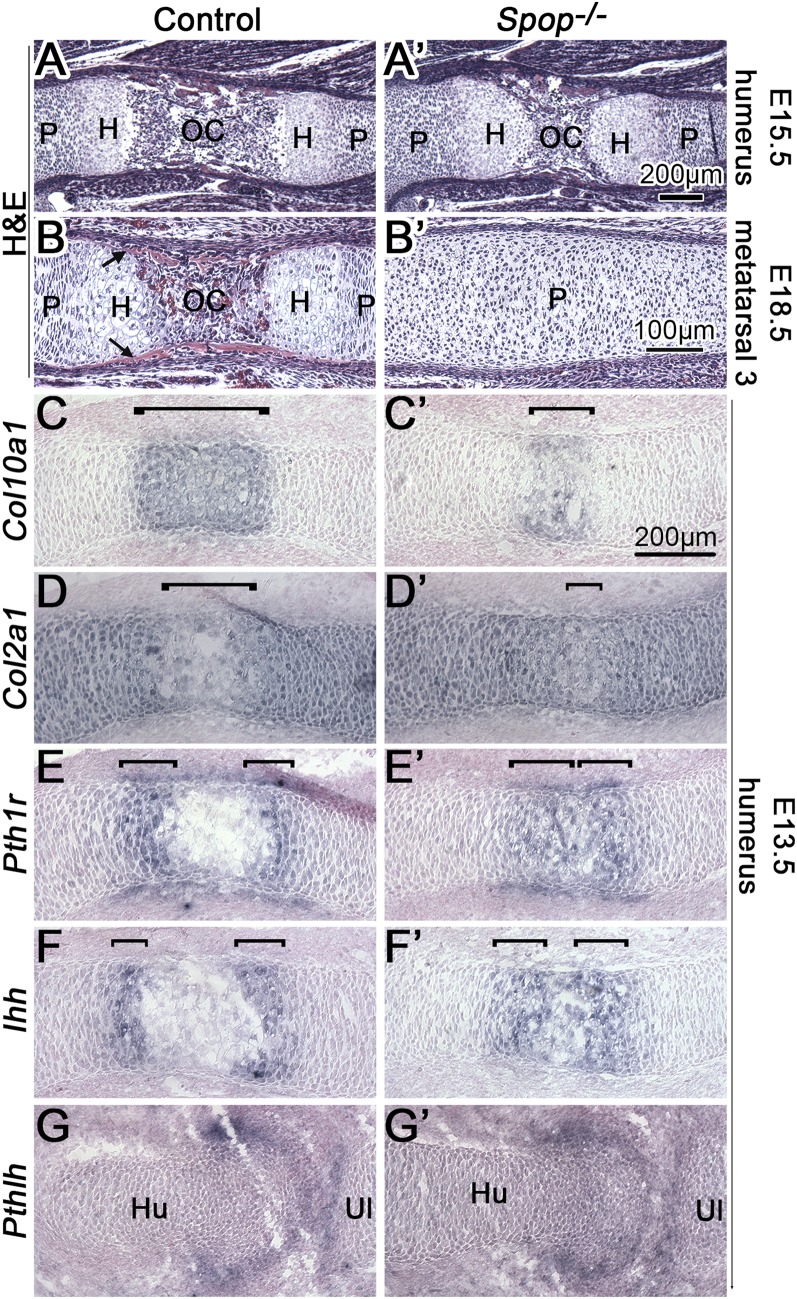
We next investigated whether the ossification defects in Spop mutants resulted from disrupted chondrocyte differentiation. As we expected, the primary ossification center flanked by hypertrophic chondrocytes was much narrower in the E15.5 Spop mutant humerus compared with that of WT (Fig. 2 A and A′). Similar, but more severe, defects were observed in E18.5 metatarsals (Fig. 2 B and B′). To better evaluate the hypertrophic differentiation of chondrocytes in Spop mutants, we examined the expression of genes specific to chondrocytes at various stages of differentiation in the E13.5 humerus. At the transition from proliferation to hypertrophic differentiation, chondrocytes switched from Col2a1 expression to Col10a1 expression (Fig. 2 C and D). Interestingly, the Col2a1−/Col10a1+ domain was greatly reduced in Spop mutants, suggesting that hypertrophic differentiation was defective (Fig. 2 C′ and D′). In addition, the two narrow domains of Pth1r and Ihh expression in the prehypertrophic chondrocytes separated by the hypertrophic zones were much closer to each other in Spop mutants, confirming the hypertrophic differentiation defects (Fig. 2 E–F′).
Fig. 2.
Loss of Spop disrupts hypertrophic differentiation of chondrocytes. (A–B′) H&E-stained longitudinal sections of humeri and metatarsal 3. H, hypertrophic zone; OC, primary ossification center; P, proliferating zone. Arrows, bone collar. (C–G′) RNA in situ hybridization (purple) on longitudinal sections of E13.5 humeri. (C–D′) Hypertrophic chondrocytes (bracket) express Col10a1, but not Col2a1. (E–F′) Pth1r and Ihh are expressed in prehypertrophic chondrocytes (bracket). (G and G′) Pthlh is expressed in periarticular perichondrium. Hu, humerus; Ul, ulna. n ≥ 3 embryos per genotype were analyzed for all experiments.
Spop Promotes Bone Formation and Osteoblast Differentiation.
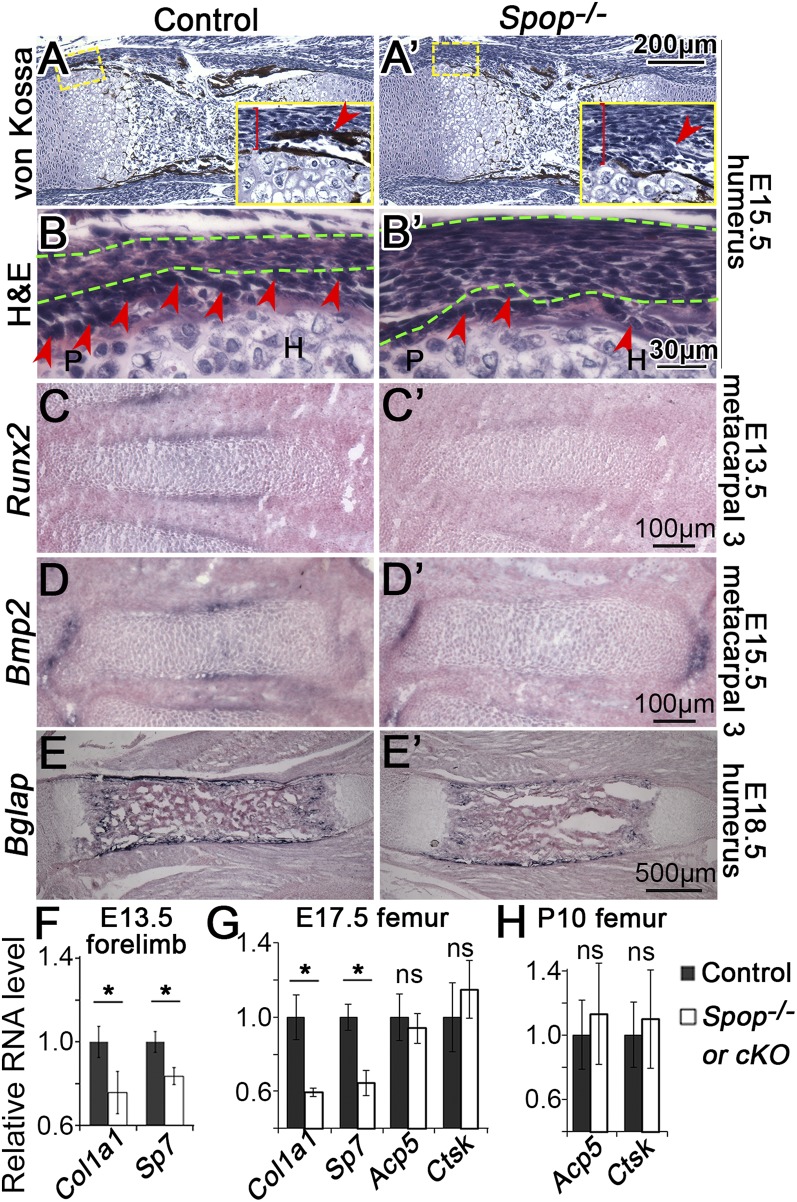
The expression of Spop in the perichondrium, where osteoblasts are derived (Fig. 1A), suggests that Spop may be important for bone formation and osteoblast differentiation. Indeed, the bone collar present in E18.5 WT metatarsal 3 was absent in Spop mutants (Fig. 2 B and B′). A von Kossa assay confirmed that the bone collar was similarly absent from the region next to the prehypertrophic chondrocytes of the Spop mutant humerus at E15.5 (Fig. 3 A and A′). We also found that the inner layer of the perichondrium in Spop mutants failed to properly differentiate into cuboidal osteoblasts and that the perichondrium was thicker than that in control littermates (Fig. 3 B and B′). Furthermore, Runx2 and Bmp2, markers for the precursors and mature osteoblasts, respectively, were both down-regulated in the Spop mutant metacarpals (Fig. 3 C–D′). Of note, chondrocytes in the metacarpals did not undergo hypertrophic differentiation until E15.5, suggesting that the lack of Runx2 expression was not secondary to the defects in chondrocyte hypertrophy. Similarly, the expression of Bglap, also known as Osteocalcin, a marker of terminally differentiated osteoblasts, was reduced in Spop mutants (Fig. 3 E and E′). Finally, we used quantitative reverse transcription PCR (qRT-PCR) to measure the expression levels of Col1a1, a major extracellular matrix protein produced by osteoblast, and Sp7/osterix, a transcription factor required for osteoblast maturation, and found that both genes were significantly down-regulated at E13.5 in the Spop mutant forelimbs (Fig. 3F). These results suggest that Spop promotes bone formation, likely by cell-autonomously promoting osteoblast differentiation.
Fig. 3.
Loss of Spop impairs bone formation and osteoblast differentiation. (A and A′) Von Kossa-stained longitudinal sections of E15.5 humerus. (Insets) The perichondrium (brackets) by the prehypertrophic zone. The orthotropic bone collar (arrowheads) is missing in Spop mutant. (B and B′) H&E-stained sections showing the perichondrium (between the green dash lines) by the prehypertrophic zone of E15.5 proximal humerus. Arrowheads, cuboidal osteoblasts. H, hypertrophic zone; P, proliferating zone. (C–E′) RNA in situ hybridization of Runx2, Bmp2, and Bglap. (F–H) qRT-PCR analyses of Col1a1, Sp7, Acp5, and Ctsk in Spop-null (F and G), SpopcKO (H), and control samples. *P < 0.05; ns, P > 0.05 (t test). n ≥ 3 embryos per genotype were analyzed for all experiments.
Decreased Ihh Signaling and Gli3R Accumulation in Spop Mutants.
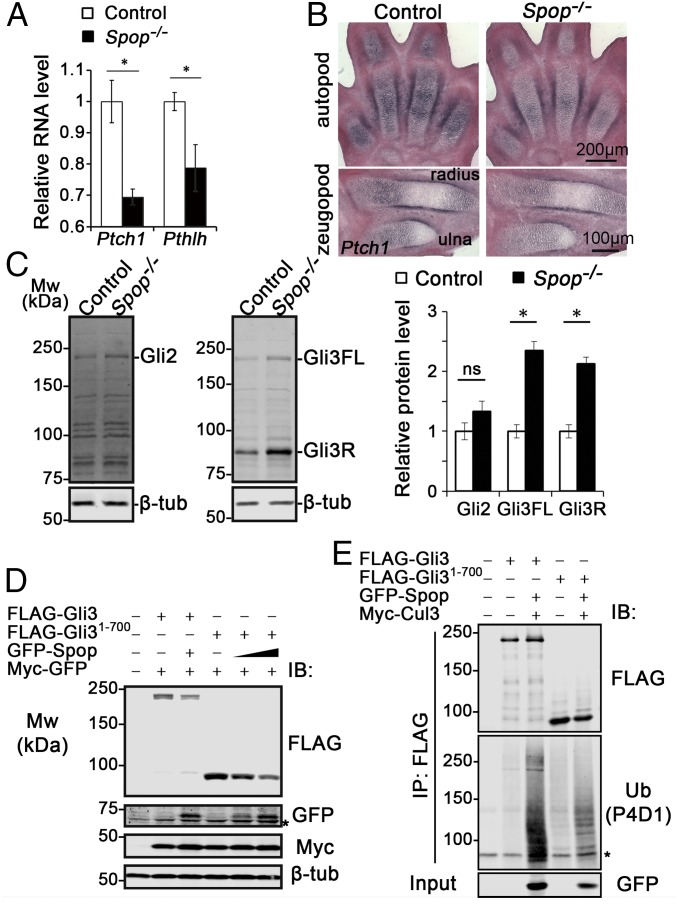
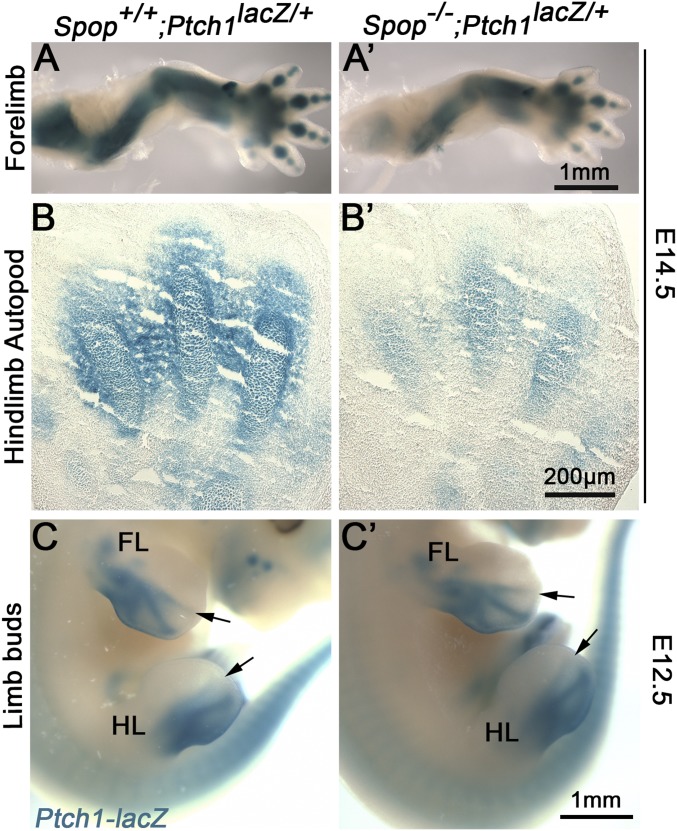
Previous in vitro studies found that Spop inhibited Hh signaling by targeting Gli2 and Gli3FL for degradation (18–21, 23). To test whether Ihh signaling was affected by the loss of Spop, we examined the expression of Patched 1 (Ptch1), a direct transcriptional target of Ihh, in E13.5 forelimbs. Interestingly, we found a significant reduction in Ptch1 expression in E13.5 Spop mutant forelimbs through qRT-PCR, indicating an unexpected positive role of Spop in Ihh signaling (Fig. 4A). Moreover, both RNA in situ hybridization with a Ptch1 probe (Fig. 4B) and a Ptch1-lacZ reporter (Fig. S5 A–B′) showed a reduction of Ptch1 expression in the chondrocytes and perichondrium of Spop mutants, suggesting that Spop regulates bone formation by promoting Ihh signaling. In contrast, Ptch1-lacZ expression in the posterior part of E12.5 Spop mutant limb buds was indistinguishable from that of the littermates (Fig. S5 C and C′), suggesting that loss of Spop has no obvious effect on Sonic Hedgehog signaling from the zone of polarizing activity. Consistent with decreased Ihh signaling, qRT-PCR revealed that the expression of Pthlh, another target gene of Ihh signaling, was also significantly reduced (Fig. 4A), although this moderate reduction was not obvious through RNA in situ hybridization (Fig. 2 G and G′). These results suggest that Spop promotes endochondral ossification by positively regulating Ihh signaling.
Fig. 4.
Increased Gli3 repressor and compromised Ihh signaling in Spop mutants. (A) qRT-PCR analyses of Ptch1 and Pthlh in E13.5 forelimbs. (B) RNA in situ hybridization of Ptch1 on E13.5 forelimb sections. (C) Immunoblots of E13.5 forelimbs with Gli2, Gli3, and β-tubulin antibodies. *P < 0.05; ns, P > 0.05 (t test). (D) Immunoblots of Spop, Gli3, and Gli31-700 with Myc-GFP as a transfection control. *, a nonspecific band. (E) In vivo ubiquitination assay of Gli3 and Gli31-700. HEK 293T cells were treated with MG132 for 8 h before immunoprecipitation (IP) and immunoblot analyses. *, a nonspecific band. (A–C) n = 3 embryos per genotype were analyzed. (D and E) n = 3 independent experiments were performed.
Fig. S5.
Loss of Spop impairs Ptch1 expression in the skeleton. (A and A′) Xgal-stained E14.5 forelimbs showing Ptch1 expression in the bones and cartilages. (B and B′) Sections of Xgal-stained E14.5 hindlimbs showing Ptch1 expression in the metatarsals. (C and C′) Xgal-stained E12.5 embryos showing Ptch1 expression in the posterior part of the limb buds. Arrows indicate the anterior boundary of the lacZ expression domain in the limb buds. FL, forelimb; HL, hindlimb.
To understand the molecular basis of this positive role of Spop in Ihh signaling, we examined the levels of Gli2 and Gli3 in E13.5 forelimbs by immunoblot analyses. Despite previous in vitro data suggesting an important role of Spop in Gli2 degradation (18–21, 23), the level of Gli2 was not significantly changed in Spop mutants (Fig. 4C). In contrast, the levels of both Gli3FL and Gli3R in the Spop mutant forelimbs were more than twice those in WT (Fig. 4C). Because Gli3R was known to antagonize Ihh signaling in endochondral ossification (10), we conclude that Spop promotes Ihh signaling in skeletal development by down-regulating Gli3R.
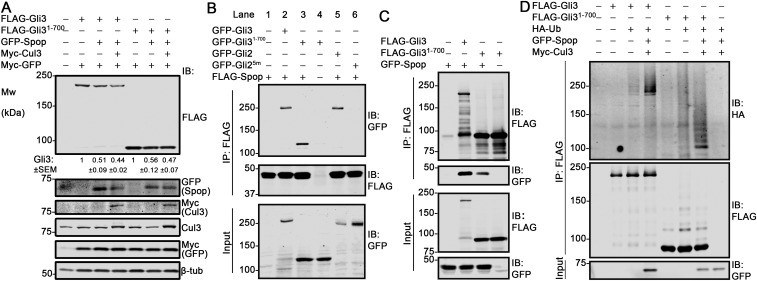
Because the levels of both Gli3FL and Gli3R were higher in Spop mutants, it was possible that Spop targeted exclusively Gli3FL, which, in turn, generated Gli3R through proteolytic processing. Alternatively, because previous studies showed interaction between Spop and the N terminus of Gli3 (19, 20), Spop may interact and directly target Gli3R for degradation. To test the latter possibility, we first examined the physical interaction between Spop and Gli31-700, a truncated form mimicking Gli3R, by coexpressing FLAG-Spop with GFP-tagged Gli3, Gli31-700, and Gli2, respectively, and immunoprecipitating FLAG-Spop. We found that, similar to Gli3 and Gli2, Gli31-700 coprecipitated with Spop (Fig. S6B). As a negative control, Gli25m, a Gli2 variant with mutated Spop-binding motifs, did not coprecipitate with Spop (19) (Fig. S6B). Reverse immunoprecipitation confirmed that GFP-Spop coprecipitated with FLAG-tagged Gli3 and Gli31-700 (Fig. S6C). Subsequently, we tested the ability of Spop to reduce the level of Gli3R in cultured cells. We found that coexpressing Spop in HEK 293T cells reduced the levels of both Gli3 and Gli31-700 (Fig. 4D and Fig. S6A). Finally, we found that overexpressed Spop promoted the ubiquitination of both Gli3 and Gli31-700 in HEK 293T cells (Fig. 4E and Fig. S6D). These results indicated that Gli3R was a direct target of Spop and that the increase in Gli3R in Spop mutants resulted at least partially from lack of Spop-mediated degradation.
Fig. S6.
Spop induces ubiquitination and degradation of Gli31-700. (A) HEK 293T cells were transfected with indicated constructs, serum starved for 48 h, and subjected to immunoblot analyses. Myc-GFP was carried as a transfection control. Quantification of Gli3 level (mean ± SEM, n = 3 independent experiments, normalized to Myc-GFP) is shown. Overexpression of Spop alone triggered Gli3 degradation, likely through interaction with endogenous Cul3. (B) HEK 293T cells transfected with indicated constructs were subjected to Spop immunoprecipitation with FLAG antibody and subsequent immunoblot analyses. The loading of lane 4 was half of other lanes in all three immunoblots to ensure fair comparison between lanes 3 and 4. (C) As in B, but FLAG-tagged Gli3 or Gli31-700 was immunoprecipitated. (D) HEK 293T cells were transfected with indicated constructs and treated with MG132 for 8 h before harvest. FLAG-Gli3 and Gli31-700 were then immunoprecipitated, and immunoblot analyses were performed. Representative results from n ≥ 3 independent experiments are shown.
The Increase in Gli3R Underlies the Ossification Defects in Spop Mutants.
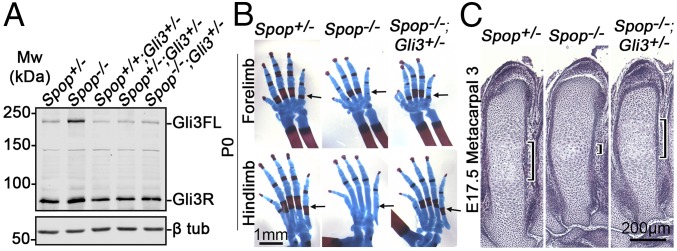
To test the hypothesis that the increase in the level of Gli3R and decreased Ihh signaling underlie the skeletal defects in Spop-null mutants, we generated Spop−/−;Gli3+/− double mutants in which Gli3FL and Gli3R were restored to near WT level (Fig. 5A). Importantly, both the endochondral ossification and chondrocyte hypertrophy were restored in metacarpals and metatarsals in Spop−/−;Gli3+/− double mutants (Fig. 5 B and C).
Fig. 5.
Increased Gli3 repressor underlies the ossification defects of Spop mutants. (A) Immunoblots of Gli3 and β-tubulin on E17.5 metacarpals. (B) Alcian blue- and Alizarin red-stained postnatal day 0 (P0) autopods. Arrows, the ossification centers. (C) H&E-stained E17.5 metacarpal 3. Brackets, the hypertrophic zone. n = 3 embryos per genotype were analyzed.
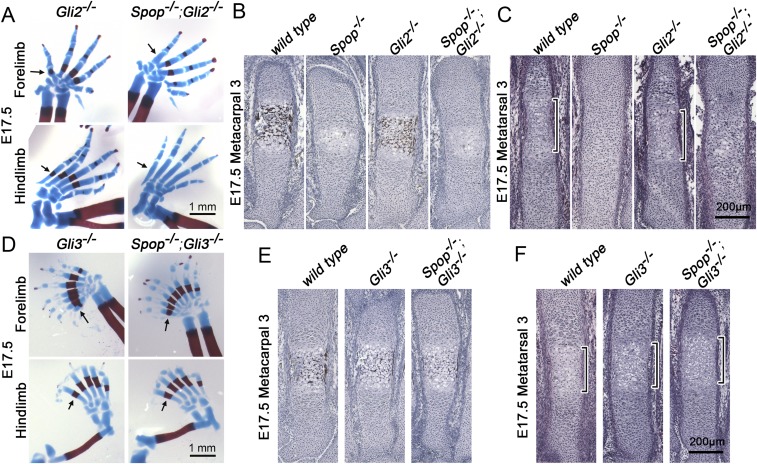
Consistent with our observation that the levels of Gli3, but not Gli2, were altered in Spop mutant limbs, Spop;Gli2 double homozygous mutants exhibited ossification defects (Fig. S7A), failure in bone matrix deposition (Fig. S7B), and hypertrophic differentiation (Fig. S7C) in digit bones at E17.5, similar to Spop single mutants. In contrast, loss of Spop had no effect on either digit formation or the ossification of the metacarpals and metatarsals in the absence of Gli3 (Fig. S7D). The calcification (Fig. S7E) and hypertrophic differentiation (Fig. S7F) were also comparable in Spop;Gli3 double homozygous mutants and Gli3 mutants. These results suggest that Spop regulates endochondral bone development mainly through Gli3, but not Gli2.
Fig. S7.
Spop regulates skeletal development through Gli3 but not Gli2. (A and D) Alcian blue- and Alizarin red-stained E17.5 autopods. Arrows, the ossification centers. (B and E) Von Kossa-stained E17.5 metacarpal 3. (C and F) H&E-stained E17.5 metatarsal 3. Brackets, the hypertrophic zone. n = 4 embryos per genotype were analyzed.
Defective Chondrocyte Hypertrophy Results in Brachydactyly in Spop Mutants.
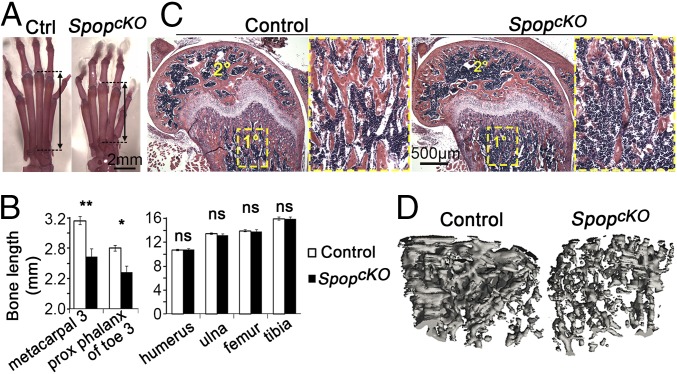
Because the neonatal lethality of Spop-null mutants prevented us from assessing skeletal defects in adults, we generated a limb-specific Spop mutant allele (SpopcKO) by removing Spop in Prx1-expressing limb mesenchymal cells. We found that the metacarpals, metatarsals, and phalanges, but not long bones in more proximal parts of the limbs, were significantly shorter in adult SpopcKO mutants than in their littermates (Fig. 6 A and B). Therefore, SpopcKO can serve as a model for brachydactyly, a common but poorly understood congenital anomaly (27).
Fig. 6.
Tissue-specific ablation of Spop leads to brachydactyly and osteopenia. (A) Alcian blue- and Alizarin red-stained 5-mo-old hindlimb autopods. Arrows, metatarsal 3. (B) Quantification of 5-wk-old limb bone length. *P < 0.05; **P < 0.01; ns, P > 0.05 (t test). (C) H&E-stained sections of 5-wk-old distal femur. 1°, primary ossification center; the areas inside the rectangles are shown in the close-up view. 2°, secondary ossification center. (D) A 3D reconstruction of the μCT images of the trabecular bone in 10-wk-old distal metaphysis of femurs. Voxel size, 15 μm. n = 3 males and 3 females per genotype were analyzed.
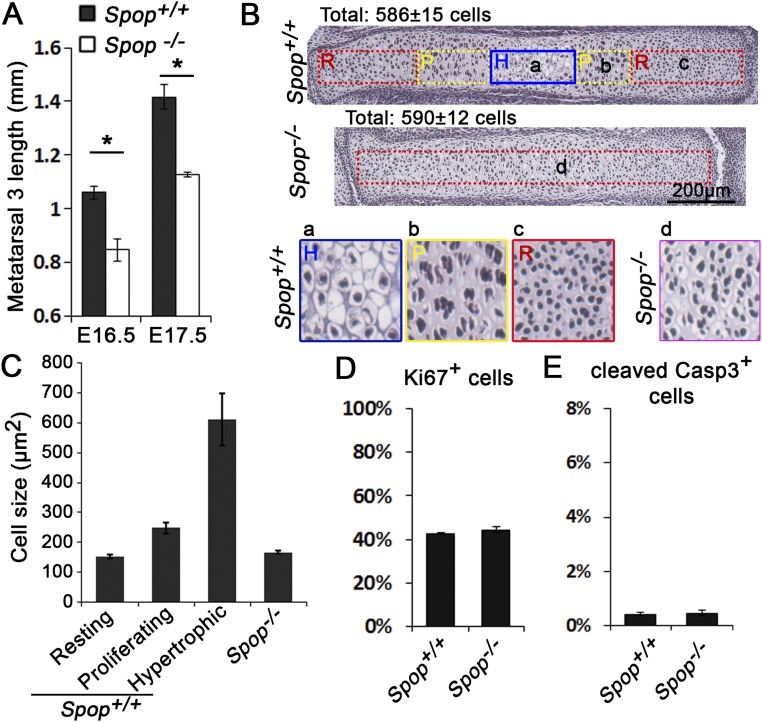
We sought to determine whether changes in cell proliferation and/or apoptosis contribute to the short digits in Spop mutants at E17.5, when the Spop mutant metatarsals were obviously shorter than WT (Fig. S8A). Interestingly, the cell number in Spop mutant metatarsals was similar to that in WT littermates (Fig. S8B), suggesting that the shorter metatarsals did not result from a reduction in cell number. In line with this observation, the numbers of proliferating (Ki67+) and apoptotic (cleaved caspase 3+) cells were also comparable between Spop mutant and WT metatarsals (Fig. S8 D and E). On the other hand, although large hypertrophic chondrocytes were present in the center of the WT metatarsals, cells were more densely packed throughout the Spop mutant metatarsals (Fig. S8 B and C). These results suggest that compromised hypertrophic differentiation of chondrocytes underlies the brachydactyly in Spop mutants.
Fig. S8.
Defective hypertrophic differentiation leads to shorter digit bones. (A) Measurement of metatarsal 3 length (n ≥ 3 mice per group). *P < 0.05. (B) H&E-stained metatarsal 3 at E17.5. Total cell numbers in the rectangles (all 100 μm wide) were counted and labeled in the image (n = 3 embryos per genotype). H, hypertrophic zone; P, proliferating zone; R, resting zone. a–c, close-up views of the hypertrophic, proliferating, and resting zones of WT; d, a close-up view of Spop mutant cartilage. (C) Cell sizes derived from the area of rectangles divided by cell number (mean ± SEM). (D and E) Percentage of Ki67 and cleaved caspase 3 positive cells in E16.5 metatarsal 3. Sections were immunostained, and cells confined in a rectangle across the resting, proliferating, and hypertrophic zones were counted.
Osteoblast Differentiation Defect Results in Osteopenia in Spop Mutants.
Although the stylopod and zeugopod bones were not shorter in SpopcKO mutants, these bones nevertheless exhibit structural defects. Our histological analyses of the femurs showed an obvious reduction in the density of bone matrix in both the primary and secondary ossification centers, as well as thinner bone spicules, in adult SpopcKO mutants (Fig. 6C). To further investigate the structural defects of the bones of SpopcKO mutants, we evaluated the femurs with X-ray micro-computed tomography (μCT). The 3D reconstruction of distal metaphysis showed an obvious reduction in trabecular bone density in SpopcKO mutants (Fig. 6D), which was confirmed by quantitative analyses of the μCT data that indicated a significant reduction in bone volume fraction, trabecular number, trabecular thickness, and connectivity density, as well as a significant increase in the specific bone surface and trabecular separation in SpopcKO mutants (Fig. S9).
Fig. S9.
Limb-specific Spop mutants exhibit loss of bone volume. μCT analyses of the trabecular bone in 10-wk-old distal metaphysis of femurs. (A) Ratio of the bone volume to the total volume. (B) Specific bone surface: i.e., ratio of bone surface to bone volume. (C) Trabecular number per unit length. (D) Trabecular thickness. (E) Trabecular separation: i.e., the distance between trabeculae. (F) Connectivity density. Data represent mean ± SEM from three males and three females per genotype. *P < 0.05; **P < 0.01 (two-way ANOVA).
In development and adulthood, bones undergo constant remodeling with osteoblasts producing bone matrix and osteoclasts resorbing it (28). To determine the mechanism underlying the loss of bone mass in SpopcKO mutants, we analyzed the expression of osteoblast and osteoclast markers by qRT-PCR. Similar to earlier stages, the expression of both Col1a1 and Sp7 was compromised in E17.5 Spop mutant femurs, suggesting continued defects in osteoblast differentiation (Fig. 3G). In contrast, the expression of Acp5 and Ctsk, both encoding enzymes secreted by osteoclasts to remodel the bone matrix, was not significantly changed in E17.5 and postnatal day 10 (P10) Spop mutants (Fig. 3 G and H), suggesting that the loss of bone mass was not the result of too much osteoclast activity. Therefore, osteopenia in SpopcKO mutants was likely the result of impaired osteoblast function.
Gli3R Dosage Reduction Rescues Brachydactyly and Osteopenia.
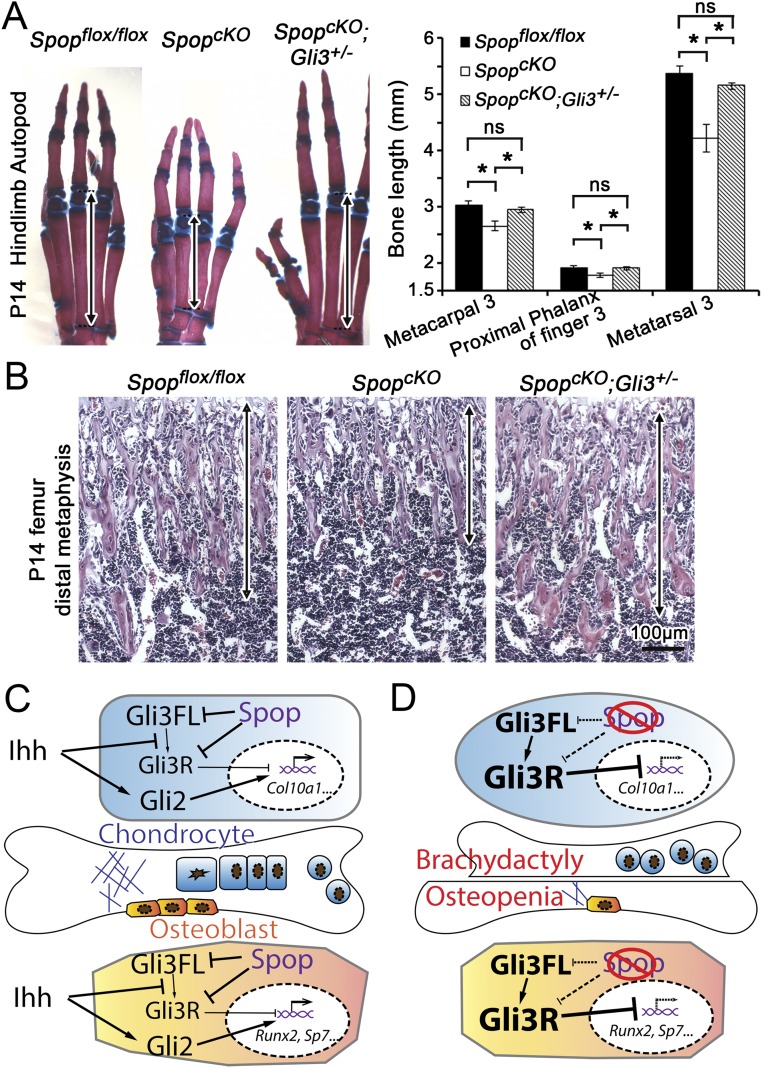
Because the increase in Gli3R underlies the defects in chondrocyte and osteoblast differentiation in Spop-null mutants, we hypothesized that it also accounted for the osteopenia and brachydactyly in SpopcKO mutant mice. To test this hypothesis, we reduced the dosage of Gli3R by generating SpopcKO;Gli3+/− double mutants. We found that the length of metacarpals, phalanges and metatarsals in 2-wk-old SpopcKO;Gli3+/− pups was comparable with that in Spopflox/flox littermates, and significantly longer than that in SpopcKO mutant littermates (Fig. S10A). In addition, both the bone density and thickness of bone spicules increased in SpopcKO;Gli3+/− than in SpopcKO mutant femur (Fig. S10B). Therefore, we conclude that dysregulation of Gli3R underlies both brachydactyly and osteopenia in SpopcKO mutant mice.
Fig. S10.
The bone defects of limb-specific Spop mutants result from increased Gli3 repressor. (A) Alcian blue- and Alizarin red-stained P14 hindlimb autopods, and quantification of bone length in digit 3; 4 mice per genotype were analyzed. *P < 0.05; ns, P > 0.05 (t test). Arrows, metatarsal 3. (B) H&E-stained distal metaphysis of femurs. Arrows, the range of bone spicules. (C) Spop promotes Ihh signaling by degrading Gli3FL and Gli3R, leading to a down-regulation of Gli3R level, thereby activating genes critical for chondrocyte and osteoblast differentiation. (D) Defects in hypertrophic differentiation results in shorter digits in Spop mutants, and impaired osteoblast differentiation leads to osteopenia.
Discussion
In the present study, we characterized two null alleles and a limb-specific conditional mutant allele of Spop and discovered critical roles for Spop in skeletal development and remodeling. We show that chondrocyte and osteoblast differentiation is defective in the absence of Spop. Gli3R, but not Gli2, is increased in Spop mutants, and Ihh signaling is compromised as a result. Finally, we show that limb-specific loss of Spop leads to brachydactyly and osteopenia, which can be rescued by reducing the dosage of Gli3R, suggesting that Spop could be a new target of intervention for these human disease conditions (Fig. S10 C and D).
Our finding that Spop plays a positive role in Ihh signaling is in striking contrast to previous studies suggesting a negative role of Spop in Hh signaling. In Drosophila, loss of hib/rdx results in the accumulation of Ci and excess activation of Hh signaling (22, 23). Interestingly, expression of hib/rdx was found only in cells with high levels of Hh pathway activation, in which proteolytic processing of Ci was inhibited. Therefore, the excess activation of Hh signaling in hib/rdx mutants likely resulted from the accumulation of full-length activated Ci. In contrast, our data and a previous study suggest that the expression of mammalian Spop is not limited to cells with active Hh signaling (18). Therefore, the accumulation of Gli3R in cells with moderate levels of Hh signaling likely accounts for the unique reduction of Hh pathway activation in Spop mutant mice. Consistent with this hypothesis, overexpression of hib/rdx in areas of Drosophila wing disk with moderate Hh pathway activation resulted in the decrease in both full-length and processed Ci (22).
Recent studies using cultured mammalian cells or mRNA injection in Xenopus eggs also suggested a negative role of Spop in Hh signaling (18–21, 24). It is worth noting that a key difference between these studies and our in vivo data lies in the roles of Spop in the regulation of Gli2, the primary activator of the mammalian Hh pathway. In these gain-of-function studies, overexpressed Spop interacts with Gli2 and targets it for degradation, an observation we confirmed in our own in vitro analysis (Fig. S6B). In contrast, we find no significant change in Gli2 protein level in Spop-null mutants. Although both Gli3FL and Gli3R accumulate in Spop mutants, the increase in Gli3R clearly has more impact on the Ihh signaling output, consistent with a previous study indicating an important role of Gli3R in Ihh signaling and endochondral ossification (10).
It is not clear why the level of Gli2 is not altered by the loss of Spop in vivo. One possible explanation is that Spop specifically targets the activated, labile form of Gli2 that exists in only a small number of cells with the highest level of Hh pathway activation as suggested by previous in vitro studies (18, 20, 21). Another possibility is that Spop does not target Gli2 for degradation under physiological condition. The finding that Spop interacts with both the N- and C-terminal regions of Gli3, but only with the C-terminal region of Gli2, suggests that Gli3 may be a better Spop substrate than Gli2 (19, 20).
Previous studies found that Sufu interferes with Spop/Gli-interaction and Spop-mediated Gli degradation (18, 20, 21), suggesting that Spop may specifically target activated Gli proteins that are not associated with Sufu. However, because Sufu is essential for the proteolytic processing of the Gli3 protein (20), the increase in both Gli3FL and Gli3R in Spop-null mutants seems to indicate that Spop can target nonactivated, Sufu-bound Gli3 for degradation as well. This result could also explain the difference between our results and a recent study suggesting that reducing Spop did not affect Gli3R level in cultured cells treated with Shh (21). In fact, figure 4G of ref. 21 appeared to show a small and insignificant increase in the levels of both Gli3FL and Gli3R with the reduction of Spop in the absence of Shh, consistent with our finding.
Our findings that Spop interacts with Gli3R and regulates its ubiquitination and degradation is consistent with previous reports of direct interaction between the N terminus of Gli3 and Spop (19, 20). A recent study further revealed multiple ubiquitination sites on the N terminus of Gli3 that are sufficient for Spop-catalyzed ubiquitination (29). However, our data seem to be at odds with a recent study showing no effect of Spop overexpression on the stability of Gli31-700 in C3H10T1/2 cells (20). This difference could result from the use of different antibodies for immunoblots. In ref. 20, a Gli3 antibody was used to detect both the endogenous Gli3R and overexpressed Gli31-700. Because endogenous Gli3R is hardly affected by Spop overexpression due to the low transfection efficiency, a moderate decrease in Gli31-700, which comigrates with endogenous Gli3R, may be difficult to detect. It is also possible that the expression levels of Spop in C3H10T1/2 and HEK 293T cells underlie the different effects on Gli31-700 degradation because we have failed to express Spop at sufficient levels in C3H10T1/2 cells in an attempt to repeat the experiment described in ref. 20.
In addition to Gli proteins, Spop mediates the ubiquitination of at least 20 more proteins through serine/threonine-rich degrons (19, 30). Therefore, it is theoretically possible that changes in the activities of other Spop substrates may also contribute to the skeletal defects observed in Spop mutants. However, the near-complete rescue of bone and cartilage development in Spop−/−;Gli3+/− and SpopcKO;Gli3+/− double mutants suggests that Spop-mediated ubiquitination of other substrates plays minimal roles in this process at best. Nevertheless, we failed to recover Spop−/−;Gli3+/− double mutants at weaning, suggesting that the increase in the level of Gli3 does not account for the lethality of Spop-null mutants.
In conclusion, we provide here solid evidence for essential roles of Spop-mediated ubiquitination in chondrocyte and osteoblast differentiation during skeletal development, and normal bone size and density in adult. Importantly, we reveal a surprisingly positive function of Spop in Ihh signaling through specific down-regulation of Gli3, particularly its repressor form. Clinically, this knowledge allows us to better understand the pathology and potential intervention of skeletal disorders such as brachydactyly and osteoporosis.
Materials and Methods
Animal Husbandry.
Spoptm1a(KOMP)Mbp and Spopltm1(KOMP)Vlcg mice were purchased from the Knockout Mouse Project (KOMP) and were genotyped per KOMP’s instruction (https://www.komp.org/). Other mouse strains used in this study are Gli2tm2.1Alj (31), Gli3Xt-J (32), Tg(EIIa-Cre)C5379Lmgd/J (33), Tg(Prrx1-cre)1Cjt (34), and Ptch1tm2Mps (35). The use of animals in this study was approved by the Institutional Animal Care and Use Committee at the Pennsylvania State University.
Cell Culture, Transfection, and Biochemical Analyses.
HEK 293T cells were cultured in DMEM (Cellgro) supplemented with 10% (vol/vol) FBS (Thermo Fisher) and transfected with polyethylenimine (PEI) (Polysciences). Immunoblot analyses were performed with IRDye-680RD and 800CW-conjugated secondary antibodies following the manufacturer’s instructions and were quantified with Image Studio (LI-COR). Immunoprecipitation was performed with a FLAG-IP kit (Sigma-Aldrich) following the manufacturer’s instructions. For the ubiquitination assay, cells were serum-starved for 40 h, treated with 50 μM MG132 (Sigma-Aldrich) for 8 h before harvesting, lysed as previously described (23) with sonication, and subjected to FLAG immunoprecipitation. Antibodies used in these assays are listed in SI Materials and Methods.
Quantitative Reverse Transcriptase Real-Time PCR.
Tissues were dissected, and postnatal bones were freed of muscle and marrow and pulverized in liquid nitrogen. RNA isolation was performed using a NucleoSpin RNA kit (Macherey-Nagel). Then, 1 μg of RNA was used for reverse transcription with qScript cDNA SuperMix (Quanta Biosciences). PCR was performed in a StepOne Plus Real-time PCR system (Applied Biosystems) with SYBR green (Quanta Biosciences). Primer sequences for qRT-PCR are listed in SI Materials and Methods.
RNA in Situ Hybridization.
RNA in situ hybridization was performed on cryosections with digoxigenin (DIG)-labeled antisense probes and BM purple (Sigma Aldrich) as substrate and counterstained with Nuclear Fast Red (Sigma-Aldrich) according to a previously published protocol (36).
Histology and Immunohistochemistry.
Bone tissues were decalcified in PBS/14% (wt/vol) EDTA (pH 7) before being embedded in paraffin. H&E staining was performed with a Gemini ES Automated Slide Stainer (Thermo) loaded with SelecTech hematoxylin and eosin staining system (Leica). For von Kossa assay, undecalcified sections were stained with 1% silver nitrate and counterstained with hematoxylin.
For immunohistochemistry, paraffin sections were deparaffinized and rehydrated. Antigen retrieval was performed by heating the sections in 10 mM citrate buffer (pH 6.0) at 95 °C for 10 min. The sections were then blocked with 1% goat serum and subjected to primary and HRP-conjugated secondary antibody incubation. Finally, color was developed with 3,3′-diaminobenzidine (DAB) (Ni) and hydrogen peroxide, and sections were lightly counterstained with hematoxylin. Antibodies used in these assays are listed in SI Materials and Methods.
Micro-Computed Tomography.
For 3D bone analysis, femurs from 10-wk-old mice were scanned in a Scanco μCT40 Desktop MicroCT Scanner (SCANCO Medical AG) with air as the medium. Images were acquired with the setting of 55 kVp, 145 μA, and 200 ms integration time. Images were reconstructed and stored in 3D arrays with an isotropic voxel size of 15 μm. Then, 100 slices at distal metaphysis were selected 750 μm from the proximal end of the distal growth plate for trabecular analysis. Company-provided software and custom scripts were used to view images, create 3D models of the bones and determine bone volume and other parameters.
SI Materials and Methods
Constructs and Antibodies.
The Spop coding sequence was cloned into pFLAG-CMV2 (Sigma Aldrich) and pEGFP-C1 (Clontech) using the following primers: 5′-GAATTCCTCGAGTCAAGGGTTCCAAGTCCTCCA-3′ and 5′-GAATTCGGATCCTTAGGATTGCTTCAGGCGTTTG-3′. The hGli3 coding sequence was cloned into pcDNA3.2-3xFLAG (gift from Yingwei Mao, Pennsylvania State University, University Park, PA) using the following primers: 5′-GATTAAGCGGCCGCTGAGGCCCAGTCCCACAG-3′ and 5′-CATTAATCTAGACTATTGCATAACTGCAAGGAATTTGCTT-3′. Myc-Cul3 was generously provided by Pao-tien Chuang, University of California, San Francisco (5, 6). HA-Ubiquitin was a gift from Edward Yeh, University of Texas MD Anderson Cancer Center, Houston (Addgene plasmid no. 18712) (7).
Antibodies used for immunoblotting were Spop (C-14, 1:200; Santa Cruz), Gli2 (AF3635, 1:500; R&D Systems), Gli3 (AF3690, 1:200; R&D Systems), GFP (A11122, 1:2,500; Life Technologies), FLAG (F1804, 1:2,500; Sigma-Aldrich), HA (MMS-101R, 1:2,000; Covance), Myc (9E10, 1:2,500; gift from Bernard Luscher, Pennsylvania State University, University Park, PA), Cul3 (C-18, 1:200; Santa Cruz), β-tubulin (T5201, 1:10,000; Sigma-Aldrich), and ubiquitin (P4D1, 1:200; Santa Cruz). Antibodies used for immunohistochemistry were Ki67 (ab15580, 1:250; Abcam) and cleaved caspase 3 (9661, 1:300; Cell Signaling).
Primers for qRT-PCR.
Primers were as follows: Pthlh, forward 5′-TTCAGCAGTGGAGTGTCCTG-3′, reverse 5′-TTGCCCTTGTCATGCAGTAG-3′; Ptch1, forward 5′-CTCCAAGTGTCGTCCGGTTT-3′, reverse 5′-ACCCATTGTTCGTGTGACCA-3′; Col1a1, forward 5′-CACCCTCAAGAGCCTGAGTC-3′, reverse 5′-GTTCGGGCTGATGTACCAGT-3′; SP7/Osterix, forward 5′-CCAGCCTCTGGCTATGCAAA-3′, reverse 5′-AGGAAATGAGTGAGGGAAGGGT-3′; Acp5, forward 5′-CAGGAGACCTTTGAGGACGTG-3′, reverse 5′-GTGGAATTTTGAAGCGCAAAC-3′; Cathepsin K, forward 5′-TGGCTCGGAATAAGAACAACG-3′, reverse 5′-GCACCAACGAGAGGAGAAATG-3′; Gapdh, forward 5′-GTCGGTGTGAACGGATTTGG-3′, reverse 5′-GACTCCACGACATACTCAGC-3′.
Acknowledgments
We thank Drs. Andrea Mastro, Philip Reno, and Yingwei Mao for critically reading this manuscript; Drs. Lee Niswander (University of Colorado), Matthew Hilton (Duke University), Henry Kronenberg (Harvard Medical School), Patricia Ducy (Columbia University), Jin Jiang (University of Texas Southwestern Medical Center), Matt Scott (Carnegie Institute), Alex Joyner (Sloan-Kettering Institute), Pao-tien Chuang (University of California, San Francisco), Edward Yeh (University of Texas MD Anderson Cancer Center), and Bernard Luscher and Yingwei Mao (Pennsylvania State University) for sharing reagents; Dr. Neil Sharkey and Noriaki Okita for great help in acquiring and analyzing the μCT data; and the Microscopy and Cytometry Facility and Genomics Core Facility of Pennsylvania State University for technical support. This work was supported by NIH Grant HD083625, a Pennsylvania State University Start-up Fund (to A.L.), and a J. Lloyd Huck Dissertation Research Grant (to H.C.).
Footnotes
The authors declare no conflict of interest.
This article is a PNAS Direct Submission.
This article contains supporting information online at www.pnas.org/lookup/suppl/doi:10.1073/pnas.1612520114/-/DCSupplemental.
References
- 1.USHHS . Bone Health and Osteoporosis: A Report of the Surgeon General. US Department of Health and Human Services OotSG; Rockville, MD: 2004. [Google Scholar]
- 2.Mackie EJ, Tatarczuch L, Mirams M. The skeleton: A multi-functional complex organ: The growth plate chondrocyte and endochondral ossification. J Endocrinol. 2011;211(2):109–121. doi: 10.1530/JOE-11-0048. [DOI] [PubMed] [Google Scholar]
- 3.Rachner TD, Khosla S, Hofbauer LC. Osteoporosis: Now and the future. Lancet. 2011;377(9773):1276–1287. doi: 10.1016/S0140-6736(10)62349-5. [DOI] [PMC free article] [PubMed] [Google Scholar]
- 4.St-Jacques B, Hammerschmidt M, McMahon AP. Indian hedgehog signaling regulates proliferation and differentiation of chondrocytes and is essential for bone formation. Genes Dev. 1999;13(16):2072–2086. doi: 10.1101/gad.13.16.2072. [DOI] [PMC free article] [PubMed] [Google Scholar]
- 5.Ye X, Liu A. Hedgehog signaling: Mechanism and evolution. Front Biol. 2011;6(6):504–521. [Google Scholar]
- 6.Pan Y, Wang B. A novel protein-processing domain in Gli2 and Gli3 differentially blocks complete protein degradation by the proteasome. J Biol Chem. 2007;282(15):10846–10852. doi: 10.1074/jbc.M608599200. [DOI] [PubMed] [Google Scholar]
- 7.Wang B, Fallon JF, Beachy PA. Hedgehog-regulated processing of Gli3 produces an anterior/posterior repressor gradient in the developing vertebrate limb. Cell. 2000;100(4):423–434. doi: 10.1016/s0092-8674(00)80678-9. [DOI] [PubMed] [Google Scholar]
- 8.Pan Y, Bai CB, Joyner AL, Wang B. Sonic hedgehog signaling regulates Gli2 transcriptional activity by suppressing its processing and degradation. Mol Cell Biol. 2006;26(9):3365–3377. doi: 10.1128/MCB.26.9.3365-3377.2006. [DOI] [PMC free article] [PubMed] [Google Scholar]
- 9.Miao D, et al. Impaired endochondral bone development and osteopenia in Gli2-deficient mice. Exp Cell Res. 2004;294(1):210–222. doi: 10.1016/j.yexcr.2003.10.021. [DOI] [PubMed] [Google Scholar]
- 10.Hilton MJ, Tu X, Cook J, Hu H, Long F. Ihh controls cartilage development by antagonizing Gli3, but requires additional effectors to regulate osteoblast and vascular development. Development. 2005;132(19):4339–4351. doi: 10.1242/dev.02025. [DOI] [PubMed] [Google Scholar]
- 11.Joeng KS, Long F. The Gli2 transcriptional activator is a crucial effector for Ihh signaling in osteoblast development and cartilage vascularization. Development. 2009;136(24):4177–4185. doi: 10.1242/dev.041624. [DOI] [PMC free article] [PubMed] [Google Scholar]
- 12.Long F, et al. Ihh signaling is directly required for the osteoblast lineage in the endochondral skeleton. Development. 2004;131(6):1309–1318. doi: 10.1242/dev.01006. [DOI] [PubMed] [Google Scholar]
- 13.Karp SJ, et al. Indian hedgehog coordinates endochondral bone growth and morphogenesis via parathyroid hormone related-protein-dependent and -independent pathways. Development. 2000;127(3):543–548. doi: 10.1242/dev.127.3.543. [DOI] [PubMed] [Google Scholar]
- 14.Mau E, et al. PTHrP regulates growth plate chondrocyte differentiation and proliferation in a Gli3 dependent manner utilizing hedgehog ligand dependent and independent mechanisms. Dev Biol. 2007;305(1):28–39. doi: 10.1016/j.ydbio.2007.01.031. [DOI] [PubMed] [Google Scholar]
- 15.Hsu SH, et al. Suppressor of fused (Sufu) mediates the effect of parathyroid hormone-like hormone (Pthlh) on chondrocyte differentiation in the growth plate. J Biol Chem. 2012;287(43):36222–36228. doi: 10.1074/jbc.M112.382275. [DOI] [PMC free article] [PubMed] [Google Scholar]
- 16.Long F, Zhang XM, Karp S, Yang Y, McMahon AP. Genetic manipulation of hedgehog signaling in the endochondral skeleton reveals a direct role in the regulation of chondrocyte proliferation. Development. 2001;128(24):5099–5108. doi: 10.1242/dev.128.24.5099. [DOI] [PubMed] [Google Scholar]
- 17.Mak KK, Kronenberg HM, Chuang PT, Mackem S, Yang Y. Indian hedgehog signals independently of PTHrP to promote chondrocyte hypertrophy. Development. 2008;135(11):1947–1956. doi: 10.1242/dev.018044. [DOI] [PMC free article] [PubMed] [Google Scholar]
- 18.Chen MH, et al. Cilium-independent regulation of Gli protein function by Sufu in Hedgehog signaling is evolutionarily conserved. Genes Dev. 2009;23(16):1910–1928. doi: 10.1101/gad.1794109. [DOI] [PMC free article] [PubMed] [Google Scholar]
- 19.Zhang Q, et al. Multiple Ser/Thr-rich degrons mediate the degradation of Ci/Gli by the Cul3-HIB/SPOP E3 ubiquitin ligase. Proc Natl Acad Sci USA. 2009;106(50):21191–21196. doi: 10.1073/pnas.0912008106. [DOI] [PMC free article] [PubMed] [Google Scholar]
- 20.Wang C, Pan Y, Wang B. Suppressor of fused and Spop regulate the stability, processing and function of Gli2 and Gli3 full-length activators but not their repressors. Development. 2010;137(12):2001–2009. doi: 10.1242/dev.052126. [DOI] [PMC free article] [PubMed] [Google Scholar]
- 21.Wen X, et al. Kinetics of hedgehog-dependent full-length Gli3 accumulation in primary cilia and subsequent degradation. Mol Cell Biol. 2010;30(8):1910–1922. doi: 10.1128/MCB.01089-09. [DOI] [PMC free article] [PubMed] [Google Scholar]
- 22.Kent D, Bush EW, Hooper JE. Roadkill attenuates Hedgehog responses through degradation of Cubitus interruptus. Development. 2006;133(10):2001–2010. doi: 10.1242/dev.02370. [DOI] [PubMed] [Google Scholar]
- 23.Zhang Q, et al. A hedgehog-induced BTB protein modulates hedgehog signaling by degrading Ci/Gli transcription factor. Dev Cell. 2006;10(6):719–729. doi: 10.1016/j.devcel.2006.05.004. [DOI] [PubMed] [Google Scholar]
- 24.Schwend T, et al. Stabilization of speckle-type POZ protein (Spop) by Daz interacting protein 1 (Dzip1) is essential for Gli turnover and the proper output of Hedgehog signaling. J Biol Chem. 2013;288(45):32809–32820. doi: 10.1074/jbc.M113.512962. [DOI] [PMC free article] [PubMed] [Google Scholar]
- 25.Claiborn KC, et al. Pcif1 modulates Pdx1 protein stability and pancreatic beta cell function and survival in mice. J Clin Invest. 2010;120(10):3713–3721. doi: 10.1172/JCI40440. [DOI] [PMC free article] [PubMed] [Google Scholar]
- 26.Errington WJ, et al. Adaptor protein self-assembly drives the control of a cullin-RING ubiquitin ligase. Structure. 2012;20(7):1141–1153. doi: 10.1016/j.str.2012.04.009. [DOI] [PubMed] [Google Scholar]
- 27.Temtamy SA, Aglan MS. Brachydactyly. Orphanet J Rare Dis. 2008;3:15. doi: 10.1186/1750-1172-3-15. [DOI] [PMC free article] [PubMed] [Google Scholar]
- 28.Long F. Building strong bones: Molecular regulation of the osteoblast lineage. Nat Rev Mol Cell Biol. 2012;13(1):27–38. doi: 10.1038/nrm3254. [DOI] [PubMed] [Google Scholar]
- 29.Pierce WK, et al. Multiple weak linear motifs enhance recruitment and processivity in SPOP-mediated substrate ubiquitination. J Mol Biol. 2016;428(6):1256–1271. doi: 10.1016/j.jmb.2015.10.002. [DOI] [PMC free article] [PubMed] [Google Scholar]
- 30.Zhuang M, et al. Structures of SPOP-substrate complexes: Insights into molecular architectures of BTB-Cul3 ubiquitin ligases. Mol Cell. 2009;36(1):39–50. doi: 10.1016/j.molcel.2009.09.022. [DOI] [PMC free article] [PubMed] [Google Scholar]
- 31.Bai CB, Joyner AL. Gli1 can rescue the in vivo function of Gli2. Development. 2001;128(24):5161–5172. doi: 10.1242/dev.128.24.5161. [DOI] [PubMed] [Google Scholar]
- 32.Buscher D, Grotewold L, Ruther U. The XtJ allele generates a Gli3 fusion transcript. Mamm Genome. 1998;9(8):676–678. doi: 10.1007/s003359900845. [DOI] [PubMed] [Google Scholar]
- 33.Lakso M, et al. Efficient in vivo manipulation of mouse genomic sequences at the zygote stage. Proc Natl Acad Sci USA. 1996;93(12):5860–5865. doi: 10.1073/pnas.93.12.5860. [DOI] [PMC free article] [PubMed] [Google Scholar]
- 34.Logan M, et al. Expression of Cre Recombinase in the developing mouse limb bud driven by a Prxl enhancer. Genesis. 2002;33(2):77–80. doi: 10.1002/gene.10092. [DOI] [PubMed] [Google Scholar]
- 35.Oro AE, Higgins K. Hair cycle regulation of Hedgehog signal reception. Dev Biol. 2003;255(2):238–248. doi: 10.1016/s0012-1606(02)00042-8. [DOI] [PubMed] [Google Scholar]
- 36.Liu J, Liu A. Immunohistochemistry and RNA in situ hybridization in mouse brain development. Methods Mol Biol. 2014;1082:269–283. doi: 10.1007/978-1-62703-655-9_18. [DOI] [PubMed] [Google Scholar]


