Significance
Glioblastoma, the most common primary malignant brain tumor in adults, remains challenging despite multimodality therapy, necessitating the discovery of new therapies. Nicotinamide adenine dinucleotide (NAD+) plays a pivotal role in cancer cell metabolism, but how NAD+ impacts functional signaling events in glioblastoma is not well understood. We provide clinical evidence that high expression of NAMPT, the rate-limiting step in NAD+ biosynthesis, in glioblastoma tumors is associated with poor overall survival in patients, and demonstrate NAMPT and NAD+ are required for the maintenance of patient-derived glioblastoma stem-like cells (GSCs). Moreover, we delineate a NAD+-dependent transcriptional program that governs GSC self-renewal and dictates the radiation resistance of these cells. These findings identify potential new therapeutic avenues for the treatment of glioblastoma.
Keywords: glioblastoma, NAMPT, NAD+, self-renewal, radiation resistance
Abstract
Accumulating evidence suggests cancer cells exhibit a dependency on metabolic pathways regulated by nicotinamide adenine dinucleotide (NAD+). Nevertheless, how the regulation of this metabolic cofactor interfaces with signal transduction networks remains poorly understood in glioblastoma. Here, we report nicotinamide phosphoribosyltransferase (NAMPT), the rate-limiting step in NAD+ synthesis, is highly expressed in glioblastoma tumors and patient-derived glioblastoma stem-like cells (GSCs). High NAMPT expression in tumors correlates with decreased patient survival. Pharmacological and genetic inhibition of NAMPT decreased NAD+ levels and GSC self-renewal capacity, and NAMPT knockdown inhibited the in vivo tumorigenicity of GSCs. Regulatory network analysis of RNA sequencing data using GSCs treated with NAMPT inhibitor identified transcription factor E2F2 as the center of a transcriptional hub in the NAD+-dependent network. Accordingly, we demonstrate E2F2 is required for GSC self-renewal. Downstream, E2F2 drives the transcription of members of the inhibitor of differentiation (ID) helix–loop–helix gene family. Finally, we find NAMPT mediates GSC radiation resistance. The identification of a NAMPT-E2F2-ID axis establishes a link between NAD+ metabolism and a self-renewal transcriptional program in glioblastoma, with therapeutic implications for this formidable cancer.
The prognosis for glioblastoma, the most common malignant intrinsic brain tumor in adults, remains poor despite aggressive multidisciplinary therapy, including maximal safe surgical resection, radiation therapy, and temozolomide (1, 2). The failure of these interventions to generate a durable response stems in part from inadequate understanding of the metabolic and molecular mechanisms underlying malignant behavior and therapeutic resistance (3, 4). Nicotinamide adenine dinucleotide (NAD+) has a well-known role in cellular metabolism and is an important cofactor for signaling pathways that regulate aging, inflammation, diabetes mellitus, axonal injury, and cancer (5, 6). Nicotinamide phosphoribosyltransferase (NAMPT), the rate-limiting enzyme in mammalian NAD+ synthesis, produces NAD+ precursor nicotinamide mononucleotide (NMN) to drive NAD+-dependent processes. Interestingly, NAMPT expression is extremely low in the mammalian brain compared with other organs (7, 8). However, NAMPT is highly expressed in several cancers, and features of cancer cells, including proliferation, invasion, and tumor growth, exhibit a dependence on NAD+ (9–11). In noncancer cells, NAD+ plays a critical role in transcriptional control, providing a metabolic basis for epigenetic reprogramming (12–16). Enzymes using NAD+ as a cofactor, including the sirtuins and poly-ADP ribosyl transferases, regulate transcription factor activity and chromatin structure (13–15). Additionally, NAD+ can control transcription by altering DNA methylation in neurons (12). However, in glioblastoma, little is known about NAD+-dependent transcriptional events and whether these events impact malignant behavior and therapy response.
Here, we examine the role of NAD+ regulation and NAD+-dependent transcription in glioblastoma. We demonstrate NAMPT is highly expressed in glioblastoma tumors compared with normal brain tissue. NAMPT inhibition disrupts the self-renewal and in vivo tumorigenicity of human glioblastoma stem-like cells (GSCs), a therapy-resistant cancer subpopulation. Importantly, we identify key regulators of GSC self-renewal in the NAD+-dependent transcriptional program and further examine their role in radiation resistance.
Results
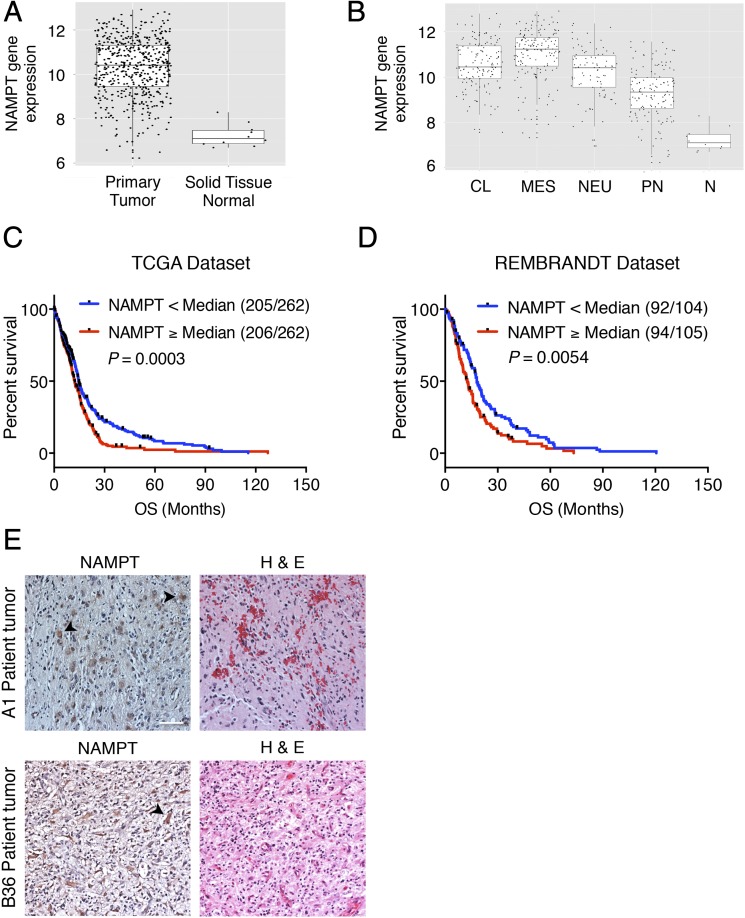
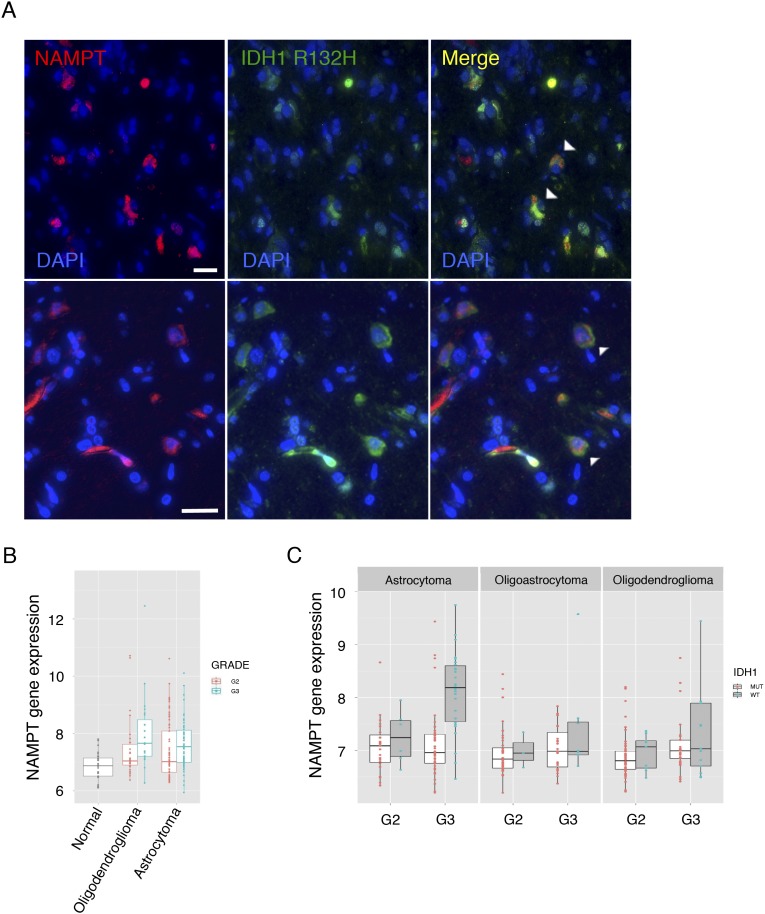
We first asked if the major regulator of the cellular NAD+ pool, NAMPT, has clinical relevance in glioblastoma by interrogating expression data in The Cancer Genome Atlas (TCGA). We found NAMPT mRNA is up-regulated in glioblastoma tumors generally and in tumors of all four molecular subtypes compared with normal brain (Fig. 1 A and B). We then divided TCGA glioblastoma patients into high and low NAMPT mRNA groups and found that patients with high NAMPT-expressing tumors exhibited a shorter overall survival (Fig. 1C). An independent dataset, REMBRANDT, revealed a similar inverse correlation between tumor NAMPT expression and patient survival (Fig. 1D). NAMPT protein was observed in tumor cells by immunohistochemistry in both IDH1 WT and mutant glioblastoma tumor sections (Fig. 1E and Fig. S1A). We found NAMPT expression was also increased in grade 2 and 3 gliomas compared with normal brain (REMBRANDT; Fig. S1B) and that IDH1 mutant and WT tumors of matched grade and histopathology did not significantly differ in NAMPT expression with the exception of grade 3 astrocytomas, which exhibited higher NAMPT expression in IDH1 WT tumors (TCGA; Fig. S1C). Collectively, these data suggest a potential cell-intrinsic role for NAMPT in glioblastoma and potentially more broadly in gliomas.
Fig. 1.
NAMPT is highly expressed in glioblastoma tumors and its expression has prognostic value in glioblastoma patients. (A) Box plot for NAMPT mRNA expression in glioblastoma (n = 529) and normal brain tissue samples (n = 10) from TCGA (unpaired t test, P = 1.40 × 10⁻⁹). (B) Box plots for NAMPT mRNA expression demonstrate high NAMPT expression in all four molecular subtypes of glioblastoma in TCGA microarray samples compared with normal brain tissue. (C) Kaplan–Meier curves show overall survival (OS) from 524 newly diagnosed glioblastoma patients in TCGA based on NAMPT expression. Patients with high NAMPT-expressing tumors (greater than or equal to the median) exhibited decreased OS (log-rank test, P = 0.0003). Numbers in parentheses represent number of events/total patients with molecular data. (D) Kaplan–Meier curves show OS from 209 glioblastoma patients from the REMBRANDT dataset as in C. Patients with high NAMPT-expressing tumors (greater than or equal to the median) exhibited decreased OS (log-rank test, P = 0.0014). (E) Formalin-fixed, paraffin-embedded 10-μm sections from two glioblastoma patients were subjected to NAMPT immunohistochemistry (Left) and hematoxylin and eosin staining (Right). Glioblastoma cells (arrowhead) demonstrate NAMPT protein expression. CL, classical; H & E, hematoxylin and eosin staining; MES, mesenchymal; N, normal; NEU, neural; PN, proneural. (Scale bar: 50 μm.)
Fig. S1.
NAMPT protein is expressed in IDH1-mutant glioblastoma cells. NAMPT mRNA expression is elevated in grade 2 and 3 gliomas. (A) Formalin-fixed paraffin-embedded sections from an IDH1 mutant glioblastoma were subjected to immunofluorescence labeling using antibodies to indicated antigens (DAPI, nuclear label). Arrowheads indicate examples of NAMPT and IDH1 mutation colabeled cells, indicating that NAMPT protein is definitively expressed in tumor cells. (Scale bar: 25 μM.) (B) Box plot for NAMPT mRNA expression (REMBRANDT, probe 1555167_s_at) demonstrates higher NAMPT expression in grade 2 and grade 3 gliomas compared with normal brain tissue (t test; P = 0.00012 and P = 1.91E-08 for grade 2 and 3, respectively). (C) TCGA RNA seq v2 data revealed little difference between IDH1 mutant and WT tumors matched for grade and histology except for grade 3 astrocytoma, which showed higher levels of NAMPT in IDH1 WT vs. mutant tumors (t test; P = 2.64E-06).
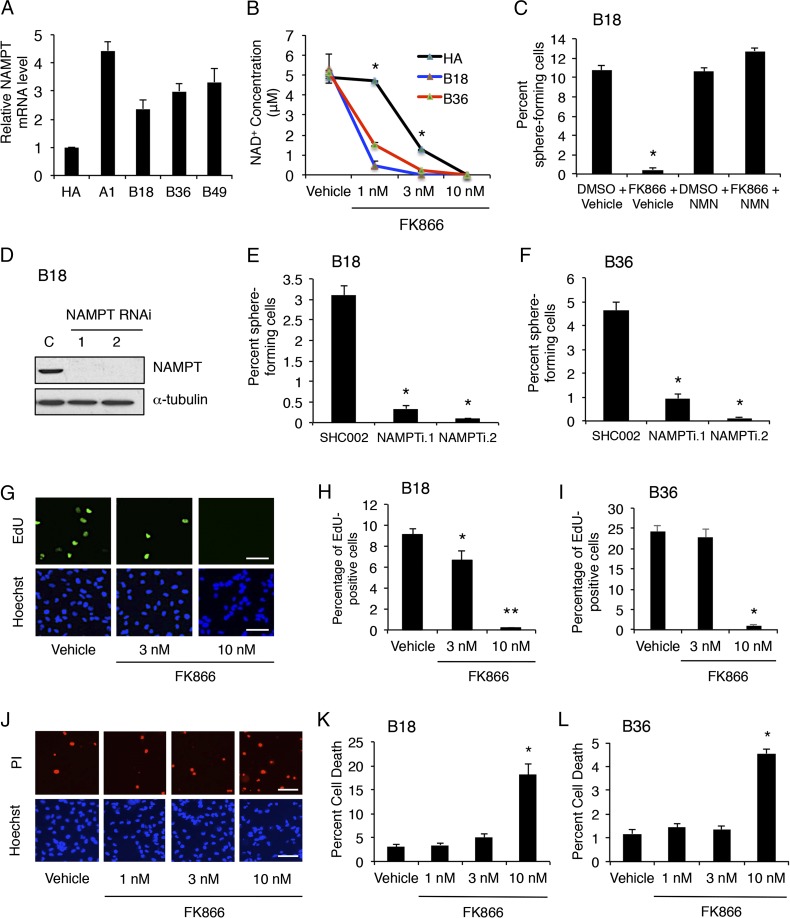
We have described a human model system for the functional analysis of glioblastoma cells using patient-derived specimens (17). These primary glioblastoma cells, also referred to as GSCs, exhibit the ability to self-renew in vitro and form invasive brain tumors in immunocompromised mice in vivo, providing a robust human model system (17). As in bulk tumors, we observed high NAMPT expression in four GSC lines compared with human astrocytes by quantitative real-time PCR (qPCR) (Fig. 2A and Fig. S2 A–C). Using a specific pharmacological inhibitor of NAMPT, FK866, we examined the biological role of NAMPT in GSC self-renewal, a defining characteristic of GSCs, which often parallels tumor-initiating potential (18). Treatment of GSC lines B18 and B36 with FK866 in vitro decreased NAD+ levels in a dose-dependent fashion (Fig. 2B). Using the extreme-limiting dilution assay (ELDA), we found exposure to NAMPT inhibitor decreased GSC self-renewal capacity in a manner reversible by addition of NMN, the product of NAMPT (Fig. 2C and Fig. S2D). An alternative approach using lentiviral shRNAs targeting two distinct regions in the NAMPT gene decreased both NAMPT protein and NAD+ levels in GSCs (Fig. 2D and Fig. S2 E and F). Importantly, NAMPT RNAi also decreased the frequency of sphere-forming GSCs, indicating NAMPT is essential for GSC self-renewal (Fig. 2 E and F).
Fig. 2.
NAMPT regulates GSC self-renewal capacity. (A) RNA was isolated from GSCs or HA, and qPCR performed using GAPDH and ACTB as reference genes. Data represent mean + SEM. GSC lines express higher levels of NAMPT vs. HA (ANOVA, P < 0.0001 for A1, P < 0.02 for B18, and P < 0.005 for B36 and B49). (B) HA and GSC lines treated with FK866 or vehicle for 3 d were subjected to HPLC analysis to determine NAD+ concentrations. Data represent mean ± SEM. GSCs showed higher sensitivity to FK866 compared with HA (ANOVA, *P < 0.0001). (C) GSCs treated as indicated were subjected to ELDA. At 14 d later, the number of wells with spheres was analyzed. Data represent mean + SEM. FK866 decreased GSC self-renewal in a manner reversible by NMN (ANOVA, *P < 0.0001). (D) GSCs transduced with two distinct NAMPT RNAi or control scrambled SHC002 (C) lentiviruses were selected with puromycin. At 7 d later, lysates were processed for immunoblotting. (E and F) GSCs treated as in D were subjected to ELDA 3 d after transduction as in C. Data represent mean + SEM. NAMPT knockdown decreased the percentage of self-renewing GSCs compared with control SHC002 (ANOVA, *P < 0.0001). (G) GSCs were treated with FK866 or vehicle for 4 d and then labeled with EdU and Hoechst 33342. (Scale bar: 100 μm.) (H) Quantification of EdU-positive cells from G. Data represent mean + SEM. FK866 triggered a dose-dependent decrease in cell proliferation (ANOVA, *P = 0.01 and **P < 0.0001). (I) GSCs treated as in G were quantified as in H (ANOVA, *P < 0.0001). (J) GSCs were treated with FK866 or vehicle for 4 d and then subjected to the propidium iodide (PI) exclusion assay and Hoechst 33342. (Scale bar: 100 μm.) (K) Quantification of PI-positive cells from J. Data represent mean + SEM. FK866 triggered cell death in GSCs at 10 nM (ANOVA, *P < 0.0001). (L) GSCs treated as in J were analyzed as in K (ANOVA, *P < 0.0001).
Fig. S2.
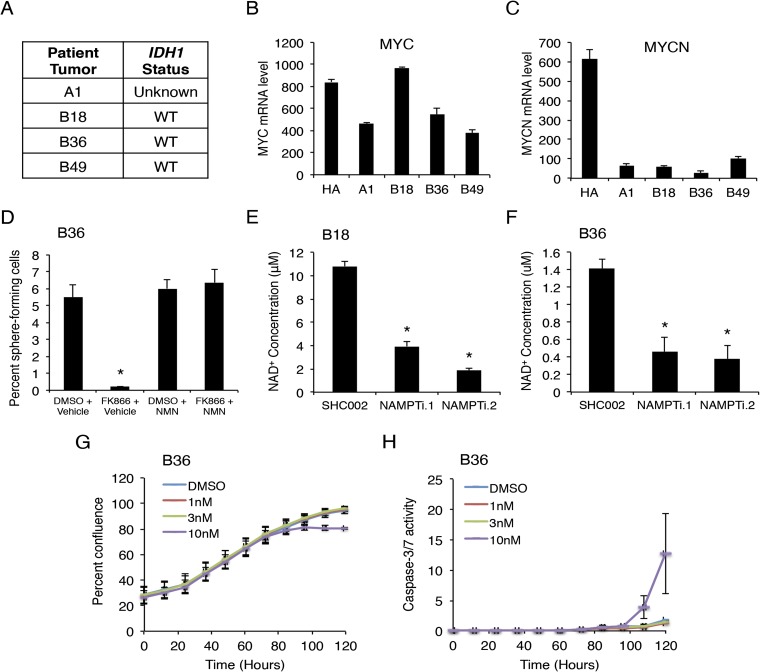
Baseline characteristics of GSCs. NAMPT inhibition decreases NAD+ levels and affects cell growth and death. (A) IDH1 status of patient tumor specimens is shown according to IDH1 R132H immunohistochemistry. (B) MYC mRNA expression in HAs and GSCs was determined by microarray analysis (n = 2). (C) MYCN mRNA levels in indicated cells were determined by microarray analysis (n = 2). (D) GSCs treated as indicated were subjected to ELDA. At 14 d later, the number of wells with spheres was analyzed. Data represent mean + SEM. FK866 decreased GSC self-renewal in a manner reversible by NMN (ANOVA, *P < 0.0001). (E) GSCs were transduced with two distinct NAMPT shRNA or control scrambled (SHC002) lentiviruses and selected with puromycin. Cell extracts were prepared 7 d later and subjected to HPLC analysis to determine NAD+ concentrations. Data represent mean + SEM. NAMPT knockdown decreased NAD+ levels in GSCs. (ANOVA, *P < 0.0001). (F) GSCs treated as in E were subjected to HPLC analysis for NAD+ concentration measurement. Data represent mean + SEM. NAMPT knockdown decreased NAD+ levels in GSCs. (ANOVA, *P = 0.002). (G) GSCs were treated with indicated concentrations of FK866 and subjected to live cell imaging using IncuCyte ZOOM System. Percent confluence values were obtained from the software and plotted. Data represent mean ± SEM (n = 3 independent experiments). (H) GSCs were treated with FK866 as in G and caspase-3/7 assay reagent and subjected to live cell imaging as in G. Caspase-3/7 activity values were plotted. Data represent mean ± SEM (n = 3 independent experiments).
Because the phenomenon of self-renewal represents an integration of a number of distinct cellular events, we asked if NAMPT regulates GSC proliferation or survival (Fig. 2 G–L). EdU incorporation experiments demonstrated FK866 inhibits the proliferation of B18 GSCs at 3 nM and of both GSC lines at 10 nM (Fig. 2 G–I). The 10 nM FK866 triggered 18% and 4.5% cell death in B18 and B36 GSCs, respectively, with little to no cell death at lower concentrations (Fig. 2 J–L). Time-lapse images of B36 GSCs following FK866 treatment showed a plateau in cell number at ∼85 h, followed by an increase in caspase-3/7 activity 10 h later, suggesting proliferation is more sensitive to declining NAD+ levels compared with survival (Fig. S2 G and H). Together, these data indicate NAMPT controls GSC self-renewal by regulating both cell proliferation and survival.
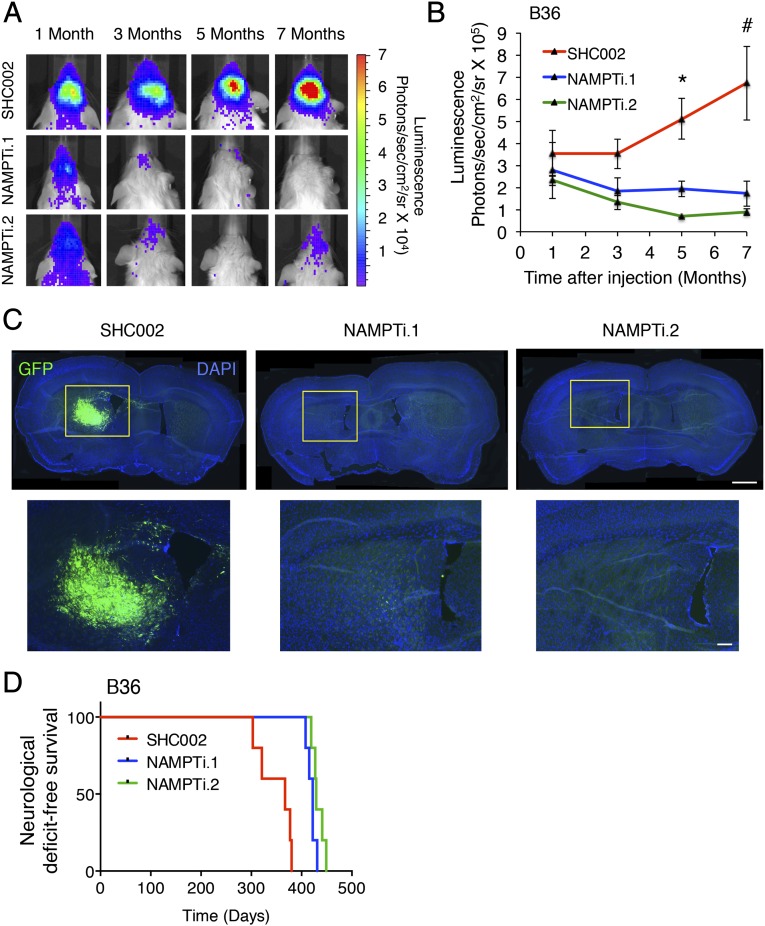
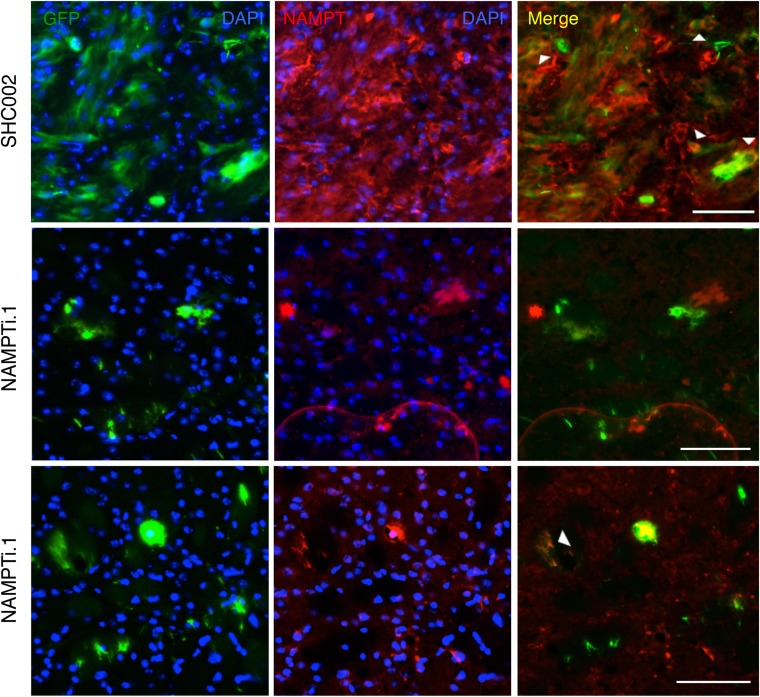
To determine if NAMPT is required to propagate tumors in vivo, we generated a B36 GSC line stably expressing GFP-T2A-luciferase, enabling GFP immunofluorescence as well as bioluminescence imaging (BLI) in live animals to assess tumor burden. GSCs infected with two distinct NAMPT RNAi were injected into the brains of NOD-SCIDγ mice, and BLI was performed on these animals over time (Fig. 3A). NAMPT knockdown inhibited brain tumor formation by both BLI and GFP immunofluorescence in brain sections (Fig. 3 A–C). Importantly, mice bearing NAMPT knockdown GSCs exhibited increased survival compared with mice bearing control-infected GSCs, indicating NAMPT is critical for the in vivo tumorigenicity of GSCs (Fig. 3D). To determine if the eventual neurological deficit or death in animals injected with NAMPT RNAi GSCs might be the consequence of failure to completely silence NAMPT expression in tumor cells (as has been reported with other RNAi manipulations) (19), we performed coimmunolabeling for GFP and NAMPT in NAMPT RNAi and control tumors. Indeed, we observed occasional NAMPT+ cells in tumor cells arising from NAMPT RNAi-infected GSCs at 12 mo (Fig. S3).
Fig. 3.
NAMPT is critical for GSC tumorigenicity in vivo. (A) B36 GSCs stably infected with GFP-T2A-luciferase lentivirus were transduced with indicated lentiviruses and injected into the right putamen of NOD-SCIDγ mice. Injected animals were subjected to live BLI. Representative animals at indicated time points after injection are shown (n = 5 animals per condition). (B) Quantification of BLI signals from animals in A. Data represent mean ± SEM. NAMPT knockdown decreased GSC tumorigenicity compared with control SHC002 (ANOVA, *P = 0.001 and *P < 0.0001 vs. NAMPTi.1 and NAMPTi.2, respectively; #P = 0.004 and #P = 0.001 vs. NAMPTi.1 and NAMPTi.2, respectively; n = 5 animals per condition). (C) Animals bearing intracranial B36 GSCs as in A were killed after 12 mo, and 10-μm-thick brain sections were subjected to GFP immunofluorescence. Nuclei were stained with DAPI. Representative coronal brain sections are shown. (Scale bar: Upper, 100 μm; Lower, 250 μm.) (D) Kaplan–Meier curves demonstrated increased neurological deficit-free survival in animals bearing NAMPT knockdown GSCs compared with those bearing control SHC002-infected GSCs treated as in A (log-rank test, P = 0.0002; n = 4 animals per condition).
Fig. S3.
Rare NAMPT expression in tumor cells in animals injected with NAMPT-knockdown GSCs. B36 GSCs stably infected with GFP-T2A-luciferase lentivirus were transduced with indicated lentiviruses and injected into the right putamen of NOD-SCIDγ mice. Animals were killed after 12 mo, and 10-μm-thick brain sections were subjected to immunofluorescence using antibodies against indicated antigens. Nuclei were stained with DAPI. Representative images of sections are shown. Arrowheads indicate examples of NAMPT and GFP colabeled cells. (Scale bar: 75 μM.)
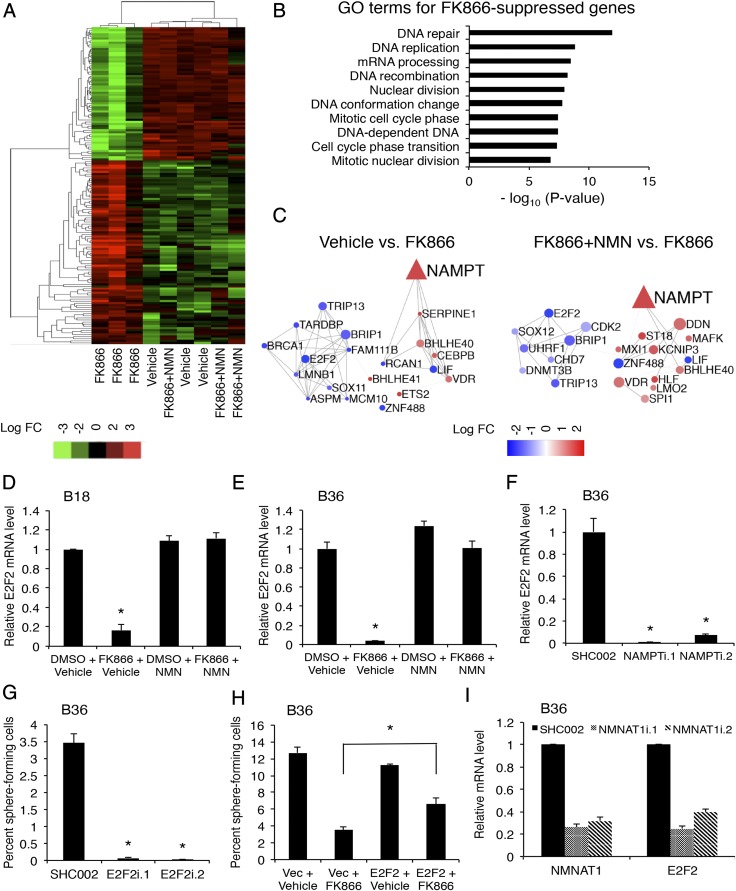
We next wanted to understand the mechanism of how NAMPT governs GSC maintenance. Because NAD+ is known to control transcription in other cellular contexts, we examined the global transcriptional consequences of NAD+ depletion in GSCs. GSCs were exposed to FK866 with or without NMN and subjected to RNA-sequencing (RNA-seq). NAMPT inhibition altered the levels of 581 protein-coding genes, with 307 down-regulated genes (52.8%; Fig. 4A and Dataset S1). No significant changes in the transcriptome were observed between vehicle- and FK866 plus NMN-treated GSCs (Fig. 4A). Gene ontogeny analysis of genes down-regulated by NAMPT inhibitor demonstrated enrichment in processes related to DNA repair and replication, nuclear division, and cell cycle phase transition, consistent with the role of NAMPT in GSC self-renewal and tumor growth (Fig. 4B). To identify critical nodes within the NAD+-driven transcriptional network, we used two parallel bioinformatics approaches. We used regulatory network analysis—Algorithm for the Reconstruction of Accurate Cellular Networks (ARACNe)—with the 169 RNA-seq glioblastoma datasets in TCGA to first build a transcriptional network and then generated NAMPT-regulated subnetworks by extracting network connections containing significantly altered transcripts in FK866-treated glioblastoma cells (Fig. 4C and Tables S1 and S2) (20). Genes predicted to be master regulators would be hypothesized to exhibit a change in transcript levels and also have a high number of connections with other genes in the network (Tables S1 and S2). Among these genes, transcription factor E2F2 was notable as having the highest number of connections in the FK866 treatment subnetwork, suggesting an important transcriptional hub. In parallel, with the same NAMPT-dependent RNA-seq data, we used iRegulon to detect transcription factors and their targets, with the goal of identifying transcription factors with a high number of targets within the same dataset and therefore more likely to represent an upstream regulator of the NAMPT-dependent transcriptional program (21). A DNA motif-based algorithm again identified E2F2 as the most significant, differentially expressed transcription factor with 383 putative targets in the NAMPT-dependent RNA dataset. We therefore focused on E2F2 as a potential critical upstream transcription factor controlling the NAD+-dependent transcriptional network. We verified in GSCs that both FK866 and NAMPT knockdown dramatically decrease E2F2 levels in a manner reversible by NMN (Fig. 4 D–F and Fig. S4A).
Fig. 4.
NAMPT regulates E2F2. (A) B18 GSCs were treated with 100 nM FK866 with or without 1 mM NMN for 3 d. RNA was isolated from cells and subjected to RNA-sequencing (RNA-seq). Differentially expressed genes in the RNA-seq dataset with more than eightfold change between maximum and minimum values (total 155 genes) were subjected to hierarchical clustering to generate a heat map. (B) Gene Ontology (GO) analysis of the RNA-seq data was performed using R/Bioconductor package GAGE. The top 10 processes enriched in the FK866-suppressed gene set are shown. (C) Transcriptional networks were generated from RNA-seq data from TCGA glioblastoma dataset by ARACNe and NAMPT-dependent subnetworks extracted (n = 169). The size of a node denotes the number of connections or edges (except for NAMPT). The color of a node denotes the logFC with FK866 (red, up-regulated; blue, down-regulated). (D and E) GSCs were treated as in A; total RNA was extracted and qPCR performed using primers specific to E2F2. Data represent mean + SEM (ANOVA, *P < 0.0001). (F) GSCs were transduced with indicated lentiviruses and selected with puromycin. At 7 d after infection, RNA was isolated to determine E2F2 mRNA levels as in D. Data represent mean + SEM (ANOVA, *P < 0.0001). (G) B36 GSCs transduced with indicated lentiviruses and selected with puromycin for 2 d were subjected to ELDA as in Fig. 2C. Data represent mean + SEM. E2F2 knockdown decreased GSC self-renewal (ANOVA, *P < 0.0001). (H) GSCs infected with E2F2-overexpressing (or control vector) lentiviruses were subjected to ELDA as in Fig. 2C in the presence of FK866 (3 nM) or vehicle. Data represent mean + SEM. FK866 decreased self-renewal compared with vehicle (ANOVA, P < 0.0001). Expression of E2F2 plus FK866 increased self-renewal compared with infection with Vec plus FK866 (ANOVA, *P = 0.005). (I) RNA was extracted from GSCs transduced with the indicated lentiviruses 5 d postinfection, and qPCR was performed using indicated primers. Data represent mean + SEM. NMNAT1 knockdown decreased E2F2 mRNA levels (ANOVA, P < 0.0001).
Table S1.
The top five differentially expressed genes after FK866 treatment and the number of connections each has in the network generated by ARACNe analysis as in Fig. 4C
| Gene | LogFC | No. of connections |
| FAM111B | −3.39 | 20 |
| LIF | −3.33 | 35 |
| ZNF488 | −2.57 | 27 |
| E2F2 | −2.33 | 39 |
| RCAN1 | −1.72 | 21 |
Table S2.
The top five differentially expressed genes between FK866+NMN vs. FK866 and the number of connections they have in the network generated by ARACNe analysis as in Fig. 4C
| Gene | LogFC | No. of connections |
| ZNF488 | −2.57 | 87 |
| E2F2 | −2.33 | 78 |
| TRIP13 | −1.30 | 73 |
| BRIP1 | −1.25 | 91 |
| UHRF1 | −1.12 | 73 |
Fig. S4.
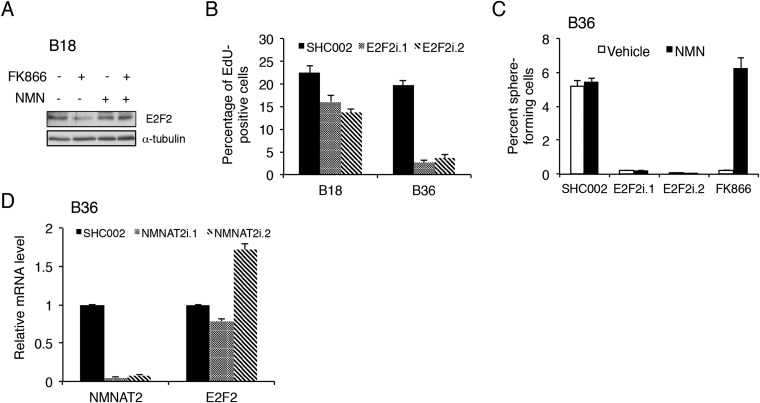
E2F2 acts downstream of NAMPT to regulate GSC proliferation and self-renewal. (A) B18 GSCs were treated with 100 nM FK866 with or without 1 mM NMN for 3 d. Lysates from GSCs were processed for immunoblotting using indicated antibodies. (B) GSCs were transduced with two distinct E2F2 RNAi (or control SHC002) lentiviruses and then labeled with EdU and Hoechst 33342. Quantification of percent EdU-positive cells is shown. Data represent mean + SEM. E2F2 knockdown decreased the percentage of EdU-positive cells (ANOVA, *P < 0.005 and *P < 0.0001 in B18 and B36, respectively). (C) GSCs transduced with indicated lentiviruses or FK866 (3 nM) with or without NMN (1 mM) were subjected to ELDA as in Fig. 2C. Data represent mean + SEM. E2F2 knockdown and FK866 decreased GSC self-renewal (ANOVA, *P < 0.0001). The FK866-induced, but not the E2F2 RNAi-induced, decrease in self-renewal was reversed by NMN treatment (ANOVA, *P < 0.0001). (D) RNA was extracted from GSCs transduced with the indicated lentiviruses 5 d postinfection, and qPCR was performed by using indicated primers. Data represent mean + SEM.
To test the functional significance of E2F2 in glioblastoma, we transduced GSCs with two lentiviral shRNAs targeting E2F2 and subjected them to the extreme-limiting dilution assay. E2F2 knockdown reduced GSC self-renewal capacity and proliferation, consistent with the effects of NAMPT inhibition (Fig. 4G and Fig. S4B). To determine if E2F2 lies functionally downstream of NAMPT, we performed epistasis experiments combining NAMPT inhibitor with E2F2 overexpression (Fig. 4H). FK866 inhibited the self-renewal capacity of GSCs, which was partially but significantly rescued by E2F2 overexpression, suggesting E2F2 acts downstream of NAMPT. Consistent with this linear order, NMN could not rescue the self-renewal deficit triggered by E2F2 RNAi (Fig. S4C). To determine the mechanism by which NAMPT regulates E2F2 expression, we examined the nicotinamide mononucleotide adenylyltransferases (NMNATs), a family of catalytic enzymes that convert NMN to NAD+ with a particular focus on NMNAT1, which is localized to the nucleus and is responsible for generating the nuclear NAD+ pool (22). Knockdown of NMNAT1, but not of the related Golgi-resident family member NMNAT2, effectively decreased E2F2 mRNA levels, indicating NMNAT1 links NAMPT to E2F2 expression (Fig. 4I and Fig. S4D).
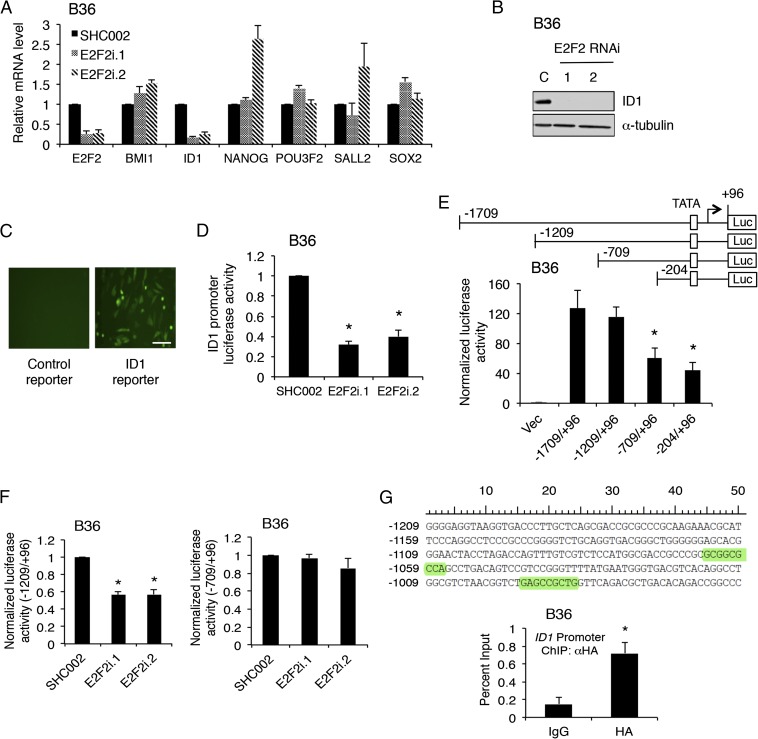
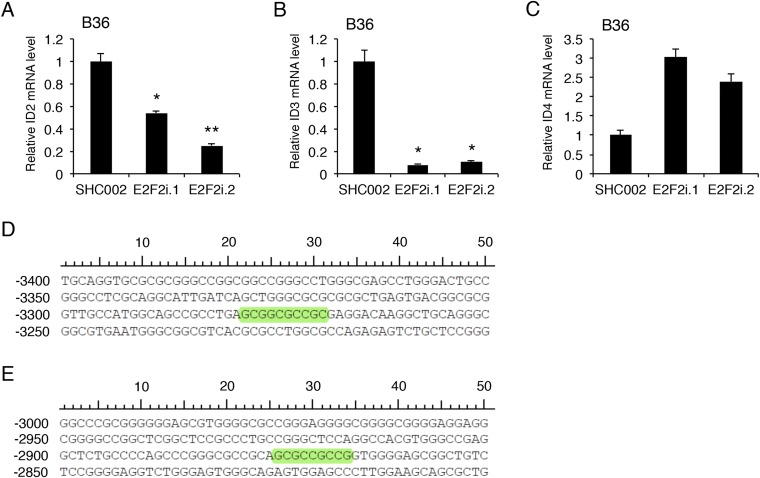
To determine the downstream mechanism of E2F2 in GSCs, we performed a candidate-based miniscreen for possible E2F2 targets by examining a set of genes known to be associated with self-renewal following E2F2 RNAi in GSCs (Fig. 5A) (18, 23–25). Among these genes, E2F2 RNAi consistently decreased the levels of helix–loop–helix gene inhibitor of differentiation 1 (ID1) (Fig. 5A). E2F2 knockdown also decreased ID1 protein levels in GSCs (Fig. 5B). Because the ID proteins represent a family of four members, we asked if E2F2 more generally controlled expression of the ID gene family. E2F2 RNAi decreased mRNA levels of ID1, ID2, and ID3, but not ID4, suggesting E2F2 may transcriptionally activate ID1–3 (Fig. S5 A–C). To test if ID genes are direct targets of E2F2, we focused on ID1 as a representative family member and generated an ID1 promoter reporter encoding GFP-T2A-luciferase driven by a previously reported 2-kb sequence upstream of the ID1 transcription start site (TSS) (26). Transduction of the ID1 reporter in GSCs generated a robust GFP and luciferase signal compared with control (Fig. 5C). E2F2 RNAi diminished ID1 reporter activity, indicating endogenous E2F2 regulates the ID1 promoter (Fig. 5D). Deletion analysis revealed a substantial decrease in ID1 promoter activity when removing the sequence spanning −1209 to −709 from the TSS (Fig. 5E). E2F2 RNAi decreased the activity of the −1209/+96 ID1 reporter but had no effect on the −709/+96 reporter, suggesting an E2F2-binding site exists between −1209 and −709 (Fig. 5F). Examination of the genomic sequence in this region revealed two evolutionarily conserved E2F2 motifs (Fig. 5G). Indeed, similar E2F2 binding sites were found in evolutionarily conserved regions of the promoters for both ID2 and ID3 but not ID4 (Fig. S5 D and E). To test if E2F2 directly binds the ID1 promoter at this locus, we performed ChIP using GSCs stably expressing HA epitope-tagged E2F2. Anti-HA ChIP followed by qPCR using primers specific to the ID1 promoter region harboring the predicted E2F2 sites demonstrated E2F2 directly binds to the ID1 promoter in GSCs (Fig. 5G). Together, these results indicate E2F2 directly controls ID1 transcription in human GSCs.
Fig. 5.
E2F2 is required for GSC self-renewal and directly regulates ID1. (A) RNA was extracted from GSCs transduced with the indicated lentiviruses 7 d after infection, and qPCR was performed using indicated primers. Data represent mean + SEM. E2F2 knockdown reduced ID1 mRNA levels (ANOVA, P < 0.0001). (B) GSCs treated as in A were processed for immunoblotting. (C) B36 GSCs were stably infected with ID1 promoter-driven GFP-T2A-luciferase reporter or promoterless control (pGreenfire1). (Scale bar: 50 μm.) (D) GSCs stably expressing ID1 reporter as in D were transduced with indicated lentiviruses and subjected to luciferase assay after 7 d. Luciferase values were normalized by total protein (control SHC002 = 1). Data represent mean + SEM. E2F2 knockdown decreased ID1 reporter activity (ANOVA, *P < 0.005). (E, Upper) Schematic depicting ID1 promoter deletions. (E, Lower) Indicated ID1 promoter-Firefly luciferase plasmids (pGL2 basic) were transfected into GSCs along with Renilla-expressing plasmid. At 36 h later, cells were assayed for luciferase activity. Luciferase values were divided by Renilla values and normalized to the activity of the control vector (=1). Data represent mean + SEM. ID1 promoter activity was significantly diminished in the −709/+96 and −204/+96 reporters compared with the −1709/+96 reporter (ANOVA, *P < 0.01). (F) GSCs stably infected with either −1209/+96 (Left) or −709/+96 (Right) ID1 promoter reporter lentiviruses were transduced with the indicated lentiviruses and subjected to luciferase assay as in E after 7 d. Data represent mean + SEM. E2F2 knockdown decreased −1209/+96 but not −709/+96 ID1 reporter activity (ANOVA, *P < 0.0001). (G, Upper) Evolutionarily conserved E2F2 motifs among seven mammals between −1209 and −1009 from the TSS of the ID1 gene are highlighted. (G, Lower) GSCs were transduced with lentiviruses expressing HA-tagged E2F2 and processed for ChIP using anti-HA or isotype control antibody. Primers specific for the genomic region from −1209 to −1009 from the ID1 TSS were then used for qPCR, and values plotted as percent input. Data represent mean + SEM. HA-E2F2 ChIP-qPCR significantly enriched for the ID1 promoter compared with control ChIP-qPCR (unpaired t test, *P = 0.007; n = 4).
Fig. S5.
E2F2 regulates ID2 and ID3 mRNA expression in GSCs. (A) GSCs were transduced with two distinct E2F2 RNAi or control SHC002 lentiviruses and selected with puromycin. At 7 d after infection, RNA was isolated and qPCR was performed using primers specific to ID2. GAPDH and ACTB were used as reference genes. Data represent mean + SEM (ANOVA, *P = 0.009 and **P = 0.001). (B) GSCs treated as in A were subjected to qPCR using primers specific to ID3 and reference genes as in A. Data represent mean + SEM (ANOVA, *P < 0.0001; n = 3 independent experiments). (C) GSCs treated as in A were subjected to qPCR using primers specific to ID4 and reference genes as in A. Data represent mean + SEM. (D) Evolutionarily conserved E2F2 binding site (highlighted) within 3.5 kb upstream of the ID2 TSS. The ECR browser was used to identify evolutionarily conserved regions among mammalian species, and rVista was then used to predict putative E2F2 binding sites within this region (JASPAR). (E) Evolutionarily conserved E2F2 binding site (highlighted) within 3.5 kb upstream of the ID3 TSS. The ECR browser and rVista were used to predict putative E2F2 binding sites within this region as in D.
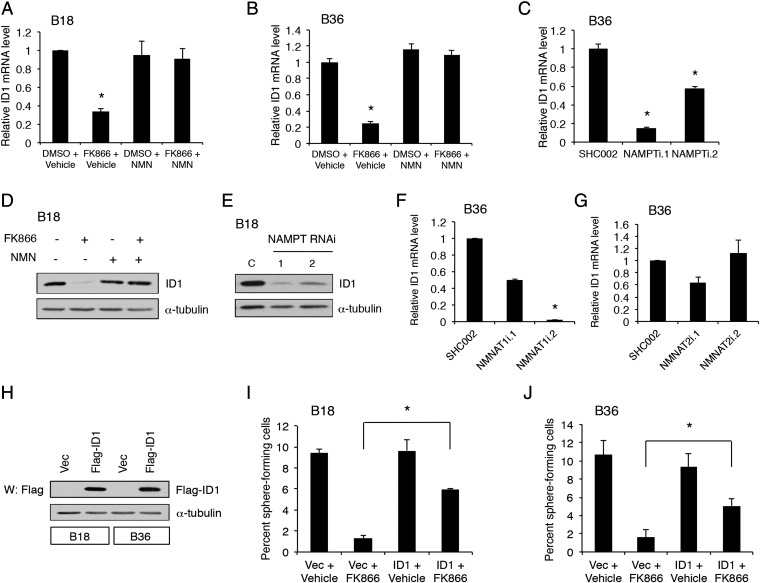
We next tested if NAMPT also regulates ID1 expression in GSCs. Both pharmacological and genetic inhibition of NAMPT decreased ID1 mRNA and protein levels (Fig. 6 A–E). Moreover, consistent with the E2F2 results, knockdown of NMNAT1, but not NMNAT2, decreased ID1 mRNA levels (Fig. 6 F and G), together suggesting a NAMPT-NMNAT1-E2F2 pathway to ID1. To test if ID1 biologically acts downstream of NAMPT, we performed epistasis experiments in assays of GSC self-renewal (Fig. 6 H–J). FK866 substantially inhibited the self-renewal capacity of GSCs, which was partially but significantly restored by ID1 overexpression, suggesting ID1 operates downstream of NAMPT (Fig. 6 H–J). Together, these results indicate the NAMPT–E2F2–ID axis represents an important transcriptional signaling pathway that governs GSC self-renewal.
Fig. 6.
NAMPT regulates ID1 expression to drive GSC self-renewal. (A) GSCs were treated with 100 nM FK866 or vehicle with or without 1 mM NMN for 3 d. RNA was extracted, and qPCR was performed using primers specific to ID1. Data represent mean + SEM (ANOVA, *P < 0.005). (B) GSCs were treated and subjected to qPCR as in A. Data represent mean + SEM (ANOVA, *P = 0.001). (C) GSCs transduced with indicated lentiviruses were selected with puromycin. At 7 d later, qPCR performed as in A. Data represent mean + SEM (ANOVA, *P < 0.0001). (D) Lysates from GSCs treated as in A were processed for immunoblotting. (E) Lysates from GSCs treated as in C were processed for immunoblotting. (F and G) RNA was extracted from GSCs transduced with the indicated lentiviruses 5 d postinfection, and qPCR was performed using indicated primers. Data represent mean + SEM. NMNAT1 knockdown reduced ID1 mRNA levels (ANOVA, *P < 0.005). (H) GSCs were stably transduced with FLAG-tagged ID1-expressing or control vector (Vec) lentiviruses. Lysates from GSCs were processed for immunoblotting. (I) GSCs stably infected as in H were subjected to ELDA as in Fig. 2C in the presence of FK866 or vehicle. FK866 = 10 nM. Data represent mean + SEM. FK866 decreased self-renewal compared with vehicle (ANOVA, P < 0.0001). Expression of ID1 plus FK866 increased self-renewal compared with infection with Vec plus FK866 (ANOVA, *P < 0.0001). (J) GSCs treated as in I were subjected to ELDA as in Fig. 2C. FK866 = 3 nM. Data represent mean + SEM. FK866 decreased self-renewal compared with vehicle (ANOVA, P < 0.0001). Expression of ID1 plus FK866 increased self-renewal compared with infection with Vec plus FK866 (ANOVA, *P = 0.015).
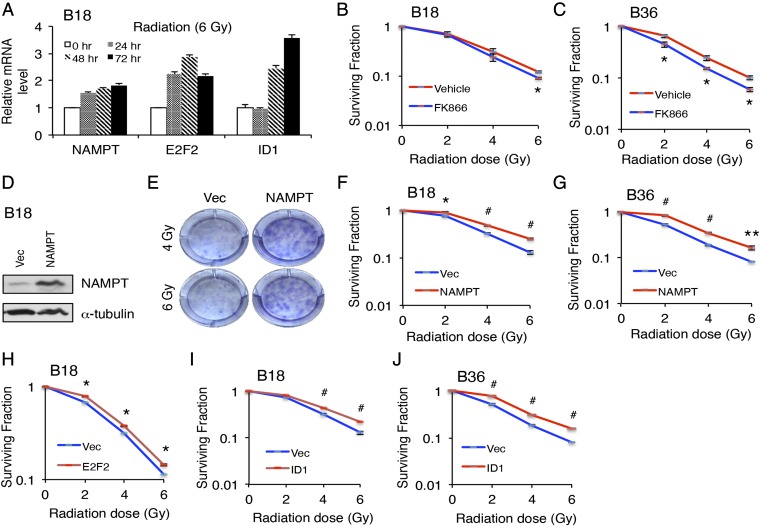
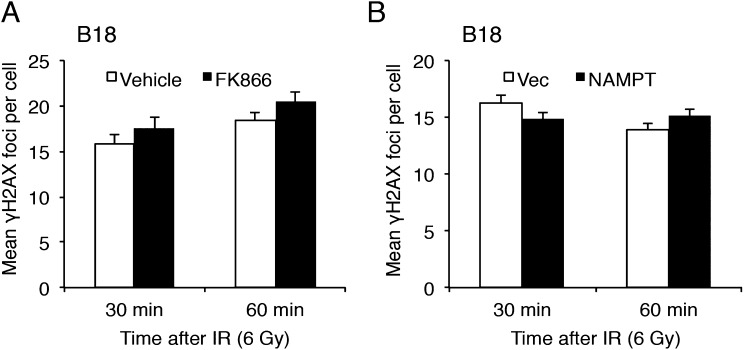
We next asked if this NAD+-driven transcriptional program might be clinically relevant in the response to radiation therapy in GSCs. Initial qRT-PCR experiments using B18 GSCs revealed that NAMPT, E2F2, and ID1 mRNA levels increase after treatment with ionizing radiation (IR), with ID1 levels increasing in a slightly delayed fashion, consistent with its role as an E2F2 target (Fig. 7A). These gene expression changes could potentially represent a cellular defense to IR, a pathway contributing to IR toxicity, or an epiphenomenon. We therefore treated GSCs with sublethal concentrations of FK866, subjected them to different doses of IR, and assessed clonogenic survival 2 wk later. Interestingly, NAMPT inhibition increased GSC responsiveness to IR (Fig. 7 B and C), and in complementary experiments, NAMPT overexpression decreased GSC responsiveness to radiation, together indicating that NAMPT promotes radiation resistance (Fig. 7 D–G). Quantification of γH2AX foci in GSCs following IR suggested that the initial burden of DNA double-strand breaks is not significantly different in cells treated with FK866 or overexpressing NAMPT, suggesting instead that downstream responses to IR are altered by NAMPT manipulation (Fig. 4B and Fig. S6). Finally, we tested if the transcriptional consequences of NAMPT might also be important for GSC radiation responsiveness. Initial experiments to test the direct role of E2F2 in radiation responsiveness using E2F2 RNAi revealed that E2F2 is necessary for GSC survival at clonogenic density in the absence of IR, precluding additional manipulations using IR in the setting of E2F2 knockdown (Table S3). However, the complementary experiment of E2F2 overexpression modestly but significantly increased GSC radioresistance (Fig. 7H). Accordingly, ID1 overexpression also increased GSC radioresistance (Fig. 7 I and J). Together, these results implicate the NAMPT-E2F2-ID1 pathway in the biological response of GSCs to radiation therapy.
Fig. 7.
NAMPT promotes GSC radioresistance. (A) GSCs were treated with 6 Gy IR and harvested at indicated time points. RNA was extracted, and qPCR was performed using indicated primers. Data represent mean + SEM. IR treatment increased NAMPT, E2F2, and ID1 mRNA levels (ANOVA, P < 0.005 for NAMPT and P < 0.0001 for E2F2 at all post-IR time points, P ≤ 0.005 at 48 and 72 h for ID1). (B) GSCs were treated with 1 nM FK866 or vehicle for 2 d and plated at clonogenic density in medium containing FK866 or vehicle. IR treatment was performed the following day, and clonogenic survival was determined 14 d after IR by staining colonies with 0.5% cresyl violet. The number of colonies was counted to determine the surviving fraction. Data represent mean ± SEM (unpaired t test, *P < 0.05). (C) GSCs were treated with 3 nM FK866 or vehicle for 2 d and plated at clonogenic density in medium containing FK866 or vehicle. Clonogenic survival was determined after IR as in B. Data represent mean ± SEM (unpaired t test, *P < 0.05). (D) GSCs were transduced with NAMPT-expressing or control vector (Vec) lentiviruses and selected with puromycin. At 4 d later, lysates were processed for immunoblotting. (E) GSCs treated with indicated lentiviruses were plated at clonogenic density after selection with puromycin. IR was performed the following day, and colonies were stained with 0.5% cresyl violet 14 d after IR. Representative images of wells are shown. (F and G) GSCs were transduced with indicated lentiviruses, and clonogenic survival after IR was determined as in B. Data represent mean ± SEM (unpaired t test, *P < 0.05, #P < 0.005, **P < 0.01). (H) GSCs were transduced with indicated lentiviruses, and clonogenic survival after IR was determined as in B. Data represent mean ± SEM (unpaired t test, *P < 0.05). (I and J) GSCs were transduced with indicated lentiviruses, and clonogenic survival after IR was determined as in B. Data represent mean ± SEM (unpaired t test, #P < 0.005).
Fig. S6.
NAMPT manipulation does not alter the number of γH2AX foci early following radiation. (A and B) GSCs were treated with 1 nM FK866 (or vehicle) (A) or infected with NAMPT-expressing (or control vector) lentivirus (B) and irradiated 3 d later. Cells were processed 30 and 60 min postradiation for γH2AX immunofluorescence. Quantification of γH2AX foci per cell is shown. No significant difference in the number of γH2AX foci was observed with FK866 (unpaired t test; P = 0.3 and P = 0.13 for 30 and 60 min, respectively) or NAMPT overexpression (unpaired t test; P = 0.16).
Table S3.
Number of colonies in E2F2-knockdown GSCs 14 d after radiation treatment
| SHC002 | E2F2i.1 | E2F2i.2 | |||||||
| Experiment no. | Experiment no. | Experiment no. | |||||||
| Radiation dose, Gy | 1 | 2 | 3 | 1 | 2 | 3 | 1 | 2 | 3 |
| 0 | 32 | 26 | 32 | 0 | 0 | 0 | 0 | 0 | 0 |
| 2 | 46 | 38 | 40 | 0 | 0 | 0 | 0 | 0 | 0 |
| 4 | 38 | 29 | 35 | 0 | 0 | 0 | 0 | 0 | 0 |
| 6 | 30 | 22 | 28 | 0 | 0 | 0 | 0 | 0 | 0 |
Discussion
We have examined the NAD+-dependent transcriptional program in GSCs and defined a NAMPT-E2F2-ID signaling pathway, which regulates GSC self-renewal and radiation resistance. NAMPT is expressed at high levels in several different cancers and, therefore, this enzyme has been considered a potential therapeutic cancer target (5, 9, 27). Recent studies in glioblastoma have indicated specific genetic subgroups may be exquisitely sensitive to NAMPT inhibition (28, 29). IDH1 mutation sensitizes GSCs to NAMPT inhibitors due to low ambient levels of NAD+, resulting from down-regulation of nicotinic acid phosphoribosyltransferase (NAPRT1), which catalyzes an alternative NAD+ salvage pathway (29). MYC overexpression and MYC or N-MYC amplification in glioblastoma cells increase glycolytic flux and lower NAD+ levels, similarly leading to increased susceptibility to NAMPT inhibitors (28). The relevance of the NAMPT–E2F2–ID pathway to these specific molecular contexts is an interesting question for future investigation. It should be noted, however, that inhibiting NAMPT carries therapeutic challenges, because systemic NAMPT inhibition is known to cause retinal toxicity and potential blindness (30). Therefore, local NAMPT inhibitory strategies or disruption of the tumor-specific signals regulating NAMPT or its downstream consequences need to be carefully considered for potential clinical translation.
Before this study, the precise role of E2F2 in glioblastoma has remained enigmatic because deregulated E2F2 levels in both directions have been shown to inhibit glioblastoma cell functions. For instance, overexpression of E2F2 in U343 cells induced apoptosis (31), whereas E2F2 knockdown inhibited the tumorigenicity of U87MG cells (32). We found that NAMPT and NMNAT1 are required for E2F2 expression, which is essential for self-renewal in human GSCs. It is likely that tightly regulated levels of E2F2 are needed for appropriate control of S-phase entry, self-renewal, and cell survival. An important mechanistic question is how nuclear NAD+ levels regulate E2F2 mRNA in GSCs. In addition to its metabolic functions, NAD+ can influence transcriptional programs as a cofactor for NAD+-dependent enzymes, including the sirtuins, poly- and mono-ADP ribosyl transferases, and ADP ribosyl cyclases. Which specific nuclear NAD+-dependent events lead to E2F2-ID remains to be determined.
The biological roles and mechanisms of ID family proteins in glioblastoma have been the subject of intense recent investigation (23, 33–36). Benezra and colleagues (23) identified a self-renewing subpopulation expressing high levels of Id1 in a PDGFB-driven Arf−/− mouse model of glioblastoma. More recently, combined genetic deletion of Id1, Id2, and Id3 in a HrasV12 and p53 knockdown-driven mouse model of high-grade glioma inhibited in vivo tumorigenicity and caused GSC exit from the perivascular niche, suggesting functional redundancy among Id family members (35). However, acute knockdown of ID1 alone in human GSCs was sufficient to reduce tumor formation in vivo, suggesting compensatory mechanisms for acute ID1 loss may be less robust (36).
We found the NAMPT-E2F2-ID1 pathway is up-regulated in GSCs following radiation and represents a protective response to radiation. Consistent with our results, E2F2 was found to have a protective role in radiation-induced, p53-independent apoptosis in Drosophila third-instar larvae (37). ID1 has recently been shown to be necessary for prostaglandin E2-mediated radiation resistance in mouse glioblastoma cells, and ID1+ human GSCs appear to be relatively radiation resistant (33). It is likely that additional NAD+-dependent consequences independent of E2F2 and ID1 also play a role in GSC radioresistance.
Methods
Cell Culture.
The generation of patient-derived GSC lines has been described (17). Informed consent was obtained from patients for use of human tissue and cells. All protocols using human tissue were approved by the Institutional Review Board (Washington University). Briefly, patient tumor specimens were mechanically and enzymatically dissociated (Accutase; Sigma-Aldrich). The cell suspension was passed through a 70-μm cell strainer and plated in RHB-A medium (Clontech) with EGF and FGF-2 (20 ng/mL; PeproTech) on Primaria plates coated with poly-l-ornithine and laminin (Sigma-Aldrich). Cells were strictly used between passage numbers 5–20 for experiments. Human astrocytes (Lonza or generous gift from Milan Chheda, Washington University, St. Louis) were cultured in astrocyte growth media (ScienCell), and HEK293 cells were cultured in DMEM media with 10% (vol/vol) FBS. All cells were incubated at 37 °C with 5% (vol/vol) CO2. For lentiviral transduction, virus was added with 4 μg/mL polybrene to cells for 4 h. For self-renewal, clonogenic survival, and in vivo tumorigenicity experiments, puromycin was added the day after infection, and cells were used after 48–72 h.
Extreme Limiting Dilution Analysis.
Cells were plated at fivefold serial dilutions, from 3,000 to 1 cell/well in ultra-low attachment 96-well plates (Corning Costar). The number of wells containing spheres was counted 14 d later to determine percent sphere-forming cells by ELDA software (38).
Orthotopic Xenotransplantation.
Animals were used in accordance with a protocol approved by the Animal Studies Committee at Washington University and compliant with the recommendations of the Guide for the Care and Use of Laboratory Animals (NIH). A total of 250,000 cells were injected into the right putamen of 6- to 9-wk-old NOD-SCIDγ mice using a stereotactic apparatus at the following coordinates: 0.98 mm rostral to bregma, 1.5 mm lateral, and 2.6 mm deep (Hope Center Animal Surgery Core).
Ionizing Radiation Treatment and Clonogenic Survival Analysis.
Cells seeded at defined cell densities according to radiation dose were plated and allowed to attach overnight. The next day, cells were irradiated with 0, 2, 4, or 6 Gy. Two weeks later, colonies were stained with 0.5% cresyl violet, and the number of colonies was counted manually in a blinded fashion. Counts represent surviving fraction relative to control.
SI Methods
Antibodies and Drugs.
The following antibodies were used for this study: rabbit polyclonal anti-Visfatin (ab45890; Abcam), rabbit polyclonal anti-PBEF (A300-372A; Bethyl Laboratories), mouse monoclonal anti-IDH1 R132H (DIA-H09-L; HistoBioTec), rabbit polyclonal anti-E2F2 (sc-633; Santa Cruz Biotechnology, Inc.), rabbit monoclonal anti-Id1 (BCH-1/195-14; BioCheck, Inc.), mouse monoclonal anti-α-tubulin (T5168; Sigma-Aldrich), mouse monoclonal anti-FLAG (F3165; Sigma-Aldrich), rabbit polyclonal anti-GFP (A6455; Life Technologies), and rabbit Anti-Phospho-Histone H2A.X (Ser139) (2577; Cell Signaling). NAMPT inhibitor FK866 was obtained from Calbiochem (481908). Hoechst 33342 was purchased from Molecular Probes (Life Technologies), and propidium iodide and Fluoroshield with DAPI were purchased from Sigma-Aldrich. Caspase-3/7 activity assay reagent was obtained from Essen BioScience.
Plasmids.
The following human gene target-directed shRNA plasmids (in pLKO.1) from the RNAi Consortium were used: NAMPT RNAi (NAMPTi.1 and 2), targeting 5′- CCTACAAGGTTACTCACTATA-3′ and 5′-GTAACTTAGATGGTCTGGAAT-3′, respectively (Washington University RNAi Core); NMNAT1 RNAi (NMNAT1i.1 and NMNAT1i.2), targeting 5′-GAAACACAAGATTCTAGTCAA-3′ and 5′-CGCTACTTGGTACCAGATCTT-3′; NMNAT2 RNAi (NMNAT2i.1 and NMNAT2i.2), targeting 5′-GCCAGGGATTATCTGCACAAA-3′ and 5′-GAGGTGATTGTTGGTGACTTT-3′ (Sigma-Aldrich); E2F2 RNAi (E2F2i.1 and 2), targeting 5′-GCCTATGTGACTTACCAGGAT-3′ and 5′-GCAGACAGTGATTGCCGTCAA-3′ (Sigma-Aldrich); LacZ RNAi, targeting 5′-TGTTCGCATTATCCGAACCAT-3′; and control scrambled RNAi plasmid SHC002 with sequence CCGGCAACAAGATGAAGAGCACCAACTCGAGTTGGTGCTCTTCATCTTGTTGTTTT (Addgene). Human NAMPT, HA epitope-tagged E2F2, and FLAG epitope-tagged ID1 were subcloned into N103 lentiviral vector (kindly provided by Andrew Yoo, Washington University). The ID1 promoter plasmid was a kind gift from Judith Campisi, Buck Institute for Research on Aging. ID1 promoter deletion plasmids were generated in pGL2-Basic (Promega) and pGreenfire1 (System Biosciences) by standard PCR and subcloning techniques. All plasmids were confirmed by sequencing.
NAD+ Measurements.
GSCs were washed with PBS and lysed in 1 M perchloric acid. Extracts were clarified by centrifugation, and the supernatant was neutralized with 3 M K2CO3. Equal volumes of neutralized extract were mixed with potassium phosphate buffer and assayed by HPLC using LC-18T HPLC column (Supelco) at a flow rate of 1 mL/min, and the absorbance at 254 nm was recorded. Each elution peak was compared with standards to quantify NAD+.
Real-Time Quantitative PCR.
Total RNA was isolated using RNeasy Plus Mini Kit (Qiagen) and reverse transcribed to cDNA using a High-Capacity cDNA Reverse Transcription Kit (Applied Biosystems). RT-qPCR was performed by using Power SYBR Green PCR Master Mix (Applied Biosystems) on the CFX Connect Real-Time system (Bio-Rad). β-actin and GAPDH were used as reference genes. The sequences of the primers used are as follows:
NAMPT forward: 5′-GTTCCAGCAGCAGAACACAG-3′
NAMPT reverse: 5′-GCTGACCACAGATACAGGCA-3′
NMNAT1 forward: 5′-GTGGAAAGAGACTCTGAAGGTGC-3′
NMNAT1 reverse: 5′-CTTGTGTTTCAGTCCACTTCCTC-3′
NMNAT2 forward: 5′-AACAGGGCCTCGTGTCAAGC-3′
NMNAT2 reverse: 5′-TCCCAAGGGTCCACCCTGAT-3′
E2F2 forward: 5′-CTCTCTGAGCTTCAAGCACCTG-3′
E2F2 reverse: 5′-CTTGACGGCAATCACTGTCTGC-3′
ID1 forward: 5′-CCGAGGCGGCATGCGT-3′
ID1 reverse: 5′-GGAGACCCACAGAGCACGTAA-3′
ID2 forward: 5′-CTGACCACCCTCAACACGGA-3′
ID2 reverse: 5′- TTCAGCCACACAGTGCTTTGC-3′
ID3 forward: 5′- ACAGCGCGTCATCGACTACA-3′
ID3 reverse: 5′- GTGAGCTCGGCTGTCTGGAT-3′
ID4 forward: 5′- CACTGCGCTCAACACCGAC-3′
ID4 reverse: 5′- CTCTAGTGCTCCTGGCTCGG-3′
BMI1 forward: 5′- CTGGTTGCCCATTGACAGCG-3′
BMI1 reverse: 5′- GATCGAAGCGGGCGGAAAAG-3′
NANOG forward: 5′- CAATGGTGTGACGCAGGGATG-3′
NANOG reverse: 5′- GACTGGATGTTCTGGGTCTGGT-3′
POU3F2 forward: 5′- TCACAAGGAGATGGGCACGG-3′
POU3F2 reverse: 5′- AGTGGCTATTTGCCCTGCTCT-3′
SALL2 forward: 5′- GACCCAAGGGGGAGACGAGA-3′
SALL2 reverse: 5′- GCTGCTTTCGCCGAGACATT-3′
SOX2 forward: 5′- GGGGAAAGTAGTTTGCTGCC-3′
SOX2 reverse: 5′- CGCCGCCGATGATTGTTATT-3′
ID1-promoter forward: 5′- GACCCTTGCTCAGCGACC-3′
ID1-promoter reverse: 5′- CCATGGAGACGACAAACTGGT-3′
Transient Transfection.
Polyethyleneimine (PEI; Polysciences no. 24765-2) was dissolved in ddH20 to a concentration of 1 mg/mL. The solution was then adjusted to pH 7.0 and filter sterilized. A mixture of plasmid DNA and PEI solution (1:4::μg DNA: μL PEI) was made in Opti-MEM (Life Technologies) and incubated at room temperature for 15 min. Total plasmid DNA amount was equalized by addition of vector N103. DNA/PEI complexes were applied to cells, and media was changed after 12–16 h. Experiments were performed 24–36 h following transfection.
Lentiviral Production.
293LE cells were plated with a goal density of 70–80% after 1 d. On the next day, transfection was performed using the PEI transfection method to introduce the plasmid of interest along with packaging plasmid psPAX2 and envelope plasmid pCMV-VSVG to Opti-MEM (Life Technologies). On day 6, medium from the plates was collected and spun down at 1,200 × g for 5 min at 4 °C. Supernatant was filtered through a 0.45-μm filter. Lenti-X Concentrator (Clontech) was then added to the filtrate and mixed, and the tubes were incubated at 4 °C for 6–7 h. Lentiviruses were then centrifuged at 1,500 × g for 45 min at 4 °C, resuspended in cold PBS, and stored at −80 °C in aliquots.
Immunohistochemistry.
For GFP staining of mouse brain sections, brains were dissected, fixed in 4% (wt/vol) paraformaldehyde, and placed in 30% (wt/vol) sucrose for cryoprotection. The 10-μm-thick frozen sections were cut using a cryostat. Frozen sections were fixed in ice-cold acetone and then rehydrated in PBS. Sections were blocked in PBS containing 4% (vol/vol) normal goat serum (Vector Laboratories) for 1 h at room temperature. Immunostaining for GFP was then carried out using rabbit polyclonal anti-GFP antibody overnight at 4 °C, and sections were washed with PBS and incubated with appropriate secondary antibody conjugated to fluorescent dye Alexa Fluor 488 Goat Anti-Rabbit (Life Technologies) for 60 min at room temperature. After additional PBS washes, Fluoroshield mounting medium containing DAPI was added to the sections, and slides were coverslipped. Fluorescent images of the sections were taken using an automated inverted microscope (Leica Microsystems). For immunohistochemistry of human tumor specimens, paraffin-embedded patient tumor sections were deparaffinized by xylene and then hydrated by incubating with graded ethanol [2 × 5 min 100% (vol/vol), and 1 × 5 min each for 95% (vol/vol) and 70% (vol/vol)]. Sections were then rinsed in distilled water and heat-induced antigen retrieval was carried out using citrate buffer (pH 6) overnight at 70 °C. Sections were then rinsed in PBS and blocked in PBS containing 10% (vol/vol) donkey serum for 60 min at room temperature. Incubation with rabbit polyclonal anti-NAMPT antibody was carried out overnight at 4 °C followed by washing with PBS. Sections were then processed for detection of stained cells by using Histostain-Plus Kit (Life Technologies) per manufacturer’s instructions. Nuclei were counterstained with hematoxylin. 3,3′-diaminobenzidine was then used for visualization. Sections were imaged using an automated inverted microscope. For immunocytochemistry of GSCs for γH2AX, cells were fixed in 4% (wt/vol) paraformaldehyde and then washed in PBS. Cells were blocked in PBS containing 5% (vol/vol) normal goat serum (Vector laboratories) for 1 h at room temperature. Immunostaining for γH2AX was then carried out using rabbit Anti-Phospho-Histone H2A.X (Ser139) antibody overnight at 4 °C, and cells were washed with PBS and incubated with appropriate secondary antibody conjugated to fluorescent dye Alexa Fluor 568 Goat Anti-Rabbit (Life Technologies) for 60 min at room temperature. After additional PBS washes, nuclei were stained with Hoechst 33342. Fluorescent images of the cells were taken using an automated inverted microscope and the number of γH2AX foci was counted to determine mean foci per cell.
Bioluminescence Imaging.
For BLI, animals were anesthetized with 2.5% (vol/vol) isoflurane, injected i.p. with 150 μg/mL d-luciferin (Biosynth) in PBS, and imaged with a charge-coupled device (CCD) camera-based bioluminescence imaging system (IVIS 100; Perkin-Elmer; exposure time 3–5 min, binning 16, field of view 12, f/stop 1, open filter; Molecular Imaging Center, Washington University). Signal was displayed as photons per s/cm2 per steradian.
In Vitro Luciferase Assay.
Cells were stably infected with pGreenfire1 ID1 promoter-GFP-T2A luciferase or control pGreenfire1 promoter less-GFP T2A luciferase lentivirus and transduced with indicated RNAi viruses and selected with puromycin. Seven days later, cells were visualized for GFP expression by live fluorescence microscopy and then assayed for luciferase activity using the ONE-Glo Luciferase Assay System (Promega). Luciferase signal was quantified by luminometry using a Tecan Infinite M200 Pro Microplate Reader and divided by total protein levels. Data were normalized to the control condition (=1). For ID1 promoter deletion analysis, cells were transiently transfected with Firefly luciferase reporter plasmids (pGL2-basic) driven by the indicated promoter deletions or promoterless control vector along with a constitutively expressed Renilla luciferase plasmid by using TransFectin (Bio-Rad). At 36 h later, luciferase activity was determined on a Microplate reader as above by using Dual-Luciferase Reporter Assay System (Promega). Firefly luciferase values were normalized by Renilla luciferase values.
Chromatin Immunoprecipitation-qPCR.
B36 GSCs were stably infected with HA epitope-tagged E2F2 and grown in 100 mm dishes (BD Bioscience) to 90% confluency. The 7–9 × 10⁶ cells were cross-linked with 1% formaldehyde in growth media for 10 min and quenched with 125 mM glycine for 5 min at room temperature. Cells were harvested by scraping and cell suspensions were clarified by centrifugation at 800 × g at 4 °C for 5 min. Cells were washed twice with cold PBS and resuspended in cell lysis buffer (5 mM Pipes pH 8.0, 85 mM KCl, 0.5% Nonidet P-40, 1 mM PMSF) with 1× protease inhibitor mixture on ice for 15 min. Nuclei were collected by centrifugation at 800 × g for 5 min at 4 °C and resuspended in 450 μL of ice-cold nuclear lysis buffer (50 mM Tris⋅HCl pH 8.0, 10 mM EDTA, 1% SDS) with 1× protease inhibitor mixture. Nuclei were sonicated until an average DNA fragment size of 200–600 bp was achieved. The sonicated nuclear lysates were centrifuged at 10,000 × g at 4 °C for 10 min to remove insoluble material. Sonication efficiency was confirmed by agarose gel electrophoresis. The 50 μL Dynabeads Protein A or G (NOVEX; Life Technologies) and 10 μg HA antibody (ab9110; Abcam) were rotated together at room temperature for 60 min and then separated by magnetic separator. The 50-μL lysate was diluted to 10-fold ChIP dilution buffer [20 mM Tris⋅HCl pH 8.0, 167 mM NaCl, 1.1 mM EDTA, 0.01% SD, 1.1% (vol/vol) Triton X-100] and then added to antibody–beads complex with rotation at 4 °C overnight. The corresponding IgG (Santa Cruz) served as negative control. The beads were washed twice with 1 mL of low-salt buffer (20 mM Tris⋅HCl pH 8.1, 2 mM EDTA, 150 mM NaCl, 1% Triton X-100, 0.1% SDS) twice with 1 mL of high-salt buffer (20 mM Tris⋅HCl pH 8.1, 2 mM EDTA, 500 mM NaCl, 1% Triton X-100, 0.1% SDS), twice with 1 mL of LiCl buffer (10 mM Tris⋅HCl pH 8.1, 1 mM EDTA, 250 mM LiCl, 1% Nonidet P-40, 1% deoxycholate), and twice with 1 mL of TE (10 mM Tris⋅HCl, 1 mM EDTA pH 8.0). Immunocomplexes were eluted in 100 μL of ChIP elution buffer (0.1 M NaHCO3, 1% SDS) at room temperature. Elutes were treated with 1 μL of 10 mg/mL proteinase K and reverse cross-linked at 65 °C for 2 h with 600 rpm shaking (Thermomixer R, Eppendorf, Hauppauge, NY) then heated at 95 °C for 10 min to decrease protein. DNA fragments were purified using UltraClean PCR Clean-Up Kit (MO BIO Laboratories). The resulting DNA was analyzed by real-time PCR reactions with primers recognizing the region between −1209 and −1009 of the ID1 promoter (see above).
EdU Labeling.
The 5 × 10³ GSCs per well were plated in a 96-well plate and treated with indicated concentrations of FK866 for 4 d. Proliferation of GSCs was measured using the Click-iT EdU Alexa Fluor 488 Imaging Kit (Invitrogen), and nuclei were stained using Hoechst 33342 (2 μg/mL; Invitrogen). Images were acquired using an inverted fluorescence microscope (Leica Microsystems) and processed using ImageJ (NIH) to determine the percentage of EdU-positive cells.
Cell Death Assay.
The 3 × 10⁴ GSCs per well were plated in a 24-well plate and treated with indicated concentrations of FK866 for 4 d. PI (10 μg/mL; Sigma-Aldrich) and Hoechst 33342 were added to the cells and incubated for 15 min. Images were acquired using an inverted fluorescence microscope (Leica Microsystems) and processed using ImageJ to determine the percentage of PI-positive cells.
Live Cell Imaging.
The 3 × 10⁴ GSCs per well were plated in a 24-well plate, treated with FK866, and imaged at indicated time points using the IncuCyte Zoom Live-Cell Analysis System to assess relative cell number (Essen BioScience). For determination of caspase-3/7 activity, caspase-3/7 apoptosis assay reagent (Essen BioScience) was added to the cells during plating.
Identification of Evolutionary Conserved Transcription Factor Binding Sites.
The ECR browser (https://ecrbrowser.dcode.org) was used to identify evolutionarily conserved regions in seven mammalian species (Homo sapiens, Didelphis virginiana, Rattus norvegicus, Mus musculus, Canis familiaris, Macaca mulatta, and Pan troglodytes) within the region spanning −1209 and −709 from the TSS for ID1 and within 3.5 kb upstream of the transcription start site for the ID2–4 genes. The JASPAR database was used to identify E2F2 binding motifs. Evolutionarily conserved E2F2 binding sites based on these motifs were then identified in the promoter regions of the ID genes using rVista.
TCGA and REMBRANDT Data Analysis.
TCGA data were downloaded from the University of California, Santa Cruz, cancer browser (version 2015-02-24): the Affymetrix hgu133 mRNA gene expression for 529 glioblastoma tumor samples and 10 normal brain tissue samples, clinical data on 629 samples, and subtype classification as defined by Verhaak et al. (39): neural, proneural, mesenchymal and classical (https://genome-cancer.ucsc.edu). The overall survival of patients with NAMPT expression level greater than or equal to median and less than median was compared using Kaplan–Meier survival curves, and the log-rank test was performed. For the REMBRANDT data, Affymetrix GeneChip Human Genome U133 Plus 2.0 microarray data for glioblastoma tumors were downloaded from ArrayExpress (E-MTAB-3073) and processed using ExpressionFileCreator (GenePattern). This expression dataset was integrated with the clinical data downloaded from G-DOC (https://gdoc.georgetown.edu/gdoc/?url-%2Fworkflows). Overall survival was calculated as with the TCGA data. For the REMBRANDT grade 2 and 3 glioma data analysis, raw gene expression data [Affymetrix GeneChip Human Genome U133 Plus 2.0 (HG-U133_Plus_2)] and clinic data were downloaded from the housed data at Georgetown University (https://gdoc.georgetown.edu/gdoc/?url=%2FstudyDataSource%2Fshow%2F580). Raw CEL files were preprocessed (for background correction and quantile between-array normalization) using the RMA method implemented in the Bioconductor affy package. For TCGA grade 2 and 3 glioma data analysis, NAMPT RNA seq v2 (from RSEM) data and clinic data on 530 samples was assessed using Bioconductor package cgdsr (Memorial Sloan Kettering).
RNA Sequencing, Data Acquisition, Quality Control, and Processing.
GSCs were treated with 100 nM FK866 for 3 d, and total RNA was isolated using the RNeasy Plus Mini Kit (Qiagen). Ribosomal RNA was removed by a hybridization method using Ribo-ZERO kits (Illumina). mRNA was then fragmented and reverse transcribed to yield double-stranded cDNA. cDNA was blunt ended, had an A base added to the 3′ ends, and then had Illumina sequencing adapters ligated to the ends. Ligated fragments were then amplified for 12 cycles using primers incorporating unique index tags. Fragments were sequenced on an Illumina HiSeq-2500 using single reads extending 50 bases. RNA-seq reads were aligned to the Ensembl release 76 assembly with STAR version 2.0.4b. Gene counts were derived from the number of uniquely aligned unambiguous reads by Subread:featureCount version 1.4.5. Transcript counts were produced by Sailfish version 0.6.3. Sequencing performance was assessed for total number of aligned reads, total number of uniquely aligned reads, genes and transcripts detected, ribosomal fraction known junction saturation, and read distribution over known gene models with RSeQC version 2.3. All gene-level and transcript counts were then imported into the R/Bioconductor package EdgeR and TMM normalization size factors were calculated to adjust for samples for differences in library size. Genes or transcripts not expressed in any sample were excluded from further analysis. The TMM size factors and the matrix of counts were then imported into R/Bioconductor package limma, and weighted likelihoods based on the observed mean–variance relationship of every gene/transcript were then calculated for all samples with the Voom function. Performance of the samples was assessed with a Spearman correlation matrix and multidimensional scaling plots. Gene/transcript performance was assessed with plots of residual SD of every gene to their average log-count with a robustly fitted trend line of the residuals. Generalized linear models with robust dispersion estimates were then created to test for gene/transcript level differential expression. Differentially expressed genes and transcripts were then filtered for FDR adjusted P ≤ 0.05. Gene Ontology analysis was performed by using the R/Bioconductor packages GAGE and Pathview. Heat map was generated by using Cluster software and visualized with Java TreeView.
ARACNe Analysis.
RNA sequencing gene expression profiles of 169 glioblastoma patients from the Cancer Genome Atlas were downloaded. The gene interactome network was created using the ARACNe algorithm as previously described (20). Subnetworks containing differentially expressed genes in the GSC RNA-seq data were extracted from the whole GBM interactome network by Cytoscape software (www.cytoscape.org).
iRegulon Analysis.
For identification of enriched transcription factor motifs and their targets in the RNA-seq data, Cytoscape plugin iRegulon v1.3 was used (iregulon.aertslab.org) (21) with the following parameters: maximum false-discovery rate on motif similarity: 0.001, putative regulatory region: 10 kb centered on the TSS, and minimum normalized enrichment score of 3.
Statistical Analysis.
Statistical tests were performed using XLSTAT (Addinsoft) or Excel (Microsoft). The unpaired Student’s t test was used for comparisons between two conditions. For experiments with more than two groups, ANOVA was performed followed by Fisher’s least significant difference or the Bonferroni test for pairwise comparison among three or more than three groups, respectively. GraphPad Prism was used to generate Kaplan–Meier survival curves and perform log-rank tests on survival data. All images are representative of results obtained from three independent experiments unless otherwise stated, and all data show results from three independent experiments unless otherwise mentioned.
Supplementary Material
Acknowledgments
We thank members of the A.H.K. and H.Y. laboratories, as well as Dr. Gavin Dunn, for helpful discussion. This work was supported by NIH Grant K08NS081105; an American Cancer Society-Institutional research grant; the Concern Foundation; and the Duesenberg Research Fund (A.H.K.). The Genome Technology Access Center is partially supported by National Cancer Institute Cancer Center Support Grant P30 CA91842 and by Institute of Clinical and Translational Sciences/Clinical and Translational Science Awards Grant UL1TR000448 from the National Center for Research Resources, a component of the NIH, and NIH Roadmap for Medical Research. The Molecular Imaging Center at Washington University was funded by National Cancer Institute/NIH P50/CA09056.
Footnotes
The authors declare no conflict of interest.
This article is a PNAS Direct Submission.
This article contains supporting information online at www.pnas.org/lookup/suppl/doi:10.1073/pnas.1610921114/-/DCSupplemental.
References
- 1.Sathornsumetee S, et al. Molecularly targeted therapy for malignant glioma. Cancer. 2007;110(1):13–24. doi: 10.1002/cncr.22741. [DOI] [PubMed] [Google Scholar]
- 2.Stupp R, et al. European Organisation for Research and Treatment of Cancer Brain Tumor and Radiotherapy Groups; National Cancer Institute of Canada Clinical Trials Group Radiotherapy plus concomitant and adjuvant temozolomide for glioblastoma. N Engl J Med. 2005;352(10):987–996. doi: 10.1056/NEJMoa043330. [DOI] [PubMed] [Google Scholar]
- 3.Bao S, et al. Glioma stem cells promote radioresistance by preferential activation of the DNA damage response. Nature. 2006;444(7120):756–760. doi: 10.1038/nature05236. [DOI] [PubMed] [Google Scholar]
- 4.Chen J, et al. A restricted cell population propagates glioblastoma growth after chemotherapy. Nature. 2012;488(7412):522–526. doi: 10.1038/nature11287. [DOI] [PMC free article] [PubMed] [Google Scholar]
- 5.Garten A, et al. Physiological and pathophysiological roles of NAMPT and NAD metabolism. Nat Rev Endocrinol. 2015;11(9):535–546. doi: 10.1038/nrendo.2015.117. [DOI] [PubMed] [Google Scholar]
- 6.Araki T, Sasaki Y, Milbrandt J. Increased nuclear NAD biosynthesis and SIRT1 activation prevent axonal degeneration. Science. 2004;305(5686):1010–1013. doi: 10.1126/science.1098014. [DOI] [PubMed] [Google Scholar]
- 7.Revollo JR, et al. Nampt/PBEF/Visfatin regulates insulin secretion in beta cells as a systemic NAD biosynthetic enzyme. Cell Metab. 2007;6(5):363–375. doi: 10.1016/j.cmet.2007.09.003. [DOI] [PMC free article] [PubMed] [Google Scholar]
- 8.Kitani T, Okuno S, Fujisawa H. Growth phase-dependent changes in the subcellular localization of pre-B-cell colony-enhancing factor. FEBS Lett. 2003;544(1-3):74–78. doi: 10.1016/s0014-5793(03)00476-9. [DOI] [PubMed] [Google Scholar]
- 9.Galli U, et al. Medicinal chemistry of nicotinamide phosphoribosyltransferase (NAMPT) inhibitors. J Med Chem. 2013;56(16):6279–6296. doi: 10.1021/jm4001049. [DOI] [PubMed] [Google Scholar]
- 10.van Horssen R, et al. Intracellular NAD(H) levels control motility and invasion of glioma cells. Cell Mol Life Sci. 2013;70(12):2175–2190. doi: 10.1007/s00018-012-1249-1. [DOI] [PMC free article] [PubMed] [Google Scholar]
- 11.Wang B, et al. NAMPT overexpression in prostate cancer and its contribution to tumor cell survival and stress response. Oncogene. 2011;30(8):907–921. doi: 10.1038/onc.2010.468. [DOI] [PubMed] [Google Scholar]
- 12.Chang J, et al. Nicotinamide adenine dinucleotide (NAD)-regulated DNA methylation alters CCCTC-binding factor (CTCF)/cohesin binding and transcription at the BDNF locus. Proc Natl Acad Sci USA. 2010;107(50):21836–21841. doi: 10.1073/pnas.1002130107. [DOI] [PMC free article] [PubMed] [Google Scholar]
- 13.Ghosh S, George S, Roy U, Ramachandran D, Kolthur-Seetharam U. NAD: A master regulator of transcription. Biochim Biophys Acta. 2010;1799(10-12):681–693. doi: 10.1016/j.bbagrm.2010.08.002. [DOI] [PubMed] [Google Scholar]
- 14.Imai S, Armstrong CM, Kaeberlein M, Guarente L. Transcriptional silencing and longevity protein Sir2 is an NAD-dependent histone deacetylase. Nature. 2000;403(6771):795–800. doi: 10.1038/35001622. [DOI] [PubMed] [Google Scholar]
- 15.Kim MY, Mauro S, Gévry N, Lis JT, Kraus WL. NAD+-dependent modulation of chromatin structure and transcription by nucleosome binding properties of PARP-1. Cell. 2004;119(6):803–814. doi: 10.1016/j.cell.2004.11.002. [DOI] [PubMed] [Google Scholar]
- 16.Lin SJ, Guarente L. Nicotinamide adenine dinucleotide, a metabolic regulator of transcription, longevity and disease. Curr Opin Cell Biol. 2003;15(2):241–246. doi: 10.1016/s0955-0674(03)00006-1. [DOI] [PubMed] [Google Scholar]
- 17.Mao DD, et al. A CDC20-APC/SOX2 signaling axis regulates human glioblastoma stem-like cells. Cell Reports. 2015;11(11):1809–1821. doi: 10.1016/j.celrep.2015.05.027. [DOI] [PMC free article] [PubMed] [Google Scholar]
- 18.Suvà ML, et al. Reconstructing and reprogramming the tumor-propagating potential of glioblastoma stem-like cells. Cell. 2014;157(3):580–594. doi: 10.1016/j.cell.2014.02.030. [DOI] [PMC free article] [PubMed] [Google Scholar]
- 19.Chudnovsky Y, et al. ZFHX4 interacts with the NuRD core member CHD4 and regulates the glioblastoma tumor-initiating cell state. Cell Reports. 2014;6(2):313–324. doi: 10.1016/j.celrep.2013.12.032. [DOI] [PMC free article] [PubMed] [Google Scholar]
- 20.Margolin AA, et al. Reverse engineering cellular networks. Nat Protoc. 2006;1(2):662–671. doi: 10.1038/nprot.2006.106. [DOI] [PubMed] [Google Scholar]
- 21.Janky R, et al. iRegulon: From a gene list to a gene regulatory network using large motif and track collections. PLOS Comput Biol. 2014;10(7):e1003731. doi: 10.1371/journal.pcbi.1003731. [DOI] [PMC free article] [PubMed] [Google Scholar]
- 22.Berger F, Lau C, Dahlmann M, Ziegler M. Subcellular compartmentation and differential catalytic properties of the three human nicotinamide mononucleotide adenylyltransferase isoforms. J Biol Chem. 2005;280(43):36334–36341. doi: 10.1074/jbc.M508660200. [DOI] [PubMed] [Google Scholar]
- 23.Barrett LE, et al. Self-renewal does not predict tumor growth potential in mouse models of high-grade glioma. Cancer Cell. 2012;21(1):11–24. doi: 10.1016/j.ccr.2011.11.025. [DOI] [PubMed] [Google Scholar]
- 24.Molofsky AV, et al. Bmi-1 dependence distinguishes neural stem cell self-renewal from progenitor proliferation. Nature. 2003;425(6961):962–967. doi: 10.1038/nature02060. [DOI] [PMC free article] [PubMed] [Google Scholar]
- 25.Romero-Lanman EE, Pavlovic S, Amlani B, Chin Y, Benezra R. Id1 maintains embryonic stem cell self-renewal by up-regulation of Nanog and repression of Brachyury expression. Stem Cells Dev. 2012;21(3):384–393. doi: 10.1089/scd.2011.0428. [DOI] [PubMed] [Google Scholar]
- 26.Nehlin JO, Hara E, Kuo WL, Collins C, Campisi J. Genomic organization, sequence, and chromosomal localization of the human helix-loop-helix Id1 gene. Biochem Biophys Res Commun. 1997;231(3):628–634. doi: 10.1006/bbrc.1997.6152. [DOI] [PubMed] [Google Scholar]
- 27.Chiarugi A, Dölle C, Felici R, Ziegler M. The NAD metabolome--a key determinant of cancer cell biology. Nat Rev Cancer. 2012;12(11):741–752. doi: 10.1038/nrc3340. [DOI] [PubMed] [Google Scholar]
- 28.Tateishi K, et al. Myc-driven glycolysis is a therapeutic target in glioblastoma. Clin Cancer Res. 2016;22(17):4452–4465. doi: 10.1158/1078-0432.CCR-15-2274. [DOI] [PMC free article] [PubMed] [Google Scholar]
- 29.Tateishi K, et al. Extreme vulnerability of IDH1 mutant cancers to NAD+ depletion. Cancer Cell. 2015;28(6):773–784. doi: 10.1016/j.ccell.2015.11.006. [DOI] [PMC free article] [PubMed] [Google Scholar]
- 30.Zabka TS, et al. Retinal toxicity, in vivo and in vitro, associated with inhibition of nicotinamide phosphoribosyltransferase. Toxicol Sci. 2015;144(1):163–172. doi: 10.1093/toxsci/kfu268. [DOI] [PubMed] [Google Scholar]
- 31.Dirks PB, Rutka JT, Hubbard SL, Mondal S, Hamel PA. The E2F-family proteins induce distinct cell cycle regulatory factors in p16-arrested, U343 astrocytoma cells. Oncogene. 1998;17(7):867–876. doi: 10.1038/sj.onc.1202008. [DOI] [PubMed] [Google Scholar]
- 32.Nakahata AM, Suzuki DE, Rodini CO, Fiuza ML, Okamoto OK. RNAi-mediated knockdown of E2F2 inhibits tumorigenicity of human glioblastoma cells. Oncol Lett. 2014;8(4):1487–1491. doi: 10.3892/ol.2014.2369. [DOI] [PMC free article] [PubMed] [Google Scholar]
- 33.Cook PJ, et al. Cox-2-derived PGE2 induces Id1-dependent radiation resistance and self-renewal in experimental glioblastoma. Neuro-oncol. 2016;18(10):1379–1389. doi: 10.1093/neuonc/now049. [DOI] [PMC free article] [PubMed] [Google Scholar]
- 34.Lasorella A, Benezra R, Iavarone A. The ID proteins: master regulators of cancer stem cells and tumour aggressiveness. Nat Rev Cancer. 2014;14(2):77–91. doi: 10.1038/nrc3638. [DOI] [PubMed] [Google Scholar]
- 35.Niola F, et al. Mesenchymal high-grade glioma is maintained by the ID-RAP1 axis. J Clin Invest. 2013;123(1):405–417. doi: 10.1172/JCI63811. [DOI] [PMC free article] [PubMed] [Google Scholar]
- 36.Soroceanu L, et al. Id-1 is a key transcriptional regulator of glioblastoma aggressiveness and a novel therapeutic target. Cancer Res. 2013;73(5):1559–1569. doi: 10.1158/0008-5472.CAN-12-1943. [DOI] [PMC free article] [PubMed] [Google Scholar]
- 37.Wichmann A, Uyetake L, Su TT. E2F1 and E2F2 have opposite effects on radiation-induced p53-independent apoptosis in Drosophila. Dev Biol. 2010;346(1):80–89. doi: 10.1016/j.ydbio.2010.07.023. [DOI] [PMC free article] [PubMed] [Google Scholar]
- 38.Hu Y, Smyth GK. ELDA: Extreme limiting dilution analysis for comparing depleted and enriched populations in stem cell and other assays. J Immunol Methods. 2009;347(1-2):70–78. doi: 10.1016/j.jim.2009.06.008. [DOI] [PubMed] [Google Scholar]
- 39.Verhaak RG, et al. Cancer Genome Atlas Research Network Integrated genomic analysis identifies clinically relevant subtypes of glioblastoma characterized by abnormalities in PDGFRA, IDH1, EGFR, and NF1. Cancer Cell. 2010;17(1):98–110. doi: 10.1016/j.ccr.2009.12.020. [DOI] [PMC free article] [PubMed] [Google Scholar]
Associated Data
This section collects any data citations, data availability statements, or supplementary materials included in this article.


