Significance
The human brain exhibits ongoing spontaneous activity characterized by very slow frequency fluctuations. These synchronously firing populations are considered to play a key role in conscious processes. We identified ultraslow fluctuations (USFs) in awake and anesthetized mice using two-photon imaging in the prefrontal cortex, a brain region involved in cognitive processes. Using transgenic mice, we demonstrate a crucial role for nicotinic acetylcholine receptors (nAChRs) in the generation of ultraslow fluctuations and their synchronicity, processes that are affected by deletion of nAChR subunits and general anesthetics like isoflurane. This work allows further dissection of the underlying mechanisms, and predicts that in humans with nAChR polymorphisms or copy number variation these processes might be altered, resulting in neuropsychiatric disorders.
Keywords: nicotinic receptor, consciousness, ultraslow fluctuations, anesthesia, prefrontal cortex
Abstract
The prefrontal cortex (PFC) plays an important role in cognitive processes, including access to consciousness. The PFC receives significant cholinergic innervation and nicotinic acetylcholine receptors (nAChRs) contribute greatly to the effects of acetylcholine signaling. Using in vivo two-photon imaging of both awake and anesthetized mice, we recorded spontaneous, ongoing neuronal activity in layer II/III in the PFC of WT mice and mice deleted for different nAChR subunits. As in humans, this activity is characterized by synchronous ultraslow fluctuations and neuronal synchronicity is disrupted by light general anesthesia. Both the α7 and β2 nAChR subunits play an important role in the generation of ultraslow fluctuations that occur to a different extent during quiet wakefulness and light general anesthesia. The β2 subunit is specifically required for synchronized activity patterns. Furthermore, chronic application of mecamylamine, an antagonist of nAChRs, disrupts the generation of ultraslow fluctuations. Our findings provide new insight into the ongoing spontaneous activity in the awake and anesthetized state, and the role of cholinergic neurotransmission in the orchestration of cognitive functions.
The prefrontal cortex (PFC) plays an important role in cognitive processes such as attention (1), working memory (2), decision making (3), social behavior (4), and emotions (5). Current theories consider the PFC a key player in conscious processing (6–8). Deficits in prefrontal function, including attention, are noted in several neuropsychiatric disorders, including schizophrenia, attention deficit/hyperactivity syndrome, addiction, depression, and autism (9).
In humans, as in rodent models, cholinergic innervation of the PFC regulates cognitive processes and neuronal activity. For example, in rodents, removing PFC cholinergic innervation reduces attention performance, whereas stimulation of cholinergic projections causes enhancement (10). Many studies in both animal models and humans have shown that nicotinic acetylcholine receptors (nAChRs) are of particular importance for cognitive functions, reward, aging, and for pathologies like Alzheimer’s Disease (11). For example, deletion of the α7 and β2 nAChR subunits in mice impairs behaviors, such as exploration and attention (12–16). Importantly, lesions of the prelimbic cortex (PrLC) in WT mice cause deficits in social behavior, similar to those observed in β2 knock-out (KO) mice, whereas re-expression of the β2 subunit in the PrLC of β2 KO mice rescues their social interaction (4). Similarly, re-expression of β2 subunits in the PrLC of β2 KO mice fully restored their attentional performance in the five-choice serial reaction time task (16).
Ongoing spontaneous activity is known to occur in developing and adult brain and its physiological importance has been emphasized (17). Recordings in humans indicate that ongoing activity constantly fluctuates in a tightly correlated manner across distant brain regions, forming reproducible patterns with rich temporal dynamics and spatial organization (18). The potential contribution of spontaneous activity to conscious processing has been suggested and simulations helped characterize two main modes of activity: an active mode characterized by rapid and sustained activity (“ignition”) (19), which contributes to the signature of “conscious access,” and a resting mode with spontaneous ultraslow (<0.1 Hz) fluctuations (USFs) (18). It has been suggested that ignition and ultraslow spontaneous fluctuations share similar mechanisms (18). Independently, electrophysiological recordings in animal models have distinguished “up” and “down” states (20), and the possibility is considered here that up states coincide with USFs in humans. Furthermore, in vivo recordings in animal models (21) reveal that, similar to humans, USFs persist under general anesthesia, yet with a lower amplitude (22, 23). Under anesthesia, the dominating functional configurations have low information capacity and lack negative correlations (24). Conversely, in the awake state a dynamic exploration of a rich, flexible repertoire of functional configurations takes place, including ignition, in the course of conscious access. However, to our knowledge, the pharmacology and biochemistry of these processes remain unexplored.
To address this gap in our knowledge, using in vivo Ca2+ imaging we recorded and compared the spontaneous activity patterns in the PrLC of both awake mice and mice under general anesthesia, a condition where conscious processing is known to be altered (25). These recordings point to spontaneous and infrequent coherent states with high firing rates, analogous to USFs. Our findings reveal a distinct role of nAChRs in the ongoing synchronous neuronal activity of the PFC in awake and anesthetized animals, shedding light on a possible involvement of nAChRs in conscious processing.
Results
USFs Contribute to Mouse PFC Spontaneous Activity.
The recognition of the “default mode” network (26) started a long-lasting interest in the significance of the human brain’s ongoing or intrinsic activity, which is characterized by synchronous USFs of activity, often taking seconds to develop (18). USFs have been recorded in the cortex of awake humans and primates, and also under anesthesia (27–30). The neuronal mechanisms that generate spontaneous resting-state fluctuations, together with the ignition dynamics, are unknown and remain a matter of debate.
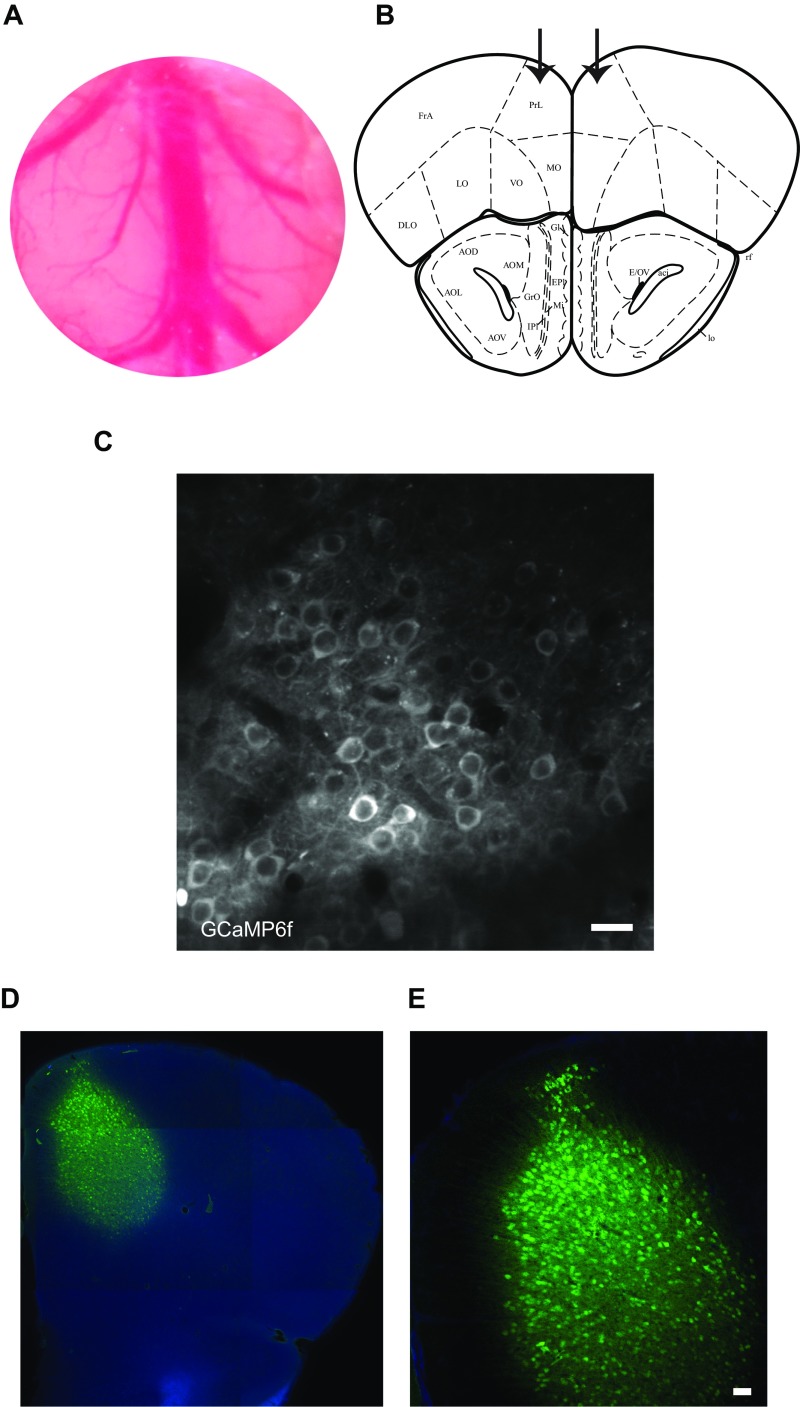
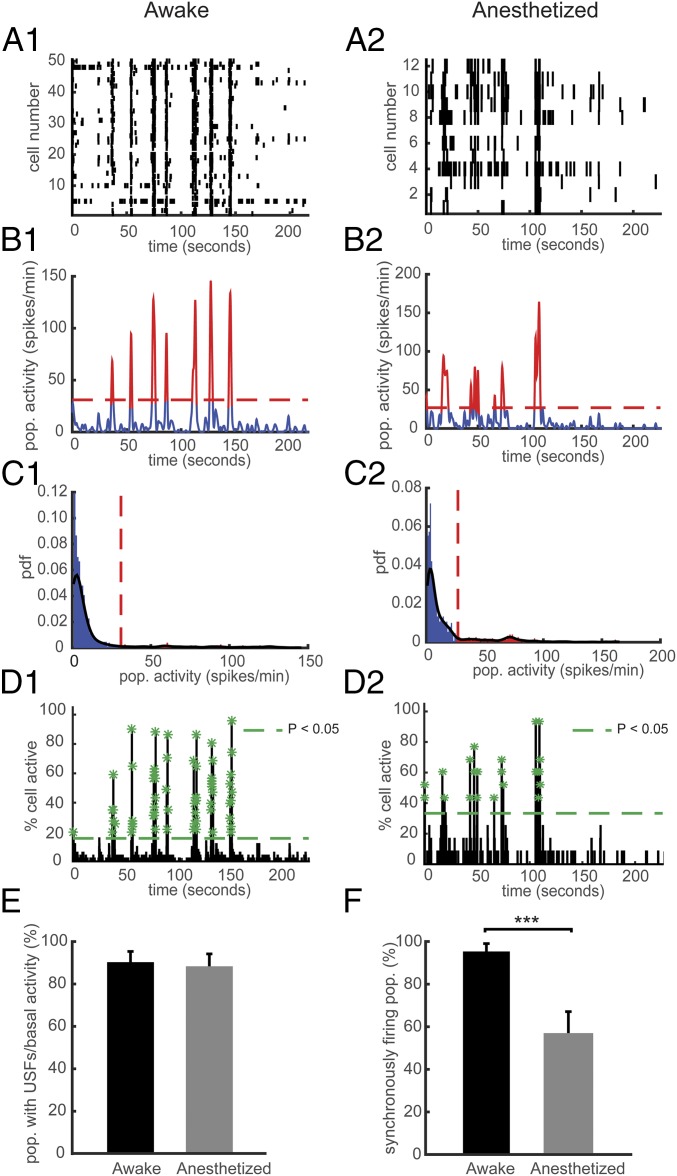
To explore these issues in vivo, we used the mouse as a model together with two-photon imaging of spontaneous neuronal activity patterns recorded through a chronic cranial window in layer II/III of the PrLC (Fig. S1 A and B). Neurons of the PrLC were transduced with an adeno-associated viral vector (AAV) expressing the fluorescent calcium indicator GCaMP6f (Materials and Methods and SI Materials and Methods). Four weeks after AAV injection, the majority of layer II/III neurons exhibited green fluorescence (Fig. S1 C–E). We first studied the activity patterns of 3-mo-old awake head-fixed WT mice, where we simultaneously monitored the spontaneously occurring somatic GCaMP6f Ca2+ transients in multiple individual cells, and estimated the neural spiking rates through deconvolution of calcium transients (SI Materials and Methods). The mice were awake and reactive, as monitored by an infrared camera. A typical example of neural population activity is shown in Fig. 1A. To identify patterns of activity and USFs in populations of simultaneously recorded neurons, we studied the distribution of their time varying mean activity (see Materials and Methods and SI Materials and Methods for details). In Fig. 1, the USFs correspond to population activities in red and basal activities correspond to population activities in blue (Fig. 1 B and C). Interestingly, awake WT mice exhibited USFs with a frequency similar to that observed in humans (below 0.1 Hz) (17, 31). These frequencies are slower than those observed in the cardiac (0.6–1.2 Hz) and respiratory cycles (0.1–0.5 Hz) (31). The activity patterns were then analyzed to detect synchronous activity in populations of simultaneously imaged neurons, as previously described (20) (Materials and Methods). The number of simultaneously imaged cells ranged from 4 to 71 neurons, with a mean value of 36 neurons (n = 2,900 cells in 7 mice). In the awake state, we detected robust synchronicity in the neuronal populations (Fig. 1D1). Our recordings indicate that, similar to awake humans, the ongoing activity in a mouse brain constantly fluctuates and exhibits synchronously firing neuronal activity, making the mouse a reliable model for studying some of the elementary physiological processes associated with conscious processing in humans.
Fig. S1.
Two-photon imaging technique and labeling of PFC neurons with GCaMP6f. (A) Photograph of chronic cranial window (5-mm diameter). (B) Coordinates used for the injection of the GCaMP6f: AP, + 2.8 mm from Bregma; L, ± 0.5 mm; and DV, −0.5 to –0.1 mm from the skull surface. The arrows indicate the injection in the PrLC. The scheme was adapted with permission from ref. 52. (C) In vivo two-photon image of GCaMP6 labeled neurons in layer II/III of PFC. (Scale bar, 50 μm.) (D) Mosaic of a 40-μm coronal section from a WT mouse with GCaMP6f expression (green) and DAPI (blue). (E) Magnification of the cells in D. (Scale bar, 50 μm.)
Fig. 1.
Effect of general anesthesia on USFs and synchronously firing neurons in WT mice. (A) Representative rasterplots for one population of simultaneously recorded neurons in a WT mouse in the awake (A1) and anesthetized state (A2). Each row corresponds to the spiking activity of one neuron. (B) Mean neural activity for the populations in A in the awake (B1) and anesthetized state (B2). Red and blue correspond to USFs and basal activity states, respectively. Dotted red line: computed threshold. (C) Probability density function (pdf) of the population activity exhibited in B in the awake (C1) and anesthetized state (C2) for determining the threshold (red dotted line) between USFs and basal activity. Black line: Gaussian smoothed pdf, red bars: USFs and blue bars: basal activity. (D) Histogram representing the percentage of cells active in small time bins (∼0.144 s), for the population activity in A in the awake (D1) and anesthetized state (D2). Asterisks: significant peaks of synchrony. (E) Computed percentage of cells exhibiting USFs. (F) Percentage of populations with synchronous activity in the awake and anesthetized state. (A1–D1) Awake and (A2–D2) anesthetized mice.
USFs Persist Under Light General Anesthesia, but Synchronicity Is Disrupted.
General anesthesia differentially alters states of consciousness and access to conscious content (8). The ability of general anesthesia to induce safe and reversible loss of consciousness poses the most complex question of how a simple chemical can affect conscious experience (32). General anesthetics may directly or indirectly affect conscious processing by the cerebral cortex (33); however, the neurobiological mechanisms involved in this interaction are largely unknown. We thus performed Ca2+ imaging of mainly pyramidal cells in the PrLC of lightly anesthetized WT mice (0.8% isoflurane), and compared their activity patterns with those recorded in awake mice (Fig. 1 A2–D2). Interestingly, the USFs persist under light general anesthesia, with no significant difference between the populations that exhibit USFs in the awake state (90.30 ± 5.03%, n = 2,900 cells in 7 mice) compared with the anesthetized state (88.38 ± 5.82%, n = 702 cells in 3 mice; ANOVA) (Fig. 1E). However, we observed a robust reduction of the synchronously firing populations under anesthesia (55.87 ± 11.38%), compared with awake mice (95.35 ± 3.67, P < 0.001) (Fig. 1F). Therefore, USFs share similar mechanisms between awake and anesthetized conditions but anesthesia shows strong inhibitory effects on the generation of neuronal synchronicity.
Differential Role of nAChRs in the Generation of USFs and Synchronicity in the Awake State.
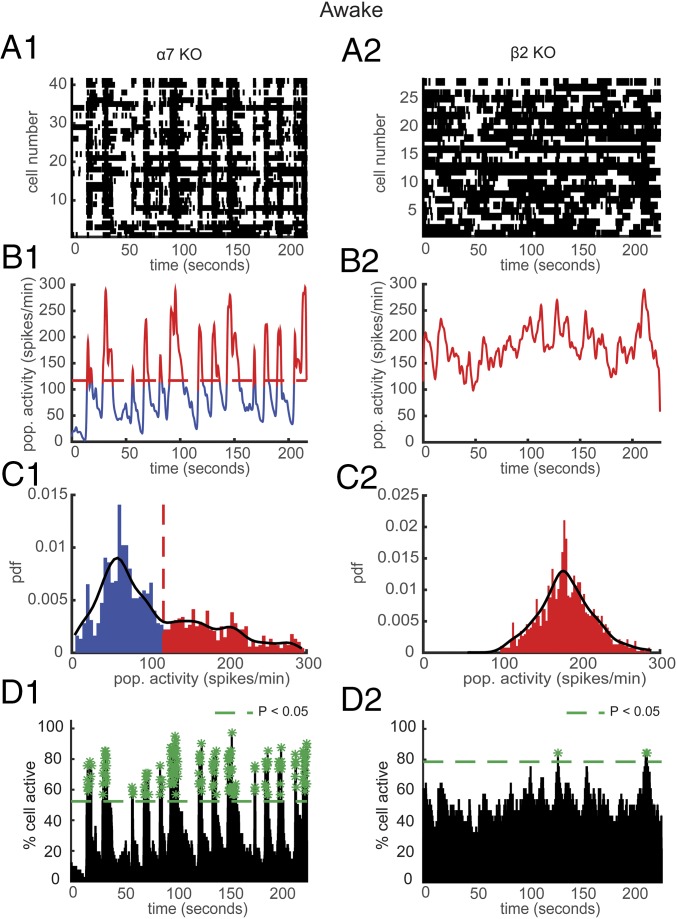
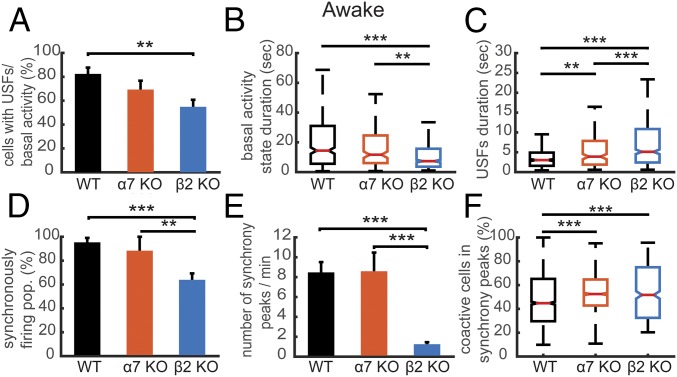
Many studies in both animal models and humans have identified a contribution of nAChRs to cognitive functions; we thus investigated the occurrence of USFs transitions in KO mice of α7 and β2 nAChR subunits. Typical examples of neuronal population activities in awake α7 and β2 KO mice are shown in Fig. 2. We found that 90.30 ± 5.03% of simultaneously recorded populations exhibited USFs/basal activity in WT (n = 2,900 cells in 7 mice), 82.08 ± 7.2% in α7 KO mice (n = 1,403 cells in 5 mice), and 65.86 ± 5.7% in β2 KO mice (n = 3,459 cells in 11 mice) with a significant difference between WT and β2 KO groups (P = 0.0130, ANOVA) (Fig. S2). In each population of simultaneously recorded neurons with USFs/basal activity transitions, we determined the percentage of cells that exhibit an activity pattern in accordance with the population activity. In awake WT animals, 96.6 ± 1.8% of cells fire in accordance with their population activity, in α7 KO mice (88.23 ± 4.12%) and in β2 KO mice (84.37 ± 2.27%) (Fig. S2). To compute the percentage of cells with USFs/basal activity for each mouse group, we multiplied the percentage of populations with USFs/basal activity with the mean percentage of cells in accordance with the population patterns of activity, for each mouse. Interestingly, we found that 82.41 ± 5.28% of simultaneously recorded cells exhibited USFs in WT, 69.31 ± 7.4% in α7 KO mice, and 54.85 ± 5.9% in β2 KO mice, with a significant difference between WT and β2 KO mice (P = 0.007) (Fig. 3A).
Fig. 2.
Consequences of the α7 and β2 nAChR deletion on USFs and synchronously firing neurons in the awake state. (A) Representative rasterplots for one population of simultaneously recorded neurons in α7 (A1) and β2 (A2) KO awake mice. Each row corresponds to the spiking activity of one neuron. (B) Mean neural activity for the populations in A in α7 (B1) and β2 (B2) KO awake mice. Red and blue correspond to USFs and basal activity states, respectively. Dotted red line: computed threshold. (C) Probability density function (pdf) of the population activity exhibited in B in α7 (C1) and β2 (C2) KO awake mice for determining the threshold (red dotted line) between USFs and basal activity. Black line: Gaussian smoothed pdf, red bars: USFs and blue bars: basal activity. (D) Histogram representing the percentage of cells active in small time bins (∼0.144 s), for the population activity in A in α7 (D1) and β2 (D2) KO awake mice. Asterisks: significant peaks of synchrony. (A1–D1) α7 KO and (A2–D2) β2 KO mice.
Fig. S2.
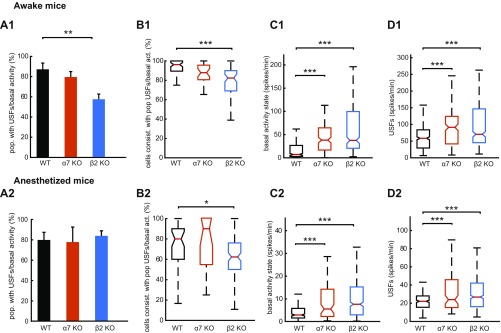
Properties of USF transitions in awake and anesthetized mice. (A) Computed percentage of populations that exhibit USFs for each animal type in the awake (A1) and anesthetized state (A2). β2 KO mice have a significantly lower proportion of populations that exhibit USFs compared with WT animals in the awake state. (B) Percentage of cells consistent with populations that exhibit USFs for each animal type in the awake (B1) and anesthetized states (B2). In β2 and α7 KO animals, less cells are consistent with populations that exhibit USFs compared with WT mice in the awake state, whereas in the anesthetized state only β2 KO are significantly different from WT mice (P = 0.005). (C) Boxplots of basal activity states for each mouse type (spikes per minute) in the awake (C1) and anesthetized states (C2). β2 and α7 KO animals exhibit significantly higher basal activity compared with WT mice for both the awake and anesthetized state. (D) Boxplots of USFs for each mouse type (spikes per minute) in the awake (D1) and anesthetized states (D2). β2 and α7 KO animals exhibit significantly higher USFs compared with WT mice for both awake and anesthetized state. (A1–D1) Awake and (A2–D2) anesthetized mice. *P < 0.05, **P < 0.01, and ***P < 0.001; ANOVA in A; Kruskal–Wallis in B–D.
Fig. 3.
Comparison of the properties of USFs and synchronicity in awake mice. (A) Percentage of cells with USFs for each animal type in the awake state. (B) Boxplots of basal activity durations for each animal type in the awake state. (C) Boxplots of USF durations for each animal type. (D) Percentage of populations exhibiting synchronous activity for each mouse type in the awake state. (E) Mean number of synchrony peaks per minute for the different animal groups in the awake state. (F) Percentage of coactive cells in the peaks of synchrony for the different animal groups in the awake state. For all comparisons: *P < 0.05, **P < 0.01, and ***P < 0.001; ANOVA in A, D, E, and F; Kruskal–Wallis in B and C.
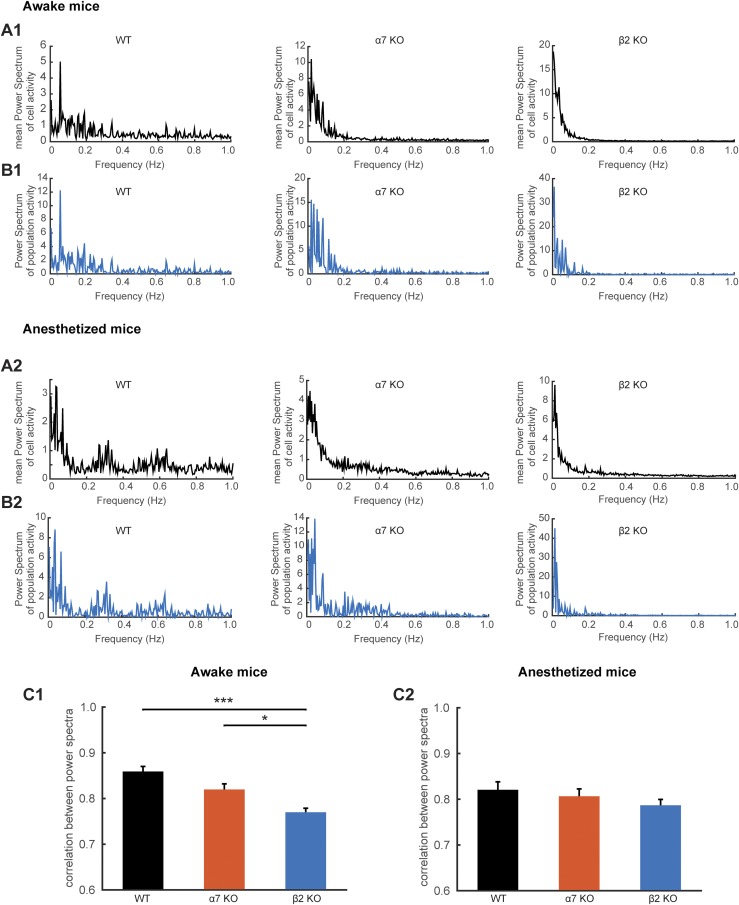
Next, we computed the USFs/basal activity properties in all populations. The basal activity duration was significantly lower for the β2 KO mice (7.36 ± 1.19 s), compared with α7 KO (11.69 ± 2.43 s, P = 0.0021) and WT mice (14.43 ± 1.54 s, P < 0.001) (Fig. 3B), whereas the USFs duration was significantly higher for the β2 KO mice (5.11 ± 0.64 s), compared with α7 KO (3.89 ± 0.65 s, P = 0.0022) and WT mice (3.03 ± 0.38 s, P < 0.001, Kruskal–Wallis) (Fig. 3C). Furthermore, computing the correlation between power spectra for each neuronal population for the different mice conditions in the awake state revealed that there are significantly lower correlations for β2 KO compared with WT mice (Fig. S3). These data indicate that the USFs of each cell in a population of simultaneously recorded cells are more homogeneous in the case of WT and α7 KO mice compared with β2 KO mice.
Fig. S3.
Power spectrum analysis for the different mouse types in the awake and anesthetized state. (A) Comparison of the mean power spectrum of the simultaneously recorded cell activity for WT, α7 KO, and β2 KO mice. The power spectrum analysis corresponds to the representative examples described in the main manuscript. (B) Comparison of the power spectrum of the population’s activity (mean spiking activity between simultaneously recorded cells). (C) Mean correlation between the mean power spectrum between simultaneously recorded cell activity and the power spectra of the population’s activity for the different mouse types. Awake: WT; 0.85 ± 0.014, α7 KO; 0.82 ± 0.015, β2 KO; 0.78 ± 0.01. Anesthetized: WT; 0.85 ± 0.021, α7 KO; 0.79 ± 0.02, β2 KO; 0.80 ± 0.016. (A1 and B1) Awake and (A2 and B2) anesthetized mice. *P < 0.05, **P < 0.01, and ***P < 0.001.
We then analyzed and compared the synchronicity in the different animal groups. In the WT and α7 KO mice, neurons displayed strong synchronous activity in 95.35 ± 3.67% (40 populations) and 88.33 ± 11.66% (38 populations) of the recorded populations, respectively, with no significant difference between groups (P = 0.70, ANOVA) (Fig. 3D). In the β2 KO mice, the patterns of activity were remarkably different from that in WT (P < 0.001) and α7 KO mice (P = 0.046), with synchronous activity detected in only 63.91 ± 5.38% of the recorded populations (99 populations) (Fig. 3D). The number of synchrony peaks detected was similar between WT mice (30.59 ± 3.73 peaks per minute) and α7 KO mice (31 ± 6.77 peaks per minute, P = 0.99), whereas a robust decrease was observed in the case of β2 KO mice (4.52 ± 0.72 peaks per minute, P < 0.001, ANOVA) (Fig. 3E). In addition, the percentage of coactive cells in the peaks of synchrony was significantly higher for α7 KO (53.34 ± 0.51%) and β2 KO mice (53.30 ± 1.05%) compared with the WT mice (47.71 ± 0.47%, P < 0.001) (Fig. 3F).
Overall, USFs were still detected in mice with deleted nAChR subunits. However, β2 KO mice showed reductions in the percentage of cells that exhibit USFs and a strong decrease in the percentage of synchronously firing neuronal populations. These data indicate a potentially major role for β2 subunits in the generation of physiological phenomena associated with conscious processing in the awake state.
Role of nAChRs in Ongoing Activity Under General Anesthesia.
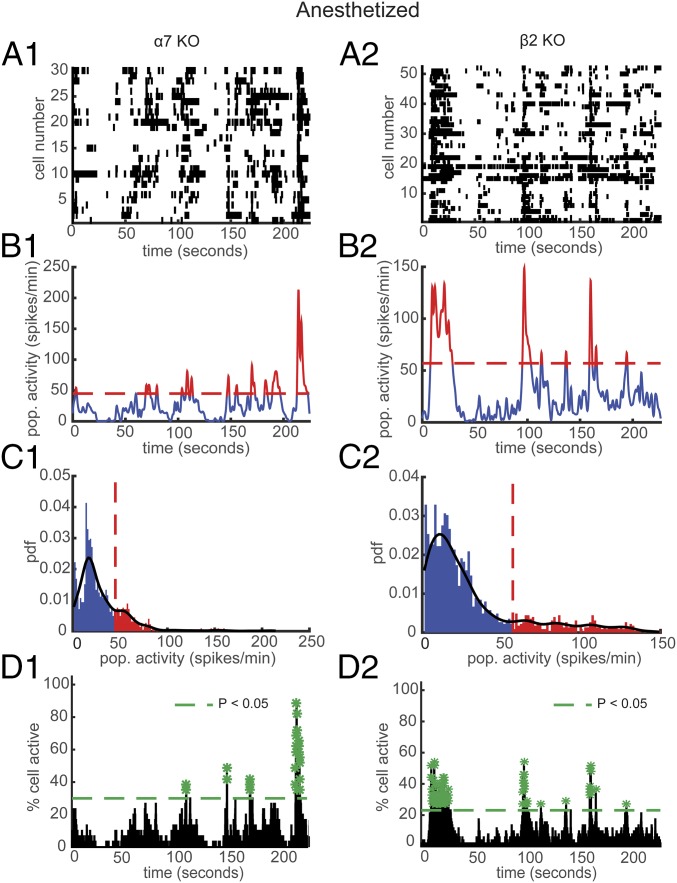
The nAChRs are possible direct/indirect targets of general anesthetics and as a consequence may interfere with cholinergic transmission. For example, the volatile anesthetic isoflurane shows high affinity for nAChRs (34). However, isoflurane inhibition has been found to vary with nAChR subunit composition (35). We aimed to study in vivo the contribution of defined nAChR subunits to spontaneous activity under conditions of light general anesthesia. Typical examples of the effect on the neuronal population activity in α7 and β2 KO anesthetized mice are shown in Fig. 4. We found that 88.4 ± 5.8% of simultaneously recorded populations exhibited USFs/basal activity in WT (n = 702 cells in 3 mice), 76.6 ± 14.5% in α7 KO (n = 389 cells in 4 mice), and 85.7 ± 4.9% in β2 KO (n = 522 cells in 4 mice), with no significant difference between the groups (Fig. S2). Furthermore, in WT mice 96.42 ± 4.28% of cells fire in accordance with their population activity, 91.66 ± 6.55% in α7 KO mice, and 83.82 ± 2.2% in β2 KO mice (Fig. S2).
Fig. 4.
Effect of general anesthetic on USFs and synchronously firing neurons in α7 and β2 KO mice. (A) Representative rasterplots for one population of simultaneously recorded neurons in α7 (A1) and β2 KO (A2) anesthetized mice. (B) Mean neural activity for the populations in A in α7 (B1) and β2 KO (B2) anesthetized mice. Red and blue correspond to USFs and basal activity states, respectively. Dotted red line: computed threshold. (C) Probability density function (pdf) of the population activity in B in α7 (C1) and β2 KO (C2) anesthetized mice. (D) Histogram representing the percentage of cells active in small time bins (∼0.144 s) for the population activity in A in α7 (D1) and β2 KO (D2) anesthetized mice. Asterisks: significant peaks of synchrony. (A1–D1) α7 KO and (A2–D2) β2 KO mice.
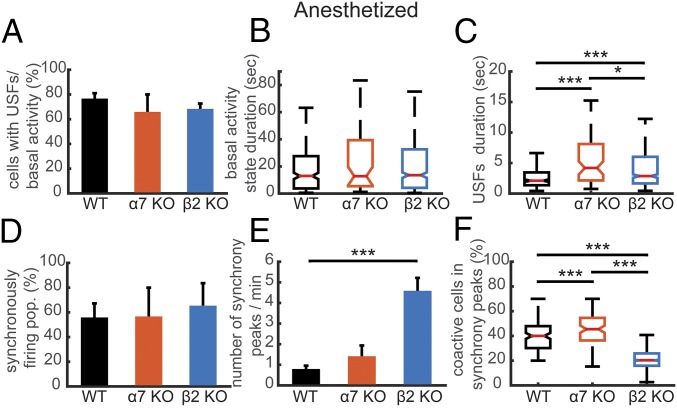
We also found that 76.68 ± 4.35% of simultaneously recorded cells exhibited USFs in WT mice, 65.89 ± 14.16% in α7 KO mice, and 68.35 ± 4.3% in β2 KO mice, with no significant difference (Fig. 5A). Next, we computed the USFs/basal activity properties in all populations. Under anesthesia, there were no significant changes of basal activity state duration between animal types (P > 0.14, Kruskal–Wallis), nor any significant changes in variability (P > 0.49, Ansari–Bradley) (Fig. 5B). Conversely, the USF duration was significantly higher for the α7 KO mice (4.19 ± 2.57 s) and β2 KO mice (2.86 ± 0.55 s), compared with WT mice (2.11 ± 0.40 s, P < 0.001) (Fig. 5C). In addition, there were no significant differences in the correlations of power spectra between the different mouse types in the anesthetized state (Fig. S3).
Fig. 5.
Comparison of the properties of USFs and synchronicity in anesthetized mice. (A) Percentage of cells with USFs for each animal type in the anesthetized state. (B) Boxplots of basal activity durations for each animal type in the anesthetized state. (C) Boxplots of USF durations for each animal type in the anesthetized state. (D) Percentage of populations with synchronous activity, for each mouse type in the anesthetized state. (E) Mean number of synchrony peaks per minute for the different animal groups in the anesthetized state. (F) Percentage of coactive cells in the peaks of synchrony for each animal type in the anesthetized state. For all comparisons: *P < 0.05, **P < 0.01, and ***P < 0.001; ANOVA in A, D, and E; Kurskal–Wallis in B and C.
For anesthetized animals, the number of simultaneously imaged cells in the same focal plane ranged from 3 to 96 neurons, with a mean value of 23 neurons. Of simultaneously recorded populations, 55.87 ± 11.38% exhibited synchronous activity in WT mice (54 populations), 56.66 ± 23.33% in α7 KO mice (25 populations), and 65.41 ± 18.20% in β2 KO mice (129 populations), with no significant differences (P > 0.9) between groups (Fig. 5D). Interestingly, in the anesthetized state, the number of synchrony peaks detected was similar between WT mice (0.79 ± 0.16 peaks per minute) and α7 KO mice (1.41 ± 0.52 peaks per minute), whereas a robust increase was observed in the case of β2 KO mice (4.58 ± 0.62 peaks per minute, P < 0.001) (Fig. 5E). Finally, the percentage of coactive cells in the peaks of synchrony was significantly higher for the WT mice (41.03 ± 1.03%) and α7 KO mice (46.30 ± 1.25%) compared with β2 KO mice (21.74 ± 0.19%, P < 0.001, ANOVA) (Fig. 5F).
To summarize these results, the deletion of nAChR α7 and β2 subunits has differential effects in awake mice on USFs duration, whereas in the anesthetized state, β2 deletion alone increases synchronicity and decreases the percentage of coactive cells in the peaks of synchrony, compared with WT and α7 KO mice.
Chronic Exposure to Mecamylamine Mimics β2 KO Phenotype.
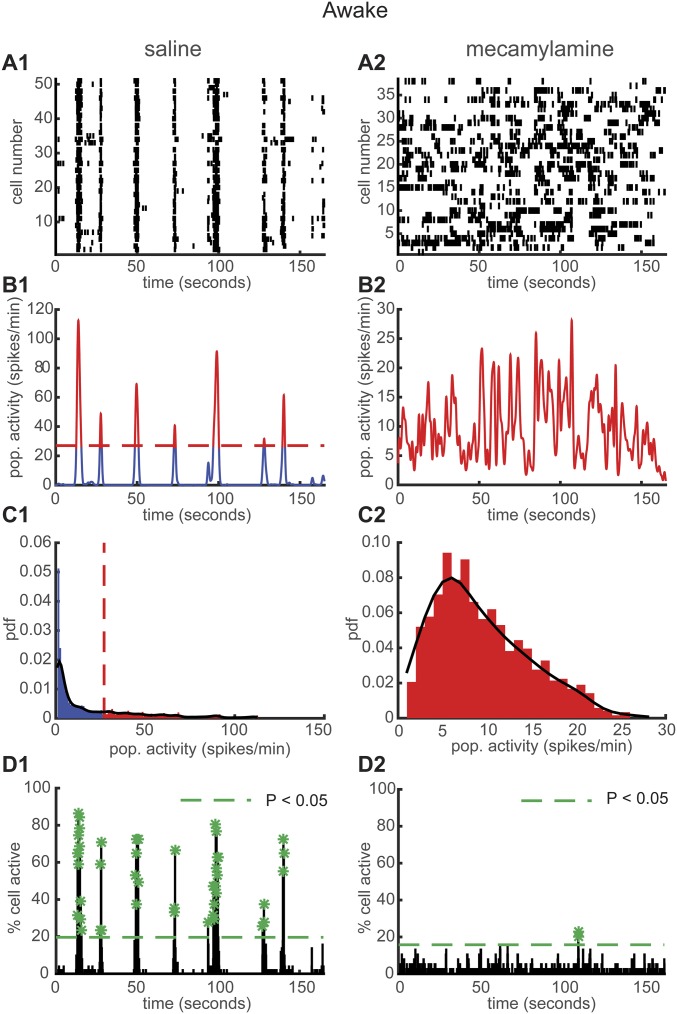
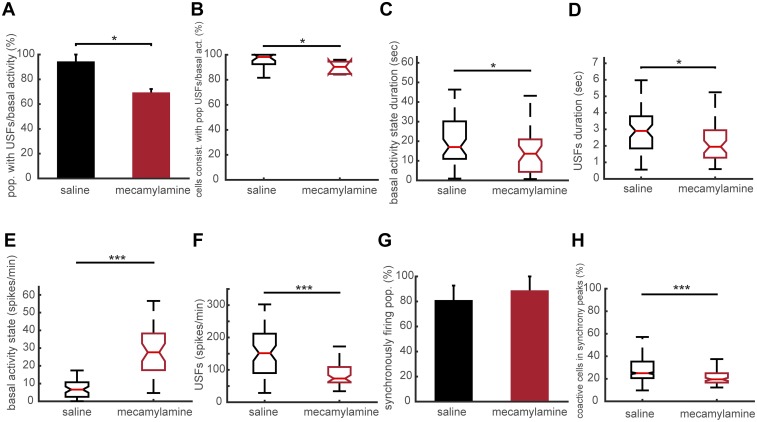
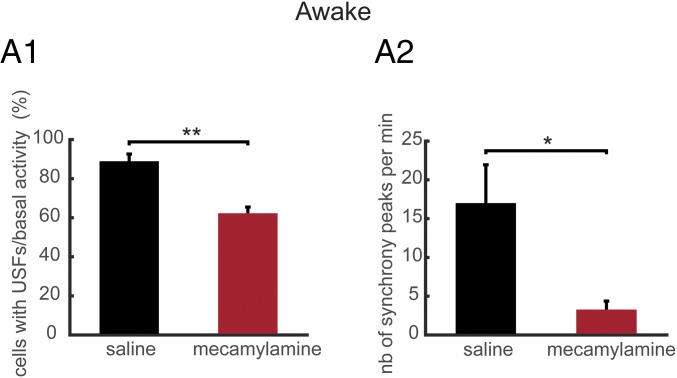
Finally, we aimed to compare the neuronal activity patterns in the PFC of WT mice after chronic application of mecamylamine, a nonselective, noncompetitive antagonist of nAChRs. Osmotic minipumps for the infusion of either saline or mecamylamine (1 mg/kg per day for mecamylamine) were implanted subcutaneously at the nape of the neck of WT mice. We recorded the neuronal activity patterns 7 d after minipump impantation. Typical examples of neuronal population activities in awake mice under saline or mecamylamine are shown in Fig. S4. We found that 94.44 ± 5.55% of simultaneously recorded populations exhibited USFs/basal activity in WT under saline condition (n = 743 cells in 3 mice) and 69.44 ± 2.77% in WT under mecamylamine (n = 446 cells in 3 mice) with a significant difference between the two groups (P = 0.015) (Fig. S5A). In awake WT animals under saline conditions, 98.21 ± 2.4% of cells fire in accordance with their population activity, whereas in WT under mecamylamine 90.32 ± 2.4% of cells were in accordance (P = 0.041) (Fig. S5B). In addition, we found that 88.91 ± 3.67% of simultaneously recorded cells exhibited USFs in WT under saline, whereas a significant reduction was observed for the WT mice under mecamylamine (62.28 ± 3.18%, P = 0.0054) (Fig. 6A1). The basal activity duration was significantly lower for the WT mice under mecamylamine (13.62 ± 3.97 s), compared with WT under saline (17.02 ± 4.18 s, P = 0.018) (Fig. S5C). Furthermore, USF duration was significantly higher for WT under saline (2.90 ± 0.28 s), compared with WT under mecamylamine (1.95 ± 0.45 s, P = 0.011) (Fig. S5D).
Fig. S4.
Chronic exposure to mecamylamine resembles the β2 KO phenotype. (A) Representative rasterplots for one population of simultaneously recorded neurons in awake WT mice under saline (A1) or mecamylamine (A2) infusion at 7 d after implantation of minipumps. (B) Mean neural activity for the populations in A in WT awake mice under saline (B1) or mecamylamine (B2). Red and blue correspond to USFs and basal activity states, respectively. Dotted red line: computed threshold. (C) Probability density function (pdf) of the population activity exhibited in B in WT awake mice under saline (C1) or mecamylamine (C2). (D) Histogram representing the percentage of cells active in small time bins (∼0.144 s) for the population activity in A in WT awake mice under saline (D1) or mecamylamine (D2). Asterisks: significant peaks of synchrony.
Fig. S5.
Properties of USF transitions in awake WT mice under saline or mecamylamine infusion for 7 d. (A) Computed percentage of populations that exhibit USFs for awake WT mice under saline or mecamylamine infusion at 7 d post implantation of minipump. WT mice under mecamylamine have a significantly lower proportion of populations that exhibit USFs compared with WT mice under saline. (B) Percentage of cells consistent with populations that exhibit USFs for awake WT mice under saline or mecamylamine infusion. In WT animals under mecamylamine less cells are consistent with populations that exhibit USFs compared with WT mice under saline (P = 0.005). (C) Boxplots of basal activity durations for each condition in the awake state. WT mice under mecamylamine have a significantly lower basal activity state duration compared with WT under saline. (D) Boxplots of USFs durations for each condition in the awake state. WT mice under mecamylamine have significantly lower USF duration compared with WT under saline. (E) Boxplots of basal activity states for each condition (spikes/min) in the awake state. WT mice under mecamylamine exhibit significantly higher basal activity compared with WT mice under saline. (F) Boxplots of USFs for each condition (spikes per minute) in the awake state. WT mice under mecamylamine exhibit significantly lower USF activity compared with WT mice under saline. (G) Percentage of populations (simultaneously imaged neurons) exhibiting synchronous activity, for each condition in the awake state. No significant difference between WT mice under saline of mecamylamine infusion. (H) Percentage of coactive cells in the peaks of synchrony for the two conditions in the awake state. *P < 0.05, **P < 0.01, and ***P < 0.001; ANOVA in A, G, and H; Kruskal–Wallis in B–F.
Fig. 6.
Chronic exposure to mecamylamine mimics β2 KO phenotype. (A1) Percentage of populations that exhibit USFs for awake WT mice under saline or mecamylamine conditions at 7 d after implantation of minipumps. (A2) Mean number of synchrony peaks per minute for awake WT mice under saline or mecamylamine infusion 7 d after implantation of minipumps. *P < 0.05, **P < 0.01, and ***P < 0.001; ANOVA.
We then analyzed and compared the synchronicity under saline and mecamylamine infusion. In the WT mice under saline, neurons displayed synchronous activity in 81.11 ± 11.60% of the recorded populations, whereas in WT mice under mecamylamine 88.89 ± 11.11% of the recorded populations had synchronous activity, with no significant difference between groups (P = 0.65) (Fig. S5E). However, the number of synchrony peaks detected was strongly decreased in WT mice under mecamylamine (3.27 ± 1.09 peaks per minute) in comparison with WT mice under saline (17 ± 4.94 peaks per minute, P = 0.036) (Fig. 6A2). In addition, the percentage of coactive cells in the peaks of synchrony was significantly lower for WT under mecamylamine (21.86 ± 0.80%) compared with the WT mice under saline (28.64 ± 0.8%, P < 0.001) (Fig. S5F). Thus, pharmacological exposure to the nicotinic antagonist mecamylamine gives a phenotype similar to that found in β2 KO mice.
SI Materials and Methods
Mice.
All experiments were performed on male mice at 3 months of age. Male α7 KO, β2 KO, and WT (C57BL/6J) mice used in the present study were maintained at Charles River Laboratories (L’Arbresle, France). The experiments described in this study were conducted in accordance with the guidelines on the ethical use of animals from the European Community Council Directive of November 24, 1986 (86/609/EEC) and in accordance with institutional animal welfare guidelines and were approved by Animalerie Centrale and Médecine du Travail, Institut Pasteur.
Chronic Cranial Windows and Stereotaxic Injections.
Anesthesia was induced with ketamine (Imalgen 1000; Rhone Mérieux) and xylazine (Rompun; Bayer AG), 10 mL/kg, intraperitoneally, and the mouse was secured in a stereotaxic frame. The eyes were protected with artificial tear ointment and body temperature was maintained with a feedback-heating pad. The scalp was washed thoroughly with betadine and 70% (vol/vol) ethanol and all surgical tools were sterilized. Xylocaine (1%) was used for local anesthesia and the skull was exposed. As previously described (48), a chronic cranial window was prepared and 200 nL of [serotype 1 (rep/cap: 2/1)] AAV virus (AAV.syn.GCaMP6f.WPRE.SV40, 2.2e13 GC/mL; University of Pennsylvania Vector Core) was injected bilaterally at the following coordinates PrLC: AP, +2.8 mm from Bregma; L, ±0.5 mm; and DV, −0.5 to −0.1 mm from the skull using a Nanoject II (Drummond Scientific) at the slow infusion setting. The glass pipette was left for 5 min in the brain before slowly being removed. A 5-mm-diameter circular coverglass was placed on the brain surface and the edge was sealed to the skull with dental cement (Coffret SUPERBOND complete, Phymep). A sterile small stainless steel head bar with a screw hole was glued to the skull and the surrounding exposed skull was covered with dental cement.
Mouse Handling for Awake Imaging.
For 3–5 d mice were habituated to the imaging environment by handling and training, as previously described (49).
Immunofluorescence.
Immunofluorescence was performed to identify the area of injection at the end of the two-photon imaging experiments. Mice were transcardiac-perfused with 4% (wt/vol) PFA, the brains were removed and postfixed with immersion in PFA for 2 d at 4 °C, followed by immersion in 30% (wt/vol) sucrose in PBS overnight for cryoprotection. Using a sliding microtome (Leica Microsystems), serial 40-µm coronal sections were cut, mounted on slides, and cover-slipped with ProLong Gold antifade reagent containing DAPI (Invitrogen). Microscopy was carried out using a Zeiss fluorescence microscope.
In Vivo Two-Photon Imaging.
In vivo imaging was performed with an Ultima IV two-photon laser-scanning microscope system (Bruker), using a 16× 0.8 NA water immersion objective (Nikon) with a femtosecond laser (MaiTai DeepSee, Spectra Physics) tuned to 950 nm. Time-series movies of neuronal populations expressing GCaMP6f were acquired at 7 Hz. Each focal plane movie duration was 3.6 min (1,500 frames) to track the spontaneous neuronal activity. For anesthetized mice, recordings were conducted under light isoflurane anesthesia (0.8% isoflurane in O2).
Recordings in Anesthetized Mice.
The mouse was placed into a transparent induction chamber (Harvard Apparatus) and anesthesia was induced at a concentration of 5% (vol/vol) vaporized isoflurane/O2 (Forene, Abbott France; vaporizer, Harvard Apparatus) leading to a rapid induction of anesthesia within 30 s, as tested by loss of righting reflex and pain with a tail pinch. The mouse was then removed from the induction chamber and immediately secured to the mouse frame on the two-photon microscope stage. The mice were continuously supplied with 0.8% isoflurane/O2 through a facemask. Body temperature was maintained at 37 °C using a thermometer feedback thermal blanket. Artificial tear ointment was also applied to the eyes to prevent dryness. The recordings started ∼15 to 20 min after placing the animal on the stage and anesthesia was maintained constant until the end of the experiments, as previously described (33). Under these conditions the mice were completely immobile, had no reaction to tail pinch, and eyelid reflex was absent.
Data Analysis.
We performed image analysis with ImageJ software. The time series were stabilized using the FIJI plugin “Image Stabilizer” (www.cs.cmu.edu/∼kangli/code/Image_Stabilizer.html). Regions of interest were manually selected in FIJI and detection of Ca2+ transients for each neuron was performed in MATLAB based on a previously described method (50). We then assumed the smallest and fasted Ca2+ transients were a result of a single action potential. The mean shape and amplitude of this unitary event was used as a kernel for deconvolution to best estimate action potential or spike frequency. The custom-written toolbox in MATLAB (Mathworks, 2014b) is available upon request.
For the analysis of USFs, the time-varying population activity was computed as the mean activity across neurons for each time bin, and was smoothed through Gaussian filtering. The distribution (pdf estimate) of the activity values was plotted at each time point that exhibits multimodality or unimodality. To identify the type of modality of the distribution, we used Gaussian filtering (black lines in Fig. 1C). The number of peaks determined the types of activity: multiple peaks are the signatures for USFs vs. basal activity states. The threshold between USFs vs. basal activity states was computed by taking the minimum of the multimodal distributions between the highest amplitude peak and its neighboring peak (red dotted lines in Fig. 1C). In some cases, where one of the activity states was very short (in the case of WT), a Gaussian or logistic function could be fitted around the highest amplitude peak (according to the root mean-square error output), and the activity state with low durations could be identified by taking values >99% or <1% of the cumulative sums. The USFs correspond to population activities in red, and basal activities correspond to population activities in blue (Fig. 3C). Our analysis method is based on a previously described technique (51).
We identified synchronously firing neurons based on a method that was previously described (20). For each population, small time bins (∼0.144 s) were used to sum the spiking activity of all of the cells. To identify peaks of synchronous activity that included more cells than expected by chance, interval reshuffling (randomly reordering of intervals between events for each cell) was used to create sets of event sequences. Reshuffling was carried out 1,000 times for each population and a histogram was constructed for each reshuffling. The threshold corresponding to a significant level of P < 0.05 (green dotted line) was estimated as the number of coactive cells exceeded in a time bin in only 1% of these histograms.
Statistical Analysis.
Kruskal–Wallis one-way ANOVA combined with multiple-comparison testing was applied to the activities (spikes per minute) of the neurons in all mouse groups to study the statistical similarities. Levene’s test was used to compare the variation within each data group. The variance was similar between the groups that were statistically compared. A one-way ANOVA test was used to compare the populations with USFs, the cells that exhibit USFs, the mean synchronously firing populations, the mean coactive cells in synchrony peaks, and the number of synchrony peaks.
Discussion
In humans, two distinct modes of electrical activation of the cerebral cortex have been recorded: a rapid and sustained activation, termed “ignition,” which is viewed as a signature of conscious access; and synchronous USFs with low amplitude, which characterize the spontaneous activity mode, termed “resting state” (19). In the resting state, in the absence of explicit task performance or external stimulus perception, the cortex exhibits a highly informative mode of spontaneous activity. Studies in anesthetized animals (21) and in humans with blood-oxygen level-dependent fMRI data (27), together with animal recordings of firing-rate modulations (23), and EEG (22) and ECoG in humans (23, 36), reveal ultraslow (<0.1 Hz) dynamic activations with low amplitude, that we termed USFs, which may be viewed as characterizing the resting state. Here, we aimed to elucidate the mechanisms engaged in these cortical activity dynamics at a single-cell resolution using in vivo two-photon imaging in the mouse. We recorded ongoing spontaneous activity in the PFC of WT and mice deleted for specific nAChR subunits, both in awake and anesthetized states. Interestingly, we recorded USFs in the mouse cortex and found that anesthesia shows inhibitory effects by disrupting the synchronous USFs’ firing of neurons. We further showed that, first, nAChRs have an important role in the generation of USFs, yet to a different extent during quiet wakefulness and anesthesia, and that the β2 subunit is specifically required for synchronized activity patterns. Our recordings indicate that, similar to humans, the ongoing activity in mouse brain constantly fluctuates and exhibits synchronously firing neuronal activity, making the mouse a reliable, although simplified model, for studying mechanisms of conscious processing in humans.
Current theories consider the PFC as a key player in conscious processing (6). According to the Global Neuronal Workspace (GNW) theory, a subset of cortical pyramidal cells with long-range excitatory axons that are particularly dense in prefrontal, cingulate, and parietal regions, together with the relevant thalamo-cortical loops, form a horizontal “neuronal workspace” interconnecting the multiple specialized, automatic, and nonconscious processors. A conscious content is assumed to be encoded by the “all or none” sustained and synchronous ignition of a fraction of GNW neurons (7, 8). In these circumstances, the nonamplified neurons would be inhibited and the GNW sustained ignition would represent the conscious content. In the PFC, pyramidal neurons in layer II/III do not express nAChRs, only interneurons do, in contrast to layers V and VI, where nAChRs are also expressed by pyramidal neurons (37). In addition, pyramidal neurons with long axons, which have been postulated to play a critical role in the GNW theory (38), are more abundant in these particular layers of the cerebral cortex and especially in the PFC (39). By recording neuronal activity patterns in layer II/III of PFC, we found that α7 and β2 nAChRs play an important role in the generation of USFs that occur, yet to a different extent during quiet wakefulness and anesthesia. We showed that the balance of recurrent excitation and inhibition is disrupted in the case of awake β2 KO mice, and more specifically, the neuronal synchronicity is disrupted. It has been reported that the β2 subunit is involved in the dendritic morphogenesis of pyramidal neurons, and in particular, in the circuits that contribute to the high-order functional connectivity of the cerebral cortex (40). These defects in the maturation of the cerebral cortex that have been reported in the β2 KO mice could contribute to the observed behavioral deficits (4, 13, 16). However, our data reveal that pharmacological intervention with nicotinic antagonists is enough for the disruption of USF mechanisms. Our findings suggest an important contribution of nAChRs in the processing of neural information during quiet wakefulness.
Moreover, an important role of the cholinergic innervation of the cerebral cortex was postulated (41) to be the mediation of arousal state. This hypothesis was based on the initial observation that the cholinergic inputs are diffusely distributed in the cerebral cortex and, most interestingly for us, exhibits a slow release of ACh on the same time scale as the USFs. Several studies have further shown that cholinergic projections to the cortex are involved in sustained attention and cue detection, with the level of ACh efflux in the PFC correlating with the demand upon attention during attentional tasks (42). The slow fluctuations in ACh levels correlate with a shift in behavior, indicating that these fluctuations could correlate with decision-making (42, 43). Indeed, experimental evidence from both rodents and humans revealed that ACh release contributes to mechanisms that mediate the integration of external cues with internal representations to initiate and guide behavior (44). At the scale of seconds, ACh undergoes phasic release, which may exert a top-down control over defined cognitive operations; muscarinic ACh receptors also play an important role in attentional behavior and cue detection (45). Recently, it has been shown in vitro that endogenously released ACh can modulate up and down states through the activation of nAChRs (46). The alterations of neuronal activity patterns that our results revealed in the nAChR KO mice could further our understanding of the cholinergic system in higher brain functions and, when disrupted, the contribution of nAChRs to cognitive disorders.
The focus of the present study was to elucidate the role of nAChRs in PFC activity patterns when comparing resting-state dynamics in awake and anesthetized animals. Because ongoing spontaneous activity has been postulated to have a significant functional role in cortical functions (47), we focused on how it differs between awake and anesthetized states. The production of USFs was identified and compared among the different conditions investigated. Our work demonstrates, in vivo, that nAChRs play a crucial role in the modulation of PFC synchronous spontaneous neuronal activity. Furthermore, with recent studies probing the mechanisms of general anesthesia as causing loss of consciousness, our work exploring the effects of anesthesia on nAChRs in the PFC network in vivo, at a cellular resolution, reveals an elaborate mechanism for modulating cortical activity. Our results provide a starting point for understanding the relationship between nAChRs and loss of consciousness under light anesthesia in mice that might potentially be a reliable—although highly simplified—model for studying mechanisms of conscious processing in humans. As a future goal, it is important to consider additional studies to evaluate the presence of USFs during behavioral assays. Because several studies have shown that deletion in mice of the α7 and β2 subunits impairs behaviors, such as exploratory behavior and attention, it will be important to investigate the behavioral deficits in parallel with neuronal recordings to establish a causal relationship.
Materials and Methods
Male α7 KO, β2 KO, and WT (C57BL/6J) mice used in the present study were maintained at Charles River Laboratories (L’Arbresle, France). The experiments described in this study were conducted in accordance with the guidelines on the ethical use of animals from the European Community Council Directive of November 24, 1986 (86/609/EEC) and in accordance with institutional animal welfare guidelines, and were approved by Animalerie Centrale and Médecine du Travail, Institut Pasteur and the Institut Pasteur Ethics Committee, CETEA, protocol numbers 2013-0056, 2013-0104, and 2015-0007.
Chronic cranial windows were performed as previously described (48) and 200 nL of AAV.syn.GCaMP6f was injected bilaterally in the PFC. Two-photon experiments were performed with an Ultima IV two-photon laser-scanning microscope system (Bruker), at a frame rate of 7 Hz. For data analysis we used ImageJ software and we developed a custom-written toolbox in MATLAB. Full methods are described in SI Materials and Methods.
Acknowledgments
We thank David DiGregorio for managing the imaging platform of the Department of Neuroscience, funded by Ile-de-France Domaine d'Intérêt Majeur (NeRF/DIM); Kurt Sailor for editing of the manuscript; Lars Eriksson and Philippe Faure for valuable suggestions on the manuscript; and the GENIE Program and the Janelia Research Campus, and specifically Vivek Jayaraman, Douglas S. Kim, Loren L. Looger, and Karel Svoboda from the GENIE Project, Janelia Research Campus, Howard Hughes Medical Institute for making the GCaMP6 available. This work was supported by the programme PasteurInnov 2012; the Fondation de la Recherche Médicale (FRM Grants SPF20140129365 and DPA20140629803), the Agence Nationale de la Recherche (ANR), ANR Neuroscience, by the Centre National de la Recherche Scientifique Unité Mixte de Recherche 3571; the Laboratoire d'Excellence LABEX BIO-PSY by the FP7 ERANET programme NICO-GENE, Grant Agreement n009 BLANC 20092009BLANC 20, by the European Commission FP7 RTD Project HEALTH-2009-Neurocyp.08-202088 Grant 242167, by the French National Cancer Institute Grant CANCEROPOLE IDF 2016-1-TABAC-01-IP-1 MASKOS (all to U.M.); and by the European Commission Flagship, the Human Brain Project (J.-P.C.). The laboratory of U.M. is part of the École des Neurosciences de Paris Ile-de-France RTRA network. F.K. is a scholar of the Pasteur Paris University Doctoral Program and received a stipend from the Stavros Niarchos Foundation and salary support from LABEX BIO-PSY. U.M. is a member of the LABEX BIO-PSY. As such this work was supported by French state funds managed by the ANR within the Investissements d'Avenir programme under reference ANR-11-IDEX-0004-02.
Footnotes
The authors declare no conflict of interest.
This article contains supporting information online at www.pnas.org/lookup/suppl/doi:10.1073/pnas.1614417113/-/DCSupplemental.
References
- 1.Dalley JW, Cardinal RN, Robbins TW. Prefrontal executive and cognitive functions in rodents: neural and neurochemical substrates. Neurosci Biobehav Rev. 2004;28(7):771–784. doi: 10.1016/j.neubiorev.2004.09.006. [DOI] [PubMed] [Google Scholar]
- 2.Khan ZU, Muly EC. Molecular mechanisms of working memory. Behav Brain Res. 2011;219(2):329–341. doi: 10.1016/j.bbr.2010.12.039. [DOI] [PubMed] [Google Scholar]
- 3.Euston DR, Gruber AJ, McNaughton BL. The role of medial prefrontal cortex in memory and decision making. Neuron. 2012;76(6):1057–1070. doi: 10.1016/j.neuron.2012.12.002. [DOI] [PMC free article] [PubMed] [Google Scholar]
- 4.Avale ME, et al. Prefrontal nicotinic receptors control novel social interaction between mice. FASEB J. 2011;25(7):2145–2155. doi: 10.1096/fj.10-178558. [DOI] [PubMed] [Google Scholar]
- 5.Miller EK. The prefrontal cortex and cognitive control. Nat Rev Neurosci. 2000;1(1):59–65. doi: 10.1038/35036228. [DOI] [PubMed] [Google Scholar]
- 6.Dehaene S, Changeux J-P. Experimental and theoretical approaches to conscious processing. Neuron. 2011;70(2):200–227. doi: 10.1016/j.neuron.2011.03.018. [DOI] [PubMed] [Google Scholar]
- 7.Koch C, Massimini M, Boly M, Tononi G. Neural correlates of consciousness: Progress and problems. Nat Rev Neurosci. 2016;17(5):307–321. doi: 10.1038/nrn.2016.22. [DOI] [PubMed] [Google Scholar]
- 8.Changeux J-PG. Conscious processing: Implications for general anesthesia. Curr Opin Anaesthesiol. 2012;25(4):397–404. doi: 10.1097/ACO.0b013e32835561de. [DOI] [PubMed] [Google Scholar]
- 9.Poorthuis RB, Mansvelder HD. Nicotinic acetylcholine receptors controlling attention: Behavior, circuits and sensitivity to disruption by nicotine. Biochem Pharmacol. 2013;86(8):1089–1098. doi: 10.1016/j.bcp.2013.07.003. [DOI] [PubMed] [Google Scholar]
- 10.Granon S, Changeux J-P. Deciding between conflicting motivations: what mice make of their prefrontal cortex. Behav Brain Res. 2012;229(2):419–426. doi: 10.1016/j.bbr.2011.11.011. [DOI] [PubMed] [Google Scholar]
- 11.Koukouli F, Maskos U. The multiple roles of the α7 nicotinic acetylcholine receptor in modulating glutamatergic systems in the normal and diseased nervous system. Biochem Pharmacol. 2015;97(4):378–387. doi: 10.1016/j.bcp.2015.07.018. [DOI] [PubMed] [Google Scholar]
- 12.Picciotto MR, et al. Abnormal avoidance learning in mice lacking functional high-affinity nicotine receptor in the brain. Nature. 1995;374(6517):65–67. doi: 10.1038/374065a0. [DOI] [PubMed] [Google Scholar]
- 13.Maskos U, et al. Nicotine reinforcement and cognition restored by targeted expression of nicotinic receptors. Nature. 2005;436(7047):103–107. doi: 10.1038/nature03694. [DOI] [PubMed] [Google Scholar]
- 14.Hoyle E, Genn RF, Fernandes C, Stolerman IP. Impaired performance of alpha7 nicotinic receptor knockout mice in the five-choice serial reaction time task. Psychopharmacology (Berl) 2006;189(2):211–223. doi: 10.1007/s00213-006-0549-2. [DOI] [PMC free article] [PubMed] [Google Scholar]
- 15.Naudé J, et al. Nicotinic receptors in the ventral tegmental area promote uncertainty-seeking. Nat Neurosci. 2016;19(3):471–478. doi: 10.1038/nn.4223. [DOI] [PubMed] [Google Scholar]
- 16.Guillem K, et al. Nicotinic acetylcholine receptor β2 subunits in the medial prefrontal cortex control attention. Science. 2011;333(6044):888–891. doi: 10.1126/science.1207079. [DOI] [PubMed] [Google Scholar]
- 17.Fox MD, Raichle ME. Spontaneous fluctuations in brain activity observed with functional magnetic resonance imaging. Nat Rev Neurosci. 2007;8(9):700–711. doi: 10.1038/nrn2201. [DOI] [PubMed] [Google Scholar]
- 18.Moutard C, Dehaene S, Malach R. Spontaneous fluctuations and non-linear ignitions: Two dynamic faces of cortical recurrent loops. Neuron. 2015;88(1):194–206. doi: 10.1016/j.neuron.2015.09.018. [DOI] [PubMed] [Google Scholar]
- 19.Dehaene S, Changeux J-P. Ongoing spontaneous activity controls access to consciousness: A neuronal model for inattentional blindness. PLoS Biol. 2005;3(5):e141. doi: 10.1371/journal.pbio.0030141. [DOI] [PMC free article] [PubMed] [Google Scholar]
- 20.Cossart R, Aronov D, Yuste R. Attractor dynamics of network UP states in the neocortex. Nature. 2003;423(6937):283–288. doi: 10.1038/nature01614. [DOI] [PubMed] [Google Scholar]
- 21.Arieli A, Sterkin A, Grinvald A, Aertsen A. Dynamics of ongoing activity: Explanation of the large variability in evoked cortical responses. Science. 1996;273(5283):1868–1871. doi: 10.1126/science.273.5283.1868. [DOI] [PubMed] [Google Scholar]
- 22.Schurger A, Sarigiannidis I, Naccache L, Sitt JD, Dehaene S. Cortical activity is more stable when sensory stimuli are consciously perceived. Proc Natl Acad Sci USA. 2015;112(16):E2083–E2092. doi: 10.1073/pnas.1418730112. [DOI] [PMC free article] [PubMed] [Google Scholar]
- 23.Nir Y, et al. Interhemispheric correlations of slow spontaneous neuronal fluctuations revealed in human sensory cortex. Nat Neurosci. 2008;11(9):1100–1108. doi: 10.1038/nn.2177. [DOI] [PMC free article] [PubMed] [Google Scholar]
- 24.Barttfeld P, et al. Signature of consciousness in the dynamics of resting-state brain activity. Proc Natl Acad Sci USA. 2015;112(3):887–892. doi: 10.1073/pnas.1418031112. [DOI] [PMC free article] [PubMed] [Google Scholar]
- 25.Deco G, Hagmann P, Hudetz AG, Tononi G. Modeling resting-state functional networks when the cortex falls asleep: Local and global changes. Cereb Cortex. 2014;24(12):3180–3194. doi: 10.1093/cercor/bht176. [DOI] [PMC free article] [PubMed] [Google Scholar]
- 26.Raichle ME, et al. A default mode of brain function. Proc Natl Acad Sci USA. 2001;98(2):676–682. doi: 10.1073/pnas.98.2.676. [DOI] [PMC free article] [PubMed] [Google Scholar]
- 27.Biswal B, Yetkin FZ, Haughton VM, Hyde JS. Functional connectivity in the motor cortex of resting human brain using echo-planar MRI. Magn Reson Med. 1995;34(4):537–541. doi: 10.1002/mrm.1910340409. [DOI] [PubMed] [Google Scholar]
- 28.Vincent JL, et al. Intrinsic functional architecture in the anaesthetized monkey brain. Nature. 2007;447(7140):83–86. doi: 10.1038/nature05758. [DOI] [PubMed] [Google Scholar]
- 29.Nir Y, Hasson U, Levy I, Yeshurun Y, Malach R. Widespread functional connectivity and fMRI fluctuations in human visual cortex in the absence of visual stimulation. Neuroimage. 2006;30(4):1313–1324. doi: 10.1016/j.neuroimage.2005.11.018. [DOI] [PubMed] [Google Scholar]
- 30.Nir Y, et al. Regional slow waves and spindles in human sleep. Neuron. 2011;70(1):153–169. doi: 10.1016/j.neuron.2011.02.043. [DOI] [PMC free article] [PubMed] [Google Scholar]
- 31.Cordes D, et al. Frequencies contributing to functional connectivity in the cerebral cortex in “resting-state” data. AJNR Am J Neuroradiol. 2001;22(7):1326–1333. [PMC free article] [PubMed] [Google Scholar]
- 32.Alkire MT, Hudetz AG, Tononi G. Consciousness and anesthesia. Science. 2008;322(5903):876–880. doi: 10.1126/science.1149213. [DOI] [PMC free article] [PubMed] [Google Scholar]
- 33.Goltstein PM, Montijn JS, Pennartz CMA. Effects of isoflurane anesthesia on ensemble patterns of Ca2+ activity in mouse v1: Reduced direction selectivity independent of increased correlations in cellular activity. PLoS One. 2015;10(2):e0118277. doi: 10.1371/journal.pone.0118277. [DOI] [PMC free article] [PubMed] [Google Scholar]
- 34.Flood P, Role LW. Neuronal nicotinic acetylcholine receptor modulation by general anesthetics. Toxicol Lett. 1998;100-101:149–153. doi: 10.1016/s0378-4274(98)00179-9. [DOI] [PubMed] [Google Scholar]
- 35.Tassonyi E, Charpantier E, Muller D, Dumont L, Bertrand D. The role of nicotinic acetylcholine receptors in the mechanisms of anesthesia. Brain Res Bull. 2002;57(2):133–150. doi: 10.1016/s0361-9230(01)00740-7. [DOI] [PubMed] [Google Scholar]
- 36.He BJ, Snyder AZ, Zempel JM, Smyth MD, Raichle ME. Electrophysiological correlates of the brain’s intrinsic large-scale functional architecture. Proc Natl Acad Sci USA. 2008;105(41):16039–16044. doi: 10.1073/pnas.0807010105. [DOI] [PMC free article] [PubMed] [Google Scholar]
- 37.Poorthuis RB, et al. Layer-specific modulation of the prefrontal cortex by nicotinic acetylcholine receptors. Cereb Cortex. 2013;23(1):148–161. doi: 10.1093/cercor/bhr390. [DOI] [PMC free article] [PubMed] [Google Scholar]
- 38.Dehaene S, Kerszberg M, Changeux JP. A neuronal model of a global workspace in effortful cognitive tasks. Proc Natl Acad Sci USA. 1998;95(24):14529–14534. doi: 10.1073/pnas.95.24.14529. [DOI] [PMC free article] [PubMed] [Google Scholar]
- 39.Von Economo C. 1929. The cytoarchitectonics of the human cerebral cortex (Oxford Univ Press, Oxford)
- 40.Ballesteros-Yáñez I, Benavides-Piccione R, Bourgeois J-P, Changeux J-P, DeFelipe J. Alterations of cortical pyramidal neurons in mice lacking high-affinity nicotinic receptors. Proc Natl Acad Sci USA. 2010;107(25):11567–11572. doi: 10.1073/pnas.1006269107. [DOI] [PMC free article] [PubMed] [Google Scholar]
- 41.Parikh V, Sarter M. Cholinergic mediation of attention: Contributions of phasic and tonic increases in prefrontal cholinergic activity. Ann N Y Acad Sci. 2008;1129:225–235. doi: 10.1196/annals.1417.021. [DOI] [PubMed] [Google Scholar]
- 42.Sarter M, Parikh V, Howe WM. Phasic acetylcholine release and the volume transmission hypothesis: Time to move on. Nat Rev Neurosci. 2009;10(5):383–390. doi: 10.1038/nm2635. [DOI] [PMC free article] [PubMed] [Google Scholar]
- 43.Parikh V, Kozak R, Martinez V, Sarter M. Prefrontal acetylcholine release controls cue detection on multiple timescales. Neuron. 2007;56(1):141–154. doi: 10.1016/j.neuron.2007.08.025. [DOI] [PMC free article] [PubMed] [Google Scholar]
- 44.Howe WM, et al. Prefrontal cholinergic mechanisms instigating shifts from monitoring for cues to cue-guided performance: Converging electrochemical and fMRI evidence from rats and humans. J Neurosci. 2013;33(20):8742–8752. doi: 10.1523/JNEUROSCI.5809-12.2013. [DOI] [PMC free article] [PubMed] [Google Scholar]
- 45.Gulledge AT, Bucci DJ, Zhang SS, Matsui M, Yeh HH. M1 receptors mediate cholinergic modulation of excitability in neocortical pyramidal neurons. J Neurosci. 2009;29(31):9888–9902. doi: 10.1523/JNEUROSCI.1366-09.2009. [DOI] [PMC free article] [PubMed] [Google Scholar]
- 46.Sigalas C, Rigas P, Tsakanikas P, Skaliora I. High-affinity nicotinic receptors modulate spontaneous cortical up states in vitro. J Neurosci. 2015;35(32):11196–11208. doi: 10.1523/JNEUROSCI.5222-14.2015. [DOI] [PMC free article] [PubMed] [Google Scholar]
- 47.Sellers KK, Bennett DV, Hutt A, Fröhlich F. Anesthesia differentially modulates spontaneous network dynamics by cortical area and layer. J Neurophysiol. 2013;110(12):2739–2751. doi: 10.1152/jn.00404.2013. [DOI] [PubMed] [Google Scholar]
- 48.Holtmaat A, et al. Long-term, high-resolution imaging in the mouse neocortex through a chronic cranial window. Nat Protoc. 2009;4(8):1128–1144. doi: 10.1038/nprot.2009.89. [DOI] [PMC free article] [PubMed] [Google Scholar]
- 49.Lepousez G, Lledo P-M. Odor discrimination requires proper olfactory fast oscillations in awake mice. Neuron. 2013;80(4):1010–1024. doi: 10.1016/j.neuron.2013.07.025. [DOI] [PubMed] [Google Scholar]
- 50.Dombeck D, Tank D. Two-photon imaging of neural activity in awake mobile mice. Cold Spring Harb Protoc. 2014;2014(7):726–736. doi: 10.1101/pdb.top081810. [DOI] [PubMed] [Google Scholar]
- 51.Steriade M, McCormick DA, Sejnowski TJ. Thalamocortical oscillations in the sleeping and aroused brain. Science. 1993;262(5134):679–685. doi: 10.1126/science.8235588. [DOI] [PubMed] [Google Scholar]
- 52.Paxinos G, Franklin KBJ. The Mouse Brain in Stereotaxic Coordinates. Gulf Professional Publishing; New York: 2004. [Google Scholar]


