Significance
What makes the brain tick? A simple yet challenging question that has captivated our minds for centuries. This sentiment was fittingly reflected in the launch of The BRAIN Initiative 3 years ago, spurred by the rapid advancement of noninvasive brain imaging and neuronal mapping technologies that have advanced our understanding of neural networks, which are central to brain functions and behavior. Here, we study the patterns of large-scale brain-wide interactions mediated by thalamo-cortical networks through optogenetics and functional MRI. We found that the thalamus can recruit long-range cortical and subcortical networks and initiate their interactions in a spatiotemporally specific manner. This finding provides a fresh impetus to study the mysteries of the brain.
Keywords: fMRI, optogenetic, brain connectivity, low frequency, thalamus
Abstract
One challenge in contemporary neuroscience is to achieve an integrated understanding of the large-scale brain-wide interactions, particularly the spatiotemporal patterns of neural activity that give rise to functions and behavior. At present, little is known about the spatiotemporal properties of long-range neuronal networks. We examined brain-wide neural activity patterns elicited by stimulating ventral posteromedial (VPM) thalamo-cortical excitatory neurons through combined optogenetic stimulation and functional MRI (fMRI). We detected robust optogenetically evoked fMRI activation bilaterally in primary visual, somatosensory, and auditory cortices at low (1 Hz) but not high frequencies (5–40 Hz). Subsequent electrophysiological recordings indicated interactions over long temporal windows across thalamo-cortical, cortico-cortical, and interhemispheric callosal projections at low frequencies. We further observed enhanced visually evoked fMRI activation during and after VPM stimulation in the superior colliculus, indicating that visual processing was subcortically modulated by low-frequency activity originating from VPM. Stimulating posteromedial complex thalamo-cortical excitatory neurons also evoked brain-wide blood-oxygenation-level–dependent activation, although with a distinct spatiotemporal profile. Our results directly demonstrate that low-frequency activity governs large-scale, brain-wide connectivity and interactions through long-range excitatory projections to coordinate the functional integration of remote brain regions. This low-frequency phenomenon contributes to the neural basis of long-range functional connectivity as measured by resting-state fMRI.
The brain is a highly complex, interconnected structure with parallel and hierarchical networks distributed within and between neural systems (1, 2). This integrative architecture dictates the underlying principles of how brain-wide neural connectivity supports and organizes sensory, behavioral, and cognitive processes (3). Recent advances in structural (2, 4) and functional connectivity (5–12) mapping, as well as neural circuit modulatory tools, such as optogenetics (13, 14), permit detailed, high-resolution neural examinations at unprecedented scales. In particular, functional connectivity mapping using resting-state functional MRI (rsfMRI) produces noninvasive visualization of slow and spontaneous hemodynamic fluctuations in humans (5–9) and animals (10–12). Coherent low-frequency (<1 Hz) fluctuations across functionally coupled, large-scale networks is an intriguing property, although the exact underlying neural bases and functional significance remain unclear. Previous studies integrating large-scale electrical recordings, voltage-sensitive dye (VSD), and Ca2+-imaging techniques (15–18) support the hypothesis that slow, oscillating neural activity constrains and elicits these hemodynamic fluctuations. Furthermore, low-frequency activity can temporally synchronize remote brain regions for extended periods to enable information processing (19–21). Although studies demonstrated that rsfMRI connectivity is constrained by well-defined structural networks (3, 17), connectivity itself can reorganize during learning-related tasks (22). Given these multifaceted findings, it is now imperative to directly investigate the spatiotemporal properties of large-scale neural interactions. Specifically, how do long-range projection networks facilitate and govern large-scale neural activity?
The cerebral cortex contains long-range axonal projections of pyramidal neurons reciprocally connected to the thalamus by cortico-thalamic and thalamo-cortical projections and within the cortex via cortico-cortical and interhemispheric projections (23). These long-range projections are predominantly glutamatergic and generate most excitatory inputs to their target regions (24). Thalamo-cortical circuits, particularly the somatosensory thalamo-cortical circuits in rodents, are excellent models of long-range projections often studied for their straightforward circuit architecture with monosynaptic excitatory cortical input (25, 26). In addition, the thalamus can control cortical states (27–29) and modulate spontaneous cortical activity based on different cortical states (30, 31). These studies suggest that the thalamo-cortico-thalamic networks are integral to facilitating diverse functional neural integration across the entire brain.
The neuronal architecture within the brain is an intricate web of interconnected excitatory neurons and inhibitory interneurons, which creates highly dynamic yet stable excitation–inhibition networks. Normal operation of this architecture or brain-wide networks requires precise and spatiotemporally structured activity propagation and interaction patterns that support the functional properties of these networks, including downstream activity propagation characteristics within long-range projections. Intuitively, simple perturbations using local electrical microstimulation will not likely permit a reliable probe of the spatiotemporal activity propagation dynamics and their functional output. Previous studies examining the spatiotemporal response properties within thalamo-cortical circuits were limited by nonspecific electrical stimulation. Electrical stimulation cannot target cell-type–specific neurons, and it excites circuit components in the stimulation region that may not be involved in the particular behavior under physiological conditions. Indeed, electrical stimulation can disrupt both cortico-cortical and cortico-thalamic signal propagation (32) and result in enlarged regions of spatial activation in somatosensory cortex (33). These studies indicate the inadequacy of local electrical stimulation to evoke and characterize downstream activity propagation and interaction within long-range and polysynaptic projection networks. Furthermore, current electrode recording technology limits both the recording site density and spatial coverage. Therefore, thalamo-cortical circuits have been characterized only between thalamic nuclei and directly innervated cortical regions (34, 35). This characterization yields a limited understanding into widespread neural interactions beyond thalamo-cortico-thalamic networks. Hence, a disconnection exists at the systems level describing how thalamo-cortical circuits mediate large-scale brain-wide neural activity.
In this study, we sought to characterize large-scale brain-wide neural activity propagation and interaction dynamics and examine their functional roles. We determined the spatiotemporal response properties of long-range excitatory thalamic projections to cortical and subcortical regions. We overcame the limitations of electrical stimulation nonspecificity (34, 35) and electrode recording spatial coverage by using a multimodal approach. We used optogenetic functional MRI (fMRI) in combination with electrophysiological recordings to interrogate the vibrissae (whisker) somatosensory thalamo-cortical system. Integration of fMRI and optogenetics permits large-scale view and detection of brain-wide neural activity and enables reversible, millisecond precision and cell-type–specific modulation of thalamo-cortical neurons. We selectively targeted thalamo-cortical excitatory neurons in ventral posteromedial thalamus (VPM), a primary lemniscal somatosensory pathway, and stimulated them at different frequencies (1–40 Hz). The posteromedial complex of the thalamus (POm), a nonlemniscal somatosensory pathway, was also examined. We investigated the spatiotemporal properties of downstream excitatory signal propagation beyond the defined thalamo-cortical circuit, identified the requisite long-range projections, and tested whether VPM stimulation modulates other sensory processing in remote brain regions.
Results
Brain-Wide fMRI Mapping of Downstream Signal Propagation from VPM.
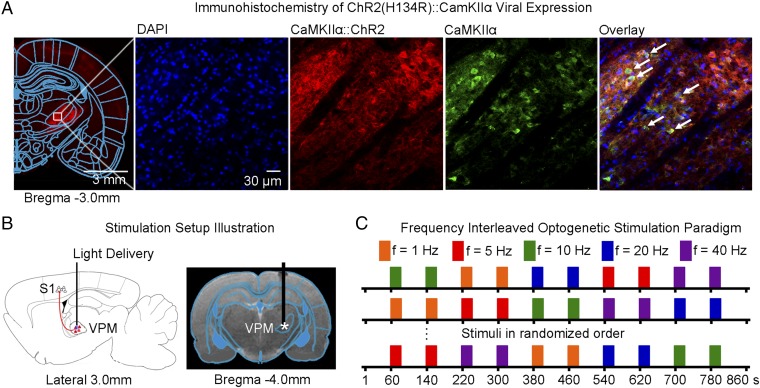
We expressed Ca2+/calmodulin-dependent protein kinase II alpha (CaMKIIα)-dependent ChR2(H134R) fused with mCherry in VPM thalamo-cortical excitatory neurons in normal adult Sprague-Dawley rats, as the majority of thalamic nuclei, except for the reticular nucleus, are predominantly populated by CaMKIIα-expressing excitatory neurons (36) (Fig. 1A and Fig. S1A). We confirmed specific expression in VPM excitatory neurons through colocalization of mCherry with CaMKIIα staining. We performed optogenetic stimulation in lightly anesthetized rats (1% isoflurane). Blue light pulses at five frequencies (1 Hz: 10% pulse width duty cycle; 5, 10, 20, and 40 Hz: 30% duty cycle; light intensity: 40 mW/mm2) were delivered to VPM neurons in an interleaving block paradigm (Fig. 1 B and C). These frequencies cover natural whisking frequencies (5 Hz and 10 Hz), below (1 Hz) and above (40 Hz). We chose a reduced duty cycle of 10% for l Hz of stimulation to avoid excessively long stimulation pulse widths that may not be physiological. We made the exposed optical fiber cannula (used to deliver blue light pulses) opaque using heat-shrinkable sleeves to prevent light leakage that may cause undesired visual stimulation to animals.
Fig. 1.
Histological characterization of ChR2::CaMKIIα viral expression in VPM thalamo-cortical excitatory neurons and optogenetic fMRI stimulation setup. (A) Confocal images of ChR2-mCherry expression in VPM; Lower magnification (Left) and higher magnification (Right). Overlay of images costained for the nuclear marker DAPI, excitatory marker CaMKIIα, and mCherry revealed colocalization of mCherry and CaMKIIα in the cell body of thalamo-cortical neurons (indicated by white arrows). (B) Illustration of stimulation site in ChR2 VPM thalamo-cortical neurons during optogenetic fMRI experiments (Left). T2-weighted anatomical MRI image showing the location of the implanted optical fiber (asterisk: stimulation site) (Right). (C) Optogenetic fMRI stimulation paradigm. Five different frequencies (1, 5, 10, 20, and 40 Hz) were presented in a pseudorandomized order. All frequencies were presented at 30% duty cycle except for 1 Hz that was presented at 10% duty cycle.
Fig. S1.
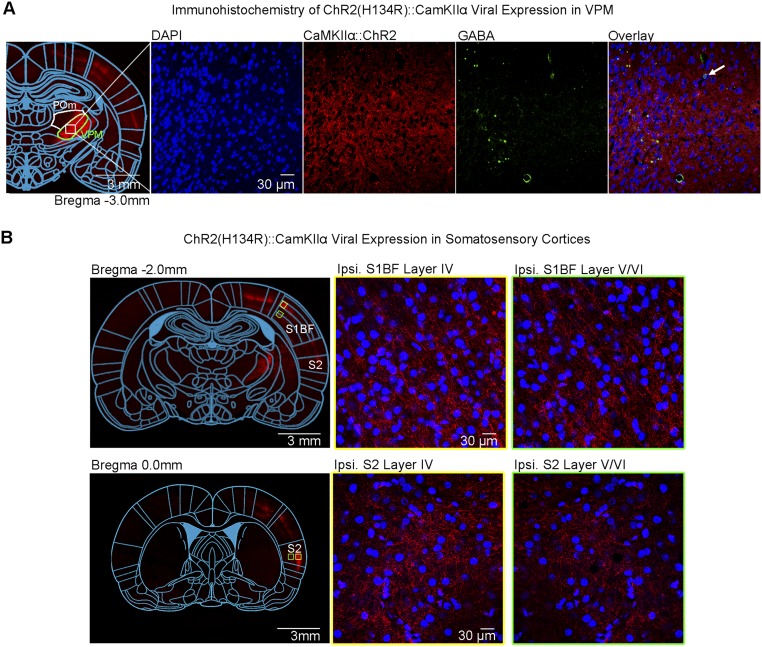
Histological characterization of ChR2::CaMKIIα viral expression in VPM thalamo-cortical excitatory neurons demonstrates no colocalization with VPM GABAergic neurons and their projection targets to S1BF and S2. (A) Confocal images of ChR2-mCherry expression in VPM; Lower magnification (Left) and higher magnification (Right). Overlay of images costained for the nuclear marker DAPI, mCherry, and inhibitory marker GABA revealed no colocalization between mCherry and VPM GABAergic neurons (indicated by white arrow). (B) Confocal images of ChR2-mCherry expression in S1BF (Top). Lower magnification (Left) and higher magnification (Right). VPM thalamo-cortical projections synapse in layer IV and V/VI of S1BF, indicated by no colocalization between mCherry and DAPI. Confocal images of ChR2-mCherry expression in S2 (Bottom) Lower magnification (Left) and higher magnification (Right). VPM thalamo-cortical projections synapse in layer IV and V/VI of S2, indicated by no colocalization between mCherry and DAPI.
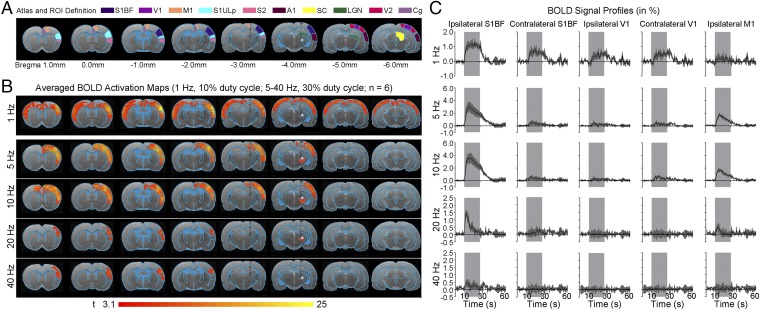
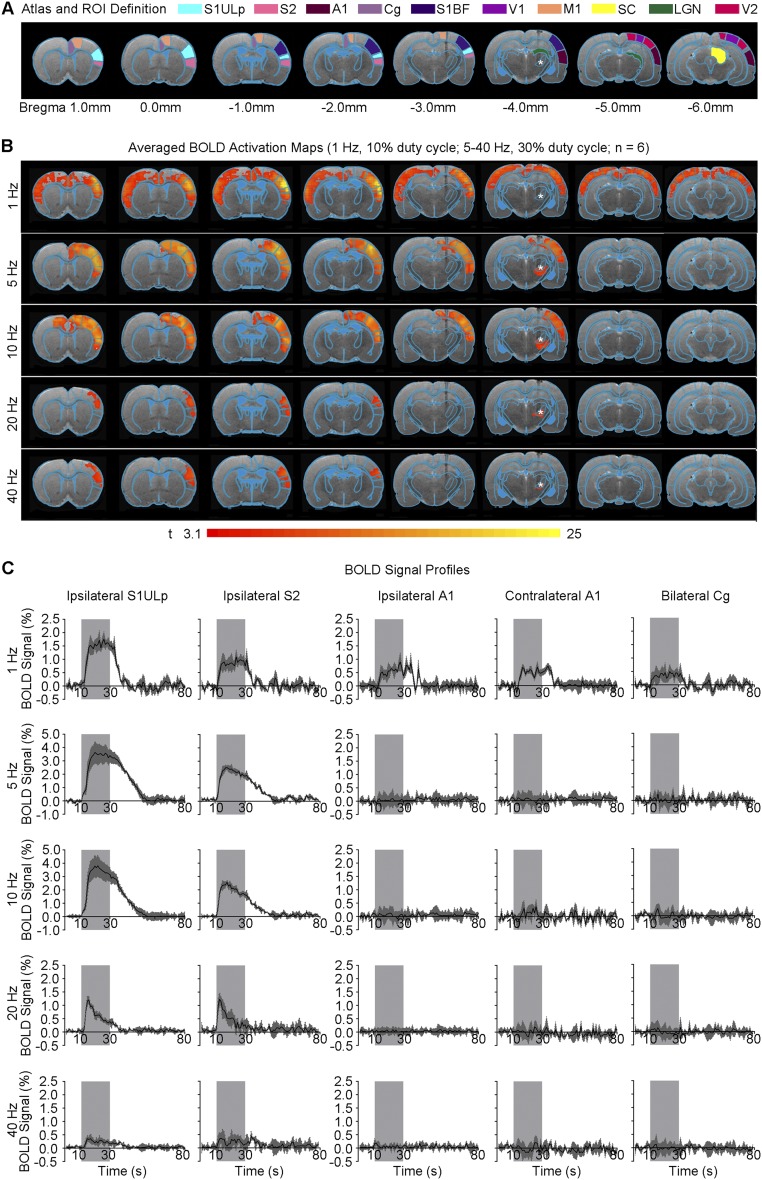
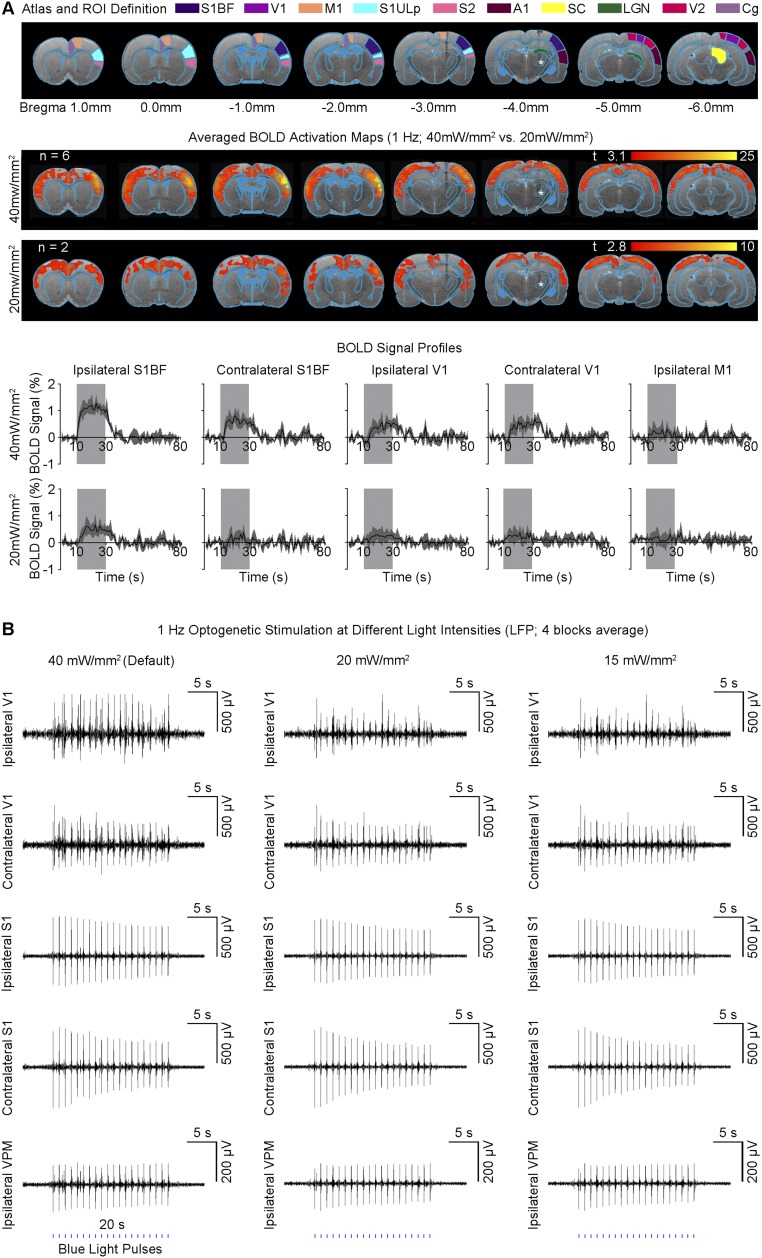
We detected robust large-scale blood-oxygenation-level–dependent (BOLD) fMRI activation within and beyond the somatosensory thalamo-cortical circuit at 1 Hz of ipsilateral VPM stimulation (Fig. 2 and Fig. S2). We identified robust and diffuse BOLD responses in a contralateral primary somatosensory barrel field (S1BF) and upper lip area (S1ULp), secondary somatosensory cortex (S2), bilateral primary visual (V1) and auditory (A1) cortices, and cingulate cortex (Cg), in addition to ipsilateral SIBF, S1ULp, and S2 (see Fig. 2C and Fig. S2C for the BOLD signal profiles). Despite the long interstimulus duration and low duty cycle, we reliably detected BOLD activation beyond thalamo-cortical networks, which revealed recruitment of brain-wide and population-wide neural activity by low-frequency stimulation. We also performed 1 Hz of stimulation at a lower light intensity (20 mW/mm2; Fig. S3A) and observed no apparent change in the overall spatial extent of broad cortical BOLD responses although BOLD signal amplitudes decreased as expected. At 5 and 10 Hz, BOLD activation was no longer present in contralateral somatosensory cortices and bilateral V1 and A1 (Fig. 2 and Fig. S2). Instead, robust and diffuse BOLD activation was detected in ipsilateral primary motor cortex (M1), in addition to ipsilateral S1BF, S2, and S1ULp. At 20 Hz and 40 Hz, we detected only BOLD activation in ipsilateral S1BF, S2, and S1ULp. We observed no BOLD activation in naive animals under the same light stimulation paradigm. The absolute BOLD signal amplitude within the ipsilateral S1BF at 1 Hz was generally lower than signal amplitudes at 5 Hz and 10 Hz mainly due to the reduced-pulse-width duty cycle of 10% used at 1 Hz. VPM BOLD activation was not apparent at 1 Hz because the lower duty cycle elicited a weaker BOLD signal in VPM.
Fig. 2.
Low-frequency (1 Hz), not high-frequency (5–40 Hz), optogenetic excitation of VPM thalamo-cortical excitatory neurons evokes brain-wide positive BOLD activations in remote and bilateral sensory cortices. (A) Illustration of Paxinos atlas-based ROI definitions. S1BF: primary somatosensory barrel field; V1: primary visual cortex; M1: motor cortex; S1ULp: primary somatosensory upper lip area; S2: secondary somatosensory cortex; A1: primary auditory cortex; SC: superior colliculus; LGN: lateral geniculate nucleus; V2: secondary visual cortex; Cg: cingulate cortex. (B) Averaged BOLD activation maps at 1, 5, 10, 20, and 40 Hz of optogenetic stimulation (n = 6; P < 0.001; asterisk: stimulation site). Robust and diffuse positive BOLD activations were observed in bilateral S1BF, V1/V2, A1, S2, and Cg cortices upon 1 Hz of stimulation. When stimulation frequency was increased to 5 and 10 Hz, robust and diffuse positive BOLD activations were observed in ipsilateral S1BF, M1, S1ULp, and S2. Further increase in stimulation frequency to 20 and 40 Hz activated only the ipsilateral S1BF, S1ULp, and S2. (C) BOLD signal profiles extracted from ROIs defined in A (error bar indicates ± SEM).
Fig. S2.
Optogenetic excitation of VPM thalamo-cortical neurons additionally evokes positive BOLD activations in bilateral auditory cortices (1 Hz) and other somatosensory cortices (1–40 Hz). (A) Illustration of Paxinos atlas-based ROI definitions. S1ULp: primary somatosensory upper lip area; S2: secondary somatosensory cortex; A1: primary auditory cortex; Cg: cingulate cortex; S1BF: primary somatosensory barrel field; V1: primary visual cortex; M1: motor cortex; SC: superior colliculus; LGN: lateral geniculate nucleus; V2: secondary visual cortex. (B) Averaged BOLD activation maps at 1, 5, 10, 20, and 40 Hz of optogenetic stimulation, respectively (n = 6; P < 0.001; asterisk: optical stimulation). (C) BOLD signal profiles extracted from ROIs defined in A (error bar indicates ± SEM). Note that Cg is a high-order cognitive structure; its activation during low-frequency VPM stimulation here suggests that sensory inputs may modulate cognitive processing functions.
Fig. S3.
Low light intensity during 1 Hz of optogenetic VPM stimulation does not change the overall BOLD brain-wide activation and LFP response characteristics. (A, Top) Illustration of Paxinos atlas-based ROI definitions. S1BF: primary somatosensory barrel field; V1: primary visual cortex; M1: motor cortex; S1ULp: primary somatosensory upper lip area; S2: secondary somatosensory cortex; A1: primary auditory cortex; SC: superior colliculus; LGN: lateral geniculate nucleus; V2: secondary visual cortex; Cg: cingulate cortex. (Middle) Averaged BOLD activation maps during 1 Hz of optogenetic stimulation at 40 mW/mm2 (n = 6) and 20 mW/mm2 (n = 2). Lower threshold of P < 0.01 with t = 2.8 was used to display the relatively weak BOLD activations at 20 mW/mm2. (Bottom) BOLD signal profiles of bilateral S1BF, bilateral V1, and ipsilateral M1 extracted from ROIs defined in A (error bar indicates ± SEM). In general, the spatial extent of cortical BOLD activations was observed to remain largely similar when light intensity decreased. Furthermore, the absolute BOLD signal amplitudes in activated regions such as bilateral S1BF and V1 were shown to decrease with the reduced light intensity. (B) LFPs were recorded at three different light intensities (n = 1; Left) default: 40 mW/mm2. (Middle) 20 mW/mm2. (Right) 15 mW/mm2. Secondary peaks evoked in bilateral V1 were observed to increase with light intensity. However, the primary optogenetic response levels did not show apparent changes in characteristics.
The above fMRI visualization of large-scale thalamo-cortical downstream signal propagation demonstrates that evoked spatiotemporal dynamics are not restricted to monosynaptic thalamo-cortical projections from VPM to somatosensory cortices (Fig. 2 and Figs. S1B and S2). We found frequency-specific response properties that transition activation from somatosensory-visual and somatosensory-auditory regions at low frequency (1 Hz) to sensorimotor areas at whisking frequency (5 Hz and 10 Hz). Together, these fMRI results indicate that excitatory signals evoked by optogenetic stimulation of VPM propagate to remote cortical regions polysynaptically and robustly at low frequencies.
Extracellular Recordings Underlying Brain-Wide BOLD Activations.
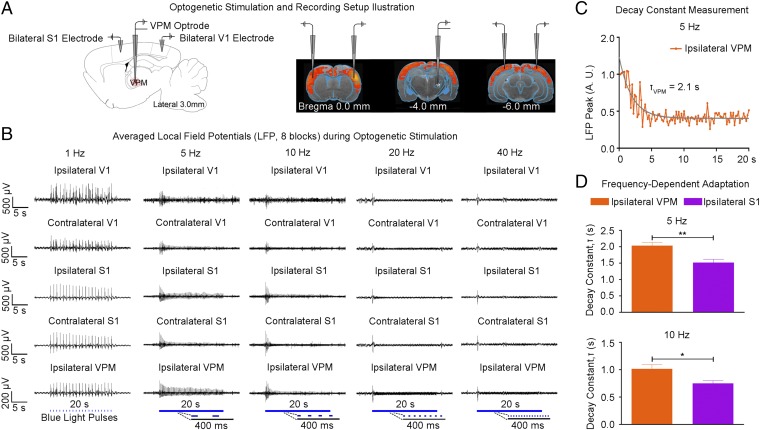
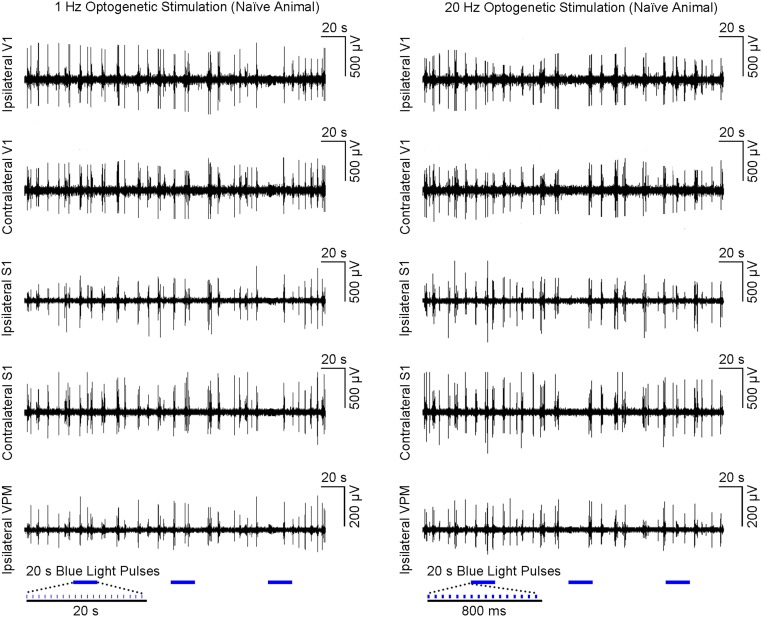
Guided by our fMRI results, we performed local field potential (LFP) recordings using the same stimulation paradigm as shown in Fig. 1C at five sites: ipsilateral VPM, bilateral S1, and bilateral V1 (Fig. 3A). Averaged 30-s traces of LFP recordings largely concurred with the magnitude and temporal profiles of BOLD activation at ipsilateral S1BF and bilateral V1 (Fig. 3B vs. Fig. 2C). The temporal evolution of BOLD signals was generally slower due to the inherent nature of the hemodynamic response to neural activity (37). Similar levels of LFP responses were elicited at all frequencies (1–40 Hz) for the first optogenetic pulse at each recording site. LFP response levels to optogenetic pulses were largely constant at 1 Hz. However, they decreased quickly during consecutive pulses at 5 Hz and 10 Hz and sharply decayed after the first pulse at 20 Hz and 40 Hz. LFP recordings performed in naive animals showed no evoked LFPs at these five sites upon simple VPM light stimulation (Fig. S4). In addition, laser light pulses can generate high photocurrents in neurons (38), which may produce unphysiological states. Therefore, we examined LFP recordings during 1 Hz of stimulation using different light intensities with the default 40 mW/mm2 vs. 20 mW/mm2 and 15 mW/mm2 (Fig. S3B). We observed no apparent changes in LFP characteristics.
Fig. 3.
LFP recordings in sensory cortices and VPM confirm neuronal activity underlying BOLD activation and indicate adaptation at the thalamic and cortical levels. (A) Illustration of the location of recording electrodes in bilateral S1BF, bilateral V1, and optrode in VPM. (B) Averaged LFP from a representative animal during VPM optogenetic stimulation (eight blocks; 1 Hz, 10% duty cycle; 5, 10, 20, and 40 Hz, 30% duty cycle). Response levels of evoked LFPs remained fairly constant at 1 Hz. However, evoked LFPs decreased quickly during the initial consecutive pulses at 5–40 Hz. These LFP recordings were consistent with the observed BOLD responses. (C) Adaptation characterization at ipsilateral VPM during 5 Hz of optogenetic stimulation. Adaptation was quantified by normalization of the amplitudes of positive peaks at each of the evoked potentials to the amplitude of the first positive peak, which was then fitted with a monoexponential decay curve to quantify its decay constant, τ. (D) There was additional adaptation in ipsilateral S1 at 5 Hz (τVPM = 2.10 ± 0.15 s vs. τS1 = 1.50 ± 0.17 s; error bar indicates SD; paired t test with post hoc Holm–Bonferroni correction; **P < 0.01) and 10 Hz (τVPM = 1.00 ± 0.13 s vs. τS1 = 0.73 ± 0.11 s; *P < 0.05). This finding indicates that the observed adaptation involved interactions within the thalamo-cortico-thalamic network and was not solely from sustained VPM membrane depolarization.
Fig. S4.
Optogenetic VPM stimulation in naive animal does not evoke LFP responses. Nonaveraged LFP from a representative animal during (Left) 1 Hz (n = 1; three blocks; 10% duty cycle and (Right) 20 Hz (three blocks; 30% duty cycle) VPM optogenetic stimulation. These findings prove that our characterized brain-wide phenomenon can be elicited only in VPM optogenetically treated animals.
These LFP recordings showed that this frequency-dependent adaptation occurs first in VPM. We measured the LFP peak amplitude decay constant, τ, for 5 and 10 Hz stimulation (Fig. 3 C and D). The measurements indicated further adaptation in ipsilateral S1, as τS1 was larger than τVPM (2.10 ± 0.15 s vs. 1.50 ± 0.17 s, P < 0.01 for 5 Hz; 1.05 ± 0.13 s vs. 0.73 ± 0.11 s, P < 0.05 for 10 Hz). Hence, simple failure of VPM excitatory neurons due to sustained membrane depolarization at high stimulation frequencies does not underlie this adaptation phenomenon. Both cortico-thalamic and intracortical interactions can contribute to these dynamic properties.
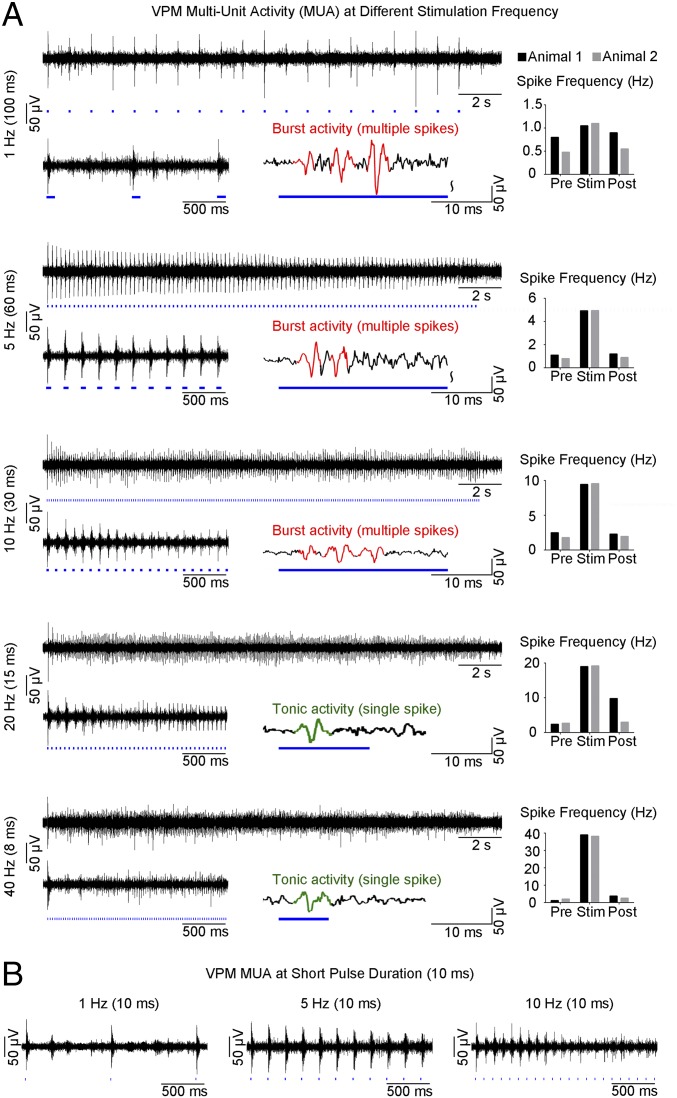
Multiunit activity (MUA) recordings in VPM using an optrode showed that spikes were optogenetically evoked in thalamo-cortical neurons at all stimulation frequencies (Fig. 4A). Spike frequency analysis demonstrated that optogenetic pulses successfully evoked action potentials in a stimulus-locked manner, even at high frequencies including 20 Hz and 40 Hz, the range at which non-cell-type–specific electrical stimulation fails (39). We observed an onset latency of 3.3 ± 1.4 ms, consistent with VPM thalamo-cortical neuron characteristics (40). Surprisingly, MUA recordings revealed different spiking patterns that transitioned from thalamic burst activity to tonic activity with increasing stimulation frequency. As long stimulation pulse durations can confound evoked thalamic burst activity, we repeated these recordings using a 10-ms stimulation pulse and observed similar spiking characteristics (Fig. 4B). These findings indicate that the occurrence of evoked burst activity in VPM is determined through interstimulus intervals, not stimulus duration.
Fig. 4.
MUA recordings of VPM thalamo-cortical excitatory neurons reveal sustained thalamic burst activity at low frequency (1 Hz) and a transition to tonic activity at high frequencies (20 Hz and 40 Hz). (A) MUA measured during optogenetic stimulation at five frequencies. Twenty-one-second trace of VPM MUA from a representative animal during VPM optogenetic stimulation (1 Hz, 10% duty cycle; 5, 10, 20, and 40 Hz, 30% duty cycle; Top Left to Bottom Left). Corresponding 2-s VPM MUA trace magnified at the beginning (Bottom Left) of stimulation and illustration of evoked thalamic burst (multiple spikes) and tonic activity (single spike) (Bottom Right) for each stimulation frequency, respectively. Similar levels of MUA responses were evoked at all frequencies by the first stimulation pulse. Analysis of optogenetically evoked spikes revealed an onset latency of 3.3 ± 1.4 ms (mean ± SD), consistent with VPM thalamo-cortical neuron characteristics. Burst activity was sustained at 1 Hz, decreased at 5 Hz and 10 Hz, and transitioned to tonic activity at 20 Hz and 40 Hz. VPM spiking summary for two animals (Top Right to Bottom Right). Spike-rate analysis showed that spikes can be successfully generated at high frequencies (20 Hz and 40 Hz). (B) MUA measured using short-pulse stimulation (10 ms). Corresponding 2-s VPM MUA trace magnified at the beginning of stimulation for 1 Hz (Left), 5 Hz (Middle), and 10 Hz (Right). These findings demonstrate that similar spiking characteristics and occurrence of evoked burst activity in VPM are determined by interstimulus intervals, not by stimulus duration.
Long-Range Excitatory Projections Support Signal Propagation at Low Frequencies and Interactions with Long Temporal Windows.
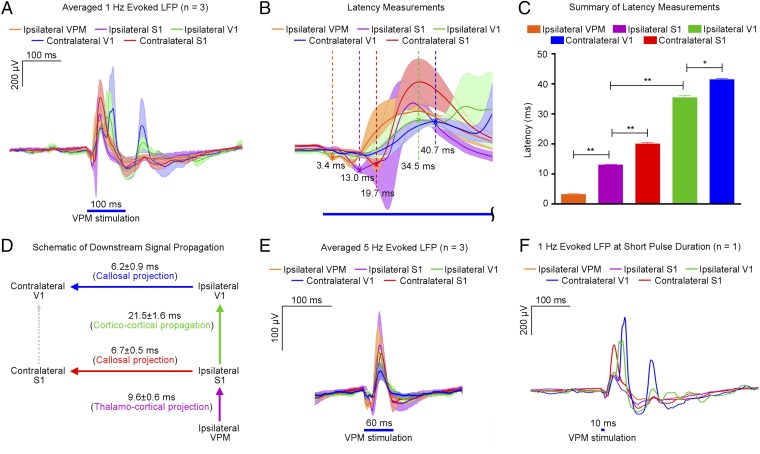
To identify downstream signal propagation pathways at 1 Hz, we analyzed the latency of evoked LFPs by using the first LFP peak location to represent the initial neuronal population activity (Fig. 5 A–C). Negative LFP peaks were observed first and used for ipsilateral VPM and ipsilateral and contralateral S1, whereas positive ones were observed for ipsilateral and contralateral V1. Analysis revealed a response latency of 3.4 ± 0.3 ms for VPM. As shown in Fig. 5D, a delay of 9.6 ± 0.6 ms occurred between VPM and ipsilateral S1, consistent with the reported 8.5-ms latency value for monosynaptic VPM to S1 projection (41). Signal then propagated from ipsilateral S1 to ipsilateral V1 through cortico-cortical circuit projections in 21.5 ± 1.6 ms, in line with the reported value of 25 ms (17), and to contralateral S1 through interhemispheric monosynaptic callosal projection in 6.7 ± 0.5 ms, consistent with the 6.0 ms estimated from reported axonal conduction velocity (42). Finally, the signal propagated in 6.2 ± 0.9 ms from ipsilateral V1 to contralateral V1 through interhemispheric callosal projection. However, we cannot preclude that propagation from contralateral S1 to contralateral V1 occurs through cortico-cortical circuit projections in 21.0 ± 1.8 ms because it closely matches the ipsilateral S1 to ipsilateral V1 delay. Taken together, these analyses indicate direct participation of long-range excitatory projections as demonstrated through their initial population activity propagation delays.
Fig. 5.
LFP recordings in sensory cortices and VPM reveal downstream signal propagation supported by low frequency (1 Hz) over long-range projections and their interactions with long temporal windows. (A) Averaged evoked LFPs during 1 Hz of VPM optogenetic stimulation (n = 3; 10% duty cycle; error bar indicates ± SD). (B) Summary of propagation delays from the onset of stimulation (magnified from A). Latency is measured as the time between the onset and the first evoked LFP peak location, indicated by a cross (x). (C) Summary of latency measured at the five different locations (n = 3; error bar indicates ± SD, one-way ANOVA with post hoc Bonferroni correction; **P < 0.01; *P < 0.05). (D) Schematic diagram of downstream signal propagation at 1 Hz. Optogenetic stimulation of VPM thalamo-cortical neurons elicited action potentials that excited ipsilateral S1 through thalamo-cortical projections. Subsequently, low-frequency activity propagated cortico-cortically from ipsilateral S1 to ipsilateral V1, and interhemispheric callosal projections between ipsilateral and contralateral S1 were recruited. Signal then was propagated from ipsilateral V1 to contralateral V1 via interhemispheric callosal projections. (E) Averaged evoked LFPs during 5 Hz of VPM optogenetic stimulation (n = 3; 30% duty cycle; error bar indicates ± SD). Comparision with 1 Hz reveals the absence of secondary peaks in ipsilateral and contralateral V1. This indicates that long-lasting and recurring interactions between and within cortico-cortical and thalamo-cortico-thalamic networks require long interstimulus durations. (F) Evoked potentials from a representative animal during 1 Hz of VPM optogenetic stimulation using a short stimulation pulse (1% duty cycle) shows no significant differences in overall latencies and LFP temporal characteristics.
As shown in Fig. 5A and in contrast to Fig. 5E, the averaged LFP evoked at 1 Hz typically persisted for 200–300 ms, which included strong secondary peaks long after the primary peaks, particularly in contralateral and ipsilateral V1 and contralateral S1. This finding indicates that a long interstimulus duration (>200 ms) is required to allow and enable recurrent, long-lasting interactions between and within long-range cortico-cortical and thalamo-cortico-thalamic networks. We also performed LFP recordings at 1 Hz using a shorter pulse duration (10 ms instead of 100 ms). We observed no significant changes in overall latencies and LFP temporal characteristics (Fig. 5F).
Visual Subcortical BOLD Activation Enhanced by Low-Frequency VPM Stimulation.
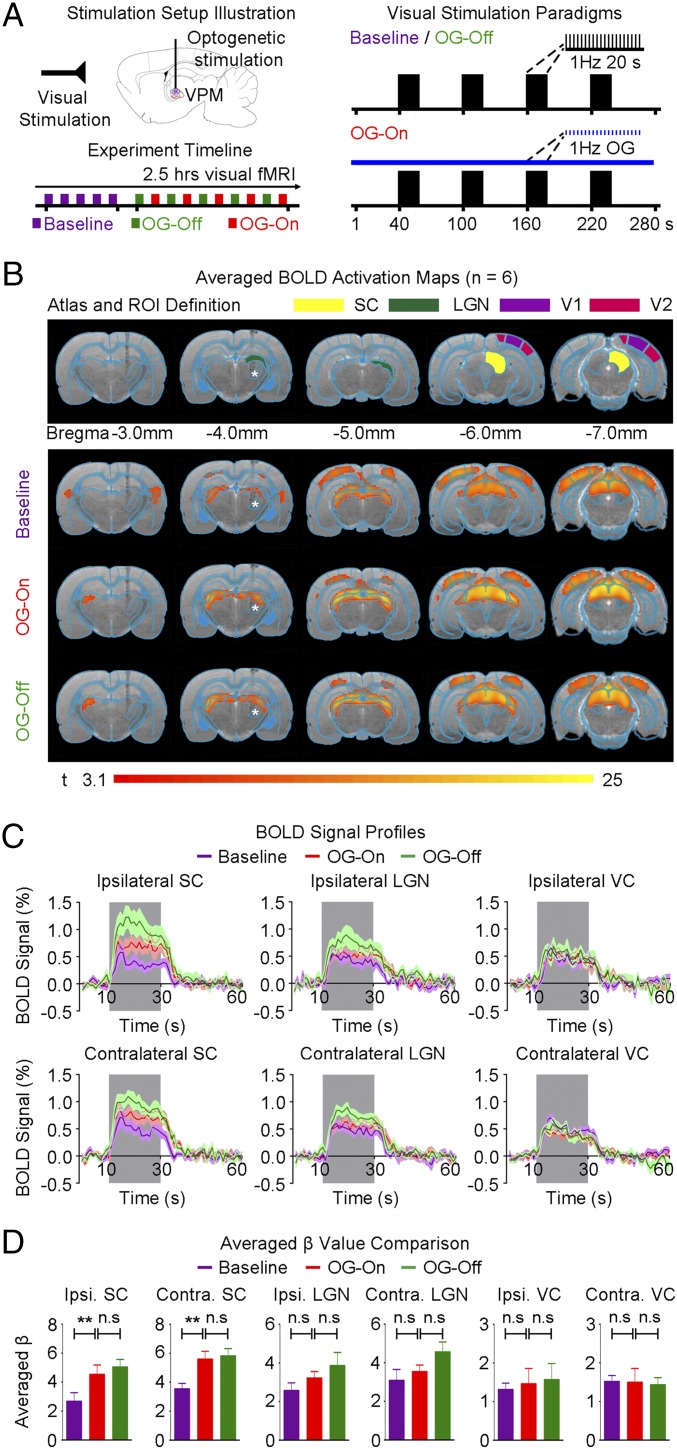
To test whether low-frequency activity over long-range projections influences cortical and subcortical processing of visual stimuli, we used a dual stimulation paradigm with a continuous 1-Hz VPM optogenetic stimulation and binocular visual stimulation (Fig. 6A). Visual stimulation was applied before (baseline), during (OG-On), and after (OG-Off) continuous VPM stimulation.
Fig. 6.
Low-frequency (1 Hz) optogenetic VPM stimulation enhances visually evoked subcortical SC BOLD activation. (A) Illustration of binocular visual and optogenetic fMRI stimulation setup (Top Left). Block design visual stimulation paradigm (20 s on 60 s off) presented before (baseline), during (OG-On), and after (OG-Off) continuous 1 Hz of optogenetic stimulation (Right). Typically, five baseline visual fMRI scans were acquired before five OG-On scans were interleaved with five OG-Off scans (Bottom Left). (B) Illustration of atlas-based ROI definitions (Top). SC: superior colliculus; LGN: lateral geniculate nucleus; V1/V2: primary/secondary visual cortex. Averaged BOLD activation maps before, during, and after 1 Hz of optogenetic stimulation (n = 6; P < 0.001; asterisk: stimulation site) (Bottom). (C) BOLD signal profiles extracted from ROIs defined in B (error bar indicates ± SEM). BOLD activations in ipsilateral and contralateral SC were enhanced during optogenetic stimulation, which remained elevated after cessation of optogenetic stimulation. These findings indicate that excitability in the visual pathway is modulated by low-frequency activity over long-range projections originating from VPM. (D) Averaged β-values extracted from ROIs defined in B (n = 6; error bar indicates ± SEM, one-way ANOVA with post hoc Bonferroni correction; **P < 0.01; n.s, not significant).
Baseline visual stimulation evoked positive BOLD activation along the visual pathway, including the lateral geniculate nucleus (LGN), superior colliculus (SC), and visual cortices (V1 and V2) (Fig. 6B). This finding was expected and consistent with the previous studies (43–45). In the presence of continuous optogenetic stimulation, visually evoked BOLD responses significantly increased in the SC (Fig. 6 C and D; ipsilateral SC, P < 0.01; contralateral SC, P < 0.01; one-way ANOVA). Moreover, visual-stimulation–evoked BOLD responses remained elevated in SC after optogenetic stimulation during the ∼2.5-h experimental window (Fig. 6 C and D). These findings indicate that excitability in the visual pathway is modulated by low-frequency activity over long-range projections originating from the primary somatosensory thalamic nucleus, VPM.
fMRI Mapping of Downstream Signal Propagation from POm.
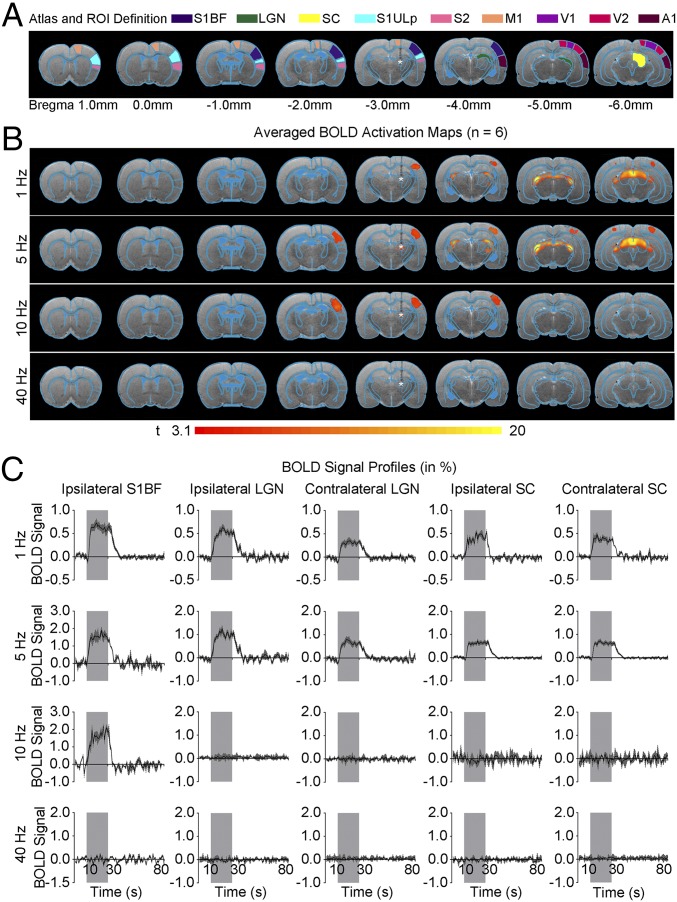
We also used optogenetic fMRI to examine brain-wide BOLD activity evoked by excitatory neuronal stimulation in the nonlemniscal somatosensory thalamus, POm (Fig. 7). We observed activation of thalamo-cortical and thalamo-tectal projections upon 1 Hz of stimulation, which evoked robust BOLD activation in ipsilateral S1BF, bilateral SC, and LGN. At 5 Hz, BOLD activation was detected in ipsilateral S1BF, bilateral V1, LGN, and SC. At 10 Hz, BOLD activation was observed only in ipsilateral S1BF (Fig. 7 B and C). Neither ipsilateral S1BF nor SC was activated at 40 Hz of stimulation. These findings again demonstrate the brain-wide and population-wide neural activity evoked by low-frequency stimulation of POm. Furthermore, these spatiotemporal response characteristics are distinct from those observed by VPM stimulation, highlighting the differential roles of VPM and POm in coordinating brain-wide neural activity. Histological examination of POm animals confirmed that local viral expression was restricted to the POm nucleus with no observable expression in VPM (Fig. S5).
Fig. 7.
Optogenetic stimulation of the posteromedial complex of the thalamus (POm), a nonlemniscal somatosensory pathway, reveals the distinct long-range downstream signal propagation characteristics. (A) Illustration of Paxinos atlas-based ROI definitions. S1BF: primary somatosensory barrel field; LGN: lateral geniculate nucleus; SC: superior colliculus; S1ULp: primary somatosensory upper lip area; S2: secondary somatosensory cortex; M1: motor cortex; V1: primary visual cortex, V2: secondary visual cortex; A1: primary auditory cortex. (B) Averaged BOLD activation maps at 1, 5, 10, and 40 Hz of optogenetic stimulation (n = 6; P < 0.001; asterisk: stimulation site). A 1-Hz stimulation showed positive BOLD activation at visual subcortical regions, LGN and SC. Robust positive BOLD activation was observed in ipsilateral S1BF during 5 Hz and 10 Hz of stimulation, which then expanded to visual subcortical activations at 5 Hz. Stimulation at 40 Hz did not show any significant BOLD activation. These findings indicate a specific spatiotemporal response profile different from that by VPM stimulation, highlighting the differential roles of POm and VPM in coordinating brain-wide neural activity. (C) BOLD signal profiles extracted from ROIs defined in A (error bar indicates ± SEM).
Fig. S5.
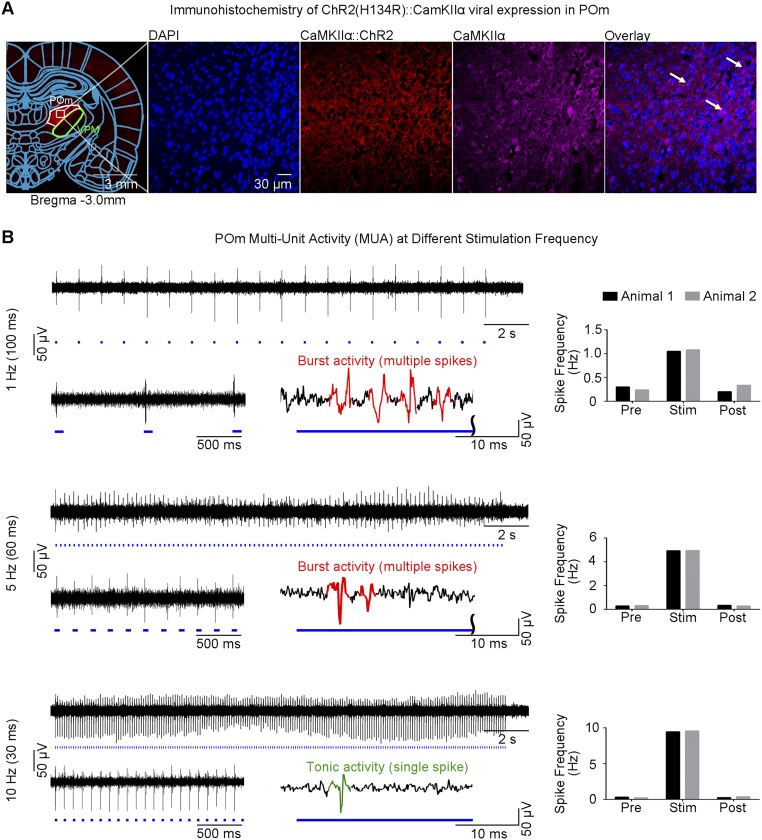
Histological characterization of ChR2::CaMKIIα viral expression in POm, and MUA recordings of POm thalamo-cortical excitatory neurons. (A) Confocal images of ChR2-mCherry expression in POm. Lower magnification (Left) and higher magnification (Right). Overlay of images costained for the nuclear marker DAPI, excitatory marker CaMKIIα, and mCherry revealed colocalization of mCherry and CaMKIIα in the cell body of POm thalamo-cortical neurons (indicated by white arrows). ChR2::CaMKIIα viral expression was shown to express only in POm without overlapping VPM. (B) MUA measured during POm optogenetic stimulation at three frequencies. Twenty-one-second trace of POm MUA from a representative animal during POm stimulation (1 Hz, 10% duty cycle; 5 Hz and 10 Hz, 30% duty cycle: Top Left to Bottom Left). Corresponding 2-s POm MUA trace magnified at the beginning of stimulation (Bottom Left) and illustration of optogenetically evoked thalamic burst (multiple spikes) or tonic activity (single spike; Bottom Right) for each stimulation frequency. Analysis of evoked spikes revealed an onset latency of 4.3 ± 2.3 ms (mean ± SD), consistent with POm thalamo-cortical neuron characteristics. Burst activity was elicited at 1 Hz and 5 Hz and transitioned to tonic activity at 10 Hz. Spike frequency measurements from two animals (Top Right to Bottom Right). They showed that spikes were successfully evoked by optogenetic pulses at all stimulation frequencies.
Discussion
Long-range projections are essential for neural communication between remote brain regions. The brain has an intrinsic capability to recruit various projections within interconnected networks to serve various functional demands without requiring individual long-range projections to perform a single function. Despite the wealth of positive evidence, it remains a challenge to establish how long-range projection recruitment and modulation occur across the broad range of neural targets. Furthermore, although long-range projections are prevalent in all mammalian brains, most studies focus on large-scale cortico-cortical interactions with minimal emphasis on modulation through subcortical interactions. Here, we examined both issues using optogenetics and fMRI to monitor brain-wide neural responses during thalamic stimulation. Our fMRI and subsequent extracellular recording results show that long-range cortico-cortical and interhemispheric callosal projections are recruited polysynaptically during low-frequency stimulation of VPM excitatory neurons. Similarly, POm stimulation leads to brain-wide neural activity but with a distinct spatiotemporal profile. Our results indicate that this low-frequency phenomenon likely is causally related to reciprocal interactions over thalamo-cortico-thalamic, cortico-cortical, and interhemispheric callosal projections to facilitate activity propagation with extended time windows. Furthermore, visual subcortical SC responses to visual stimulation are enhanced during and after sustained activation of long-range projections via VPM stimulation, which suggests that long-range projections and interactions shape multisensory integration processes in the brain. Together, these results indicate that low-frequency activity mediates brain-wide interactions through long-range excitatory projections. Such flexible characteristics of low-frequency, brain-wide neural activity can contribute to the neural basis of long-range functional organization and connectivity as measured by rsfMRI (5–12), extracellular recording (15, 16), VSD (17), and Ca2+ imaging (18).
Surprisingly, we demonstrated that low-frequency stimulation of excitatory neurons in VPM evokes BOLD responses in regions far beyond somatosensory cortices (Fig. 2). Reciprocal projections between the thalamus and recurrent cortical circuits distinguish the mammalian sensory cortex. The laminar and columnar architecture of the sensory cortex offers the most intuitive structural design with these specific functional characteristics. Sensory cortical pyramidal neurons receive thalamic input at specific cortical layers and distribute excitatory signals within and outside the cortex, whereas inhibitory interneurons are interspersed throughout cortical layers to provide the requisite excitation–inhibition balance. Despite exclusive stimulation of excitatory thalamo-cortical neurons in VPM, downstream signal propagation recruits both S1 excitatory pyramidal neurons and inhibitory interneurons at thalamo-cortical synapses (46). Most pyramidal neurons have axon collaterals that project back to and synapse in superficial layers, whereas others distribute excitation horizontally. These collaterals form a strong, recurrent excitatory network both within the local microcircuit and among long-range thalamo-cortico-thalamic and cortico-cortical networks (47). The strong input amplification elicited through this positive feedback loop is tightly regulated by various GABAergic interneurons (48) interposed within this pyramidal network to target different neuronal subdomains (23). In our study, evoked LFPs by 1 Hz of VPM stimulation persisted over long periods and exhibited multiple peaks in the ipsilateral VPM, bilateral S1, and V1 (Fig. 5 A and E). This observation suggests that feedforward and feedback mechanisms governing cortico-cortical and thalamo-cortico-thalamic networks play a causal role to modulate these LFP responses and directly contribute to robust brain-wide BOLD activations detected during 1 Hz of stimulation.
The question remains how and why cortical long-range projections are recruited. We found that low-frequency VPM stimulation elicited thalamic burst activity, whereas high-frequency stimulation elicited tonic activity (Fig. 4A). Thalamo-cortical excitatory neurons have intrinsic membrane potential properties that allow them to fire in two modes, namely burst and tonic/single spike (49), which require cortico-thalamic activity (50, 51). Thalamic burst activity, originally identified in the sleep/anesthetized state, is a proposed mechanism to decouple thalamo-cortical activity from the peripheral world (52). However, recent evidence suggests that thalamic bursting plays a fundamental role in sensory processing (53, 54). Studies of visual (55) and somatosensory (30, 53) pathways demonstrate the presence of thalamic bursting in awake and attentive states, implying that bursting activity modulates sensory perception. Intermittent activation of multiple long-range circuits to integrate major sensory cortices suggests that multisensory integration is essential to shape sensory perceptions that could not otherwise be achieved with only one sense (56, 57). This premise raises an intriguing proposition that excitatory long-range projections and their dynamic interactions are recruited during low-frequency thalamic stimulation through burst activity propagation from VPM to S1 and, possibly, to other sensory cortices. In this study, we observed that thalamic burst activity was successfully elicited during VPM stimulation and sustained only when the interstimulus interval was more than 200 ms (Fig. 4A), when brain-wide BOLD activation was observed. Such temporal characteristics indicate that the brain-wide integration of spiking information from multiple thalamic neurons simultaneously, possibly through bursting activity, requires extended time windows. These interactions presumably synchronize remote brain regions that require large conduction delays (19–21).
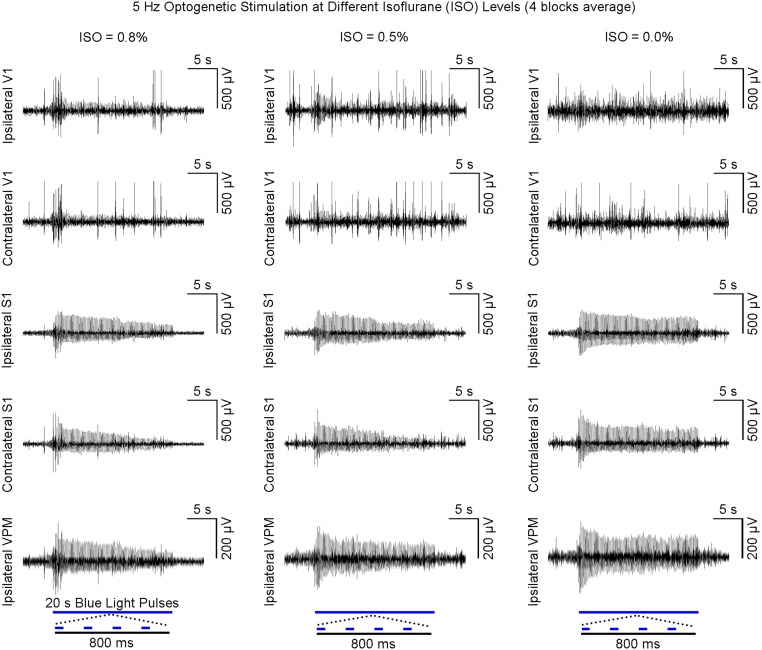
Synaptic depression by anesthesia at the stimulation site may diminish polysynaptic activity propagation at high frequencies (39). However, our LFP recordings after cessation of light anesthesia show that evoked V1 responses did not exhibit apparent changes, despite increases in fidelity of signal transmission from VPM to S1 (Fig. S6). A previous study in awake rats showed that desynchronized activity occurred during whisking, as indicated by decreased slow oscillations (∼1 Hz) in somatosensory cortex, and that these effects could be mimicked using high-frequency optogenetic stimulation of thalamo-cortical excitatory neurons (28). These findings support our contention that high-frequency thalamic stimulation may not activate long-range circuits beyond its projected area, even during the awake state, when high-frequency signals (>20 Hz) are transmitted reliably to the cortex. Therefore, the recruitment of long-range projections by low frequency is not an effect of anesthesia.
Fig. S6.
Cessation of isoflurane does not lead to increased LFP responses in bilateral V1 during high-frequency (5 Hz) VPM stimulation. LFPs at three isoflurane levels (n = 1; 0.8, 0.5, and 0.0%) were recorded with a 20-min interval between them. Evoked LFP response in bilateral V1 did not increase despite increased transmission fidelity and decreased adaptation of evoked LFPs in ipsilateral VPM and bilateral S1. This finding indicates that brain-wide activity can be evoked only at low frequencies and supports our contention that high-frequency thalamic stimulation will not activate long-range circuits beyond its projected area. Note the increase in background LFPs, particularly in bilateral V1, when isoflurane is decreased.
In this study, we show that constant recruitment of dynamic network interactions through continuous low-frequency VPM stimulation increased SC BOLD activation to external visual stimulus and that such SC enhancement persisted after cessation of VPM optogenetic stimulation (Fig. 6). This observation indicates that sensory gain, a fundamental component of sensory information processing (58, 59), can be modulated in the SC during and after continual activation of long-range circuits. Low-frequency stimulation coincided with VPM burst activity, which is modulated by cortico-thalamic input (50, 51). Furthermore, thalamic bursting activity can increase due to enhancement of sensory feedback gain from cortical to thalamic regions (50). Hence, the enhanced SC activation observed here could result from burst information relayed to sensory cortices from VPM and facilitated through direct cortico-tectal projections from V1 and/or S1 (24, 60). Neural plasticity mechanisms are also likely recruited. These mechanisms can readjust the neuronal components stimulating homeostatic regulation of neural circuit functions, such as neuronal or network excitability changes. Here, we define neural plasticity as the ability of the nervous system to adopt a new functional or structural state in response to extrinsic and intrinsic factors (61). Plasticity occurs at different neurodevelopmental stages spontaneously (62) and as driven by sensory experiences (63). Such sequential combination of spontaneously generated and experience-dependent neural activity endows the brain with the ability to accommodate changing, dynamic inputs throughout the life span. Studies demonstrate that both spontaneous and experience-dependent neural activity predominates at low frequencies (64–66), which further corroborates our findings that low-frequency activity is intimately coupled with long-range projections and their dynamic interactions.
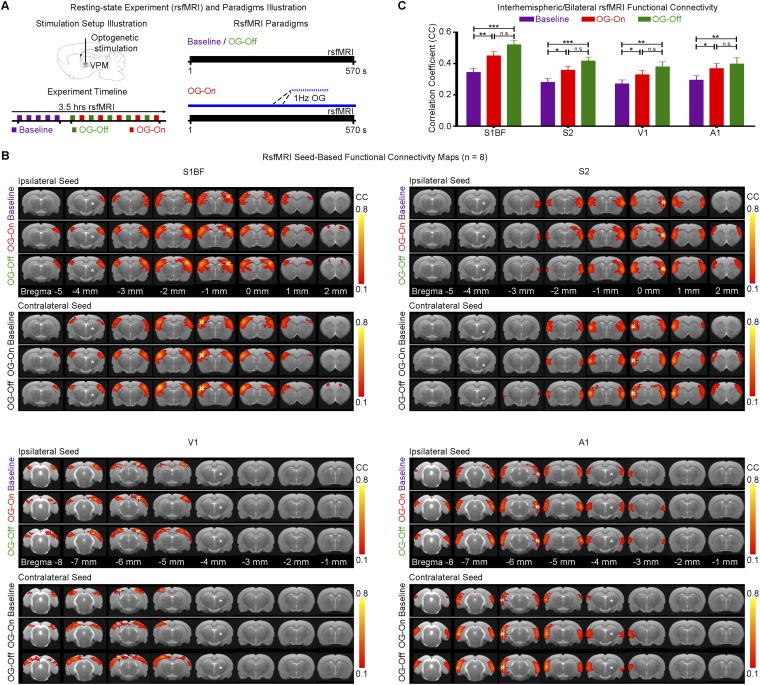
At present, functional connectivity is defined as the temporal coherence of neural activity patterns among spatially segregated brain regions at low and ultra-low frequencies, which has been most widely measured by rsfMRI (5–12). However, interpretation of functional connectivity studies remains challenging because functional coupling changes dynamically. This dynamic property suggests that it is constrained by, but not fully dictated by, anatomical connectivity. Furthermore, the neural mechanisms underlying long-range, functional coupling remain unknown. Few studies have investigated this question directly (21, 67). In this study, we also performed rsfMRI measurements (Fig. S7). Our preliminary rsfMRI results show an increase in long-range interhemispheric connectivity in S1BF, S2, V1, and A1 during and after low-frequency VPM stimulation. Our findings suggest that functional connectivity can be directly altered by low-frequency stimulation. Thus, brain-wide functional connectivity is intimately linked to low-frequency neural activity.
Fig. S7.
A 1-Hz optogenetic VPM stimulation enhances interhemispheric (i.e., bilateral) functional connectivity of sensory cortices. (A) Illustration of continuous 1-Hz optogenetic stimulation during a rsfMRI scan (Right). rsfMRI scans were performed before (baseline), during (OG-On), and after (OG-Off) optogenetic stimulation. Typically, five baseline rsfMRI scans were acquired before five OG-On scans were interleaved with five OG-Off scans (Left). (B) Functional connectivity maps of S1BF, S2, V1, and A1 before, during, and after 1 Hz of optogenetic stimulation (n = 8; asterisk: stimulation site). The maps are generated using a seed defined in ipsilateral and contralateral S1BF, S2, V1, and A1 (where seed location is indicated by a blue crosshair). In general, interhemispheric/bilateral S1BF, S2, V1, and A1 functional connectivities were observed to increase during the OG-On period, which remained elevated during the OG-Off period. (C) Analysis of average bilateral connectivity correlation coefficient values (n = 8; error bar indicates ± SEM, one-way ANOVA with post hoc Bonferroni correction; ***P < 0.001; **P < 0.01; *P < 0.05; n.s., not significant). Bilateral connectivity was strengthened significantly during and after optogenetic stimulation for all four sensory cortices. These results show that bilateral functional connectivity in somatosensory, visual, and auditory cortices can be directly altered by low-frequency VPM stimulation, which suggests an intimate link between brain-wide functional connectivity and low-frequency neural activity.
In this study, we also examined the nonlemniscal somatosensory thalamus, POm (Fig. 7). We observed brain-wide neural activity upon POm stimulation at low frequencies (1 and 5 Hz). Interestingly, its spatiotemporal response properties are different from those observed through VPM stimulation. The thalamus is a relay center for cortical sensory information. Axonal tracing (68), electrophysiology (41, 69), and behavioral (70) studies show parallel, but functionally distinct, thalamo-cortical projections, including lemniscal VPM vs. paralemniscal POm. Previous studies also characterized the differences between VPM and POm thalamo-cortical projections in S1BF, in which VPM thalamo-cortical projections define an essential cortical activity pattern, whereas POm thalamo-cortical projections affect the effectiveness of transmission (69, 71). Here, our fMRI results reveal that POm stimulation yields highly different spatiotemporal response characteristics from those by VPM stimulation. These findings suggest that POm is functionally distinct from VPM and that the paralemniscal pathway also plays an essential role in multisensory processing.
Optogenetic VPM or POm stimulation might antidromically activate somatosensory cortex. However, the experimental evidence from our fMRI and electrophysiological recordings strongly indicates that the observed spatiotemporally distinct brain-wide responses are likely not caused by antidromic S1 activation. Specifically, MUA recordings show the latency between optogenetic pulse onset and initial spikes as 3.3 ± 1.4 ms and 4.3 ± 2.3 ms for VPM and POm stimulation, respectively (Fig. 4A and Fig. S5B). These latencies are characteristic of orthodromic activation of VPM or POm thalamo-cortical excitatory neurons (40, 72), whereas antidromic activation exhibits a shorter latency with less variation (73). The VPM to ipsilateral S1 propagation time of 9.6 ± 0.6 ms (Fig. 5D) also corresponds well to published values for orthodromic propagation (41). These timing measurements support that our VPM or POm stimulation activates S1 orthodromically rather than antidromically, at least in a predominant manner. In addition, antidromic activation is unlikely because the anterograde and monosynaptic nature of our used viral transduction expresses the optogenetic construct only in VPM or POm and its ascending cortical targets (i.e., AAV5-CaMKIIα-ChR2) (Figs. S1 and S5), without further transfecting descending cortico-thalamic projections from somatosensory cortex (34, 74).
In summary, our results directly demonstrate that low-frequency activity supports large-scale brain-wide interactions over long-range excitatory projections, such that low-frequency activity plays a pivotal role in functional integration of remote brain regions. Such spatiotemporal characteristics can contribute to the neural basis of brain functional connectivity measured by rsfMRI. In addition, this study presents the combined use of large-view fMRI, optogenetic neuromodulation, and external stimuli or tasks as a valuable means to dissect brain long-range interactions and their functions over a large scale.
Materials and Methods
Subjects.
All animal experiments were approved by the University of Hong Kong's Committee on the Use of Live Animals in Teaching and Research (CULATR). Five groups of adult male Sprague-Dawley rats were used: group I (VPM, n = 6; POm, n = 6) for fMRI experiments; group II (VPM, n = 3 for LFP and n = 2 for MUA) for electrophysiological recordings; group III (VPM, n = 6) for dual stimulation (visual and optogenetic) fMRI experiments; and group IV (VPM, n = 8) for optogenetic and rsfMRI experiments.
Virus Packaging.
Recombinant AAV vectors were serotyped with AAV5-coated proteins and produced by the Vector Core of the University of North Carolina. Viral titer in particles per milliliter was 4 × 10¹² for AAV5-CaMKIIα-ChR2 (H134R)-mCherry. Maps are available online from www.stanford.edu/group/dlab/optogenetics.
Stereotactic Surgery for Viral Injection.
After the craniotomy was made, viral injections were performed at two depths in VPM [−3.6 mm posterior to Bregma, +3.0 mm medial-lateral (ML) right hemisphere, −5.8 mm and −6.2 mm from surface of dura] and POm (−3.6 mm posterior to Bregma, +2.1 mm ML right hemisphere, −5.0 mm and −5.4 mm from surface of dura) with subsequent verification by high-resolution anatomic MRI. Viral constructs were delivered at a 1.5-μL volume at each depth through a 5-μL syringe and 33-gauge beveled needle injected at a rate of 150 nL/min. Animals recovered for 4 wk before fMRI experiments were performed.
Animal Preparation for MRI Experiment.
Surgery was performed under 2% isoflurane to implant an optical fiber cannula with a 450-μm diameter at the injection site with high-resolution anatomic MRI verification. The fiber-tip surface was beveled to facilitate the fiber insertion and minimize injury to brain tissue. Dental cement fixed the fiber on the skull.
MRI-Synchronized Optogenetic and Visual Stimulation.
For optogenetic stimulation, blue light was delivered to VPM or POm nucleus using a 473-nm diode-pumped solid-state laser with calibrated power of 8 mW (40 mW/mm2) at the fiber tip. Optical fiber cannulas were made opaque using heat-shrinkable sleeves to prevent light leakage that may cause undesired visual stimulation. Both VPM and POm are large thalamic nuclei (Figs. S1 and S5). The optical fiber tip was typically situated in the center of the VPM or POm nucleus through stereotaxic implantation. The spatial spread from the fiber tip for 473 nm of blue light is rather small (200 μm and 350 μm at 50% and 10% of initial light intensity, respectively) and has little or no spreading in the backward direction (74), confining the optogenetic stimulation within the VPM or POm nucleus. For both VPM and POm fMRI experiments, five frequencies were used (1 Hz with 10% duty cycle; 5, 10, 20, and 40 Hz with 30% duty cycle). Here, we chose a reduced duty cycle of 10% for 1 Hz of stimulation (in contrast to 30% for 5–40 Hz) to avoid the use of very long stimulation pulse widths (300 ms). Long ChR2 optogenetic pulse width can cause neuronal output silencing and adversely affect the neural activity efficacy (75). VPM or POm was stimulated with a block design paradigm that consisted of 20-s-on and 60-s-off periods. A total of nine fMRI sessions were performed on each animal. Each session included 10 blocks, with each frequency occupying two blocks. Different frequencies were presented in a pseudorandom manner. For dual optogenetic/visual stimulation, additional blue light stimulation was presented via a separate optical patch cable at 20 mm in front of both eyes, with power calibrated at 0.5 mW. Visual stimulation (1 Hz and 10% duty cycle) was presented in a block design paradigm of 20-s-on and 40-s-off periods. Each fMRI session included four blocks of visual stimulation. Fifteen fMRI sessions were performed on each animal, 5 before (baseline), 5 during (OG-On), and 5 after (OG-Off) optogenetic stimulation. For rsfMRI experiments, 15 fMRI sessions were performed on each animal, 5 baseline, 5 OG-On, and 5 OG-Off.
MRI Acquisitions.
All MRI experiments were carried out on a 7T MRI scanner. Scout and anatomical images were first acquired for accurate positioning and reference. fMRI and rsfMRI measurements were made using a single-shot gradient-echo echo-planar imaging (GE-EPI) sequence with 32 mm2 × 32 mm2 field of view, 64 × 64 matrix, flip angle 56°, and echo time/repetition time (TE/TR) = 20/1,000 ms. During MRI, anesthesia was maintained with 1.0% isoflurane. Animal heart rate, respiration rate, oxygen saturation, and rectal temperature were continuously monitored (10, 43, 76). Note that the fiber outside brain was made opaque using heat-shrinkable sleeves to avoid artificial visual stimulation.
fMRI and rsfMRI Data Analysis.
fMRI analysis was performed using the procedure established in our previous studies (43, 76). In brief, all GE-EPI images were first coregistered for each animal using SPM8 and registered to a custom-made brain template. For individual animals, data from fMRI sessions were averaged, smoothed, and high-pass-filtered. Then, a general linear was applied to calculate the response coefficient (β) maps for each stimulus. Student’s t test was performed to identify activated voxels using the threshold P < 0.001 and cluster size ≥4. BOLD temporal profiles were extracted from regions of interest (ROIs) delineated from the rat brain atlas. rsfMRI analysis was performed according to a procedure reported in our previous study (10).
LFP and MUA Recordings and Analyses.
Simultaneous LFP recordings at five brain regions were performed on animals using the same anesthesia protocol (1.0% isoflurane) as in MRI experiments. Craniotomies (1-mm diameter) were made over bilateral S1 (+0.1 mm anterior to Bregma, ±5.0 mm ML), bilateral V1 (−6.0 mm posterior to Bregma, ±4.0 mm ML), and a 5-mm-diameter craniotomy over the stimulation site VPM (−3.6 mm posterior to Bregma, +3.0 mm ML right hemisphere). Single tungsten microelectrodes (1 MΩ and 10-μm tip diameter) were placed in bilateral S1 and V1 approximately between layers IV and V. For VPM, a homemade optrode was used. It consisted of a single tungsten microelectrode (2 MΩ and 10-μm tip diameter) coupled to the fiber using protocols as described previously (77). LFP and MUA recordings were acquired using a 32-channel OpenEphys system with a 30-kHz sampling frequency. The optogenetic stimulation paradigm was the same as used in fMRI experiments. Again, these optical fiber cannulas were made opaque using heat-shrinkable sleeves to prevent light leakage that causes inadvertent direct visual stimulation.
Additional optogenetic stimulation paradigms were used to compare the effects of short- and long-light pulse durations (10/100, 10/60, and 10/30 ms for 1, 5, and 10 Hz, respectively) and different light intensities (40, 20, and 15 mW/mm2) on the evoked LFP responses. Additional anesthesia protocols were used to determine the effects of different anesthesia levels (0.8, 0.5, and 0.0% isoflurane) on evoked LFP responses. Recordings under 0.0% isoflurane were performed at 5 min and 15 min after cessation of isoflurane.
For LFP analysis, raw data were band-pass-filtered (1–300 Hz) and notch-filtered for 50 Hz using Matlab. Individual LFP and group-averaged LFP traces were generated. The LFP latency was measured from the onset of light pulse to the first peak location. MUA analysis was performed using Offline Sorter software (Plexon Inc.) for spike sorting and Neuroexplorer software (Nex Technologies) and Matlab for calculating spike frequencies and generating averaged traces. For spike identification, spikes were first sorted using an automated shape-based spike-sorting method, in which a negative and positive threshold crossing at twice the noise SD was imposed, and then this sorting was verified by visual inspection before spike frequency analysis. To quantify the optogenetically evoked spike frequency during the 20-s optogenetic stimulation block, spikes were identified during the optogenetic stimulation pulse period and verified to be stimulus-locked. That is, only the first spike within a predefined 2- to 5-ms window after the onset of each optogenetic stimulation pulse was counted as a spiking event, and the subsequent spikes within the stimulation pulse period were discarded. To quantify the spontaneous spike frequency before and after the 20-s optogenetic stimulation block, the sorted spikes were counted by imposing an interspike interval of 100 ms that was determined based on the temporal characteristics of the thalamic burst activity predominantly observed in the absence of stimuli. The above procedure ensured that both thalamic burst (typically, consecutive multiple spikes within the 20- to 80-ms window) and tonic activity (single spikes lasting less than 5 ms) were characterized as one single spiking event to measure optogenetically evoked spike frequency. The procedure was sensitive to detecting the failure of optogenetic pulses in evoking spikes.
Histology, Immunohistochemistry, and Confocal Imaging.
Upon completion of all fMRI and electrophysiological recording experiments, a selected number of animals (n = 3 for VPM; n = 2 for POm) were transcardially perfused, and their brains sectioned and prepared. Consecutive sections (120 μm apart) were prepared according to a previously published procedure (78). Double or triple immunofluorescence was assessed using a confocal scanning laser microscope.
Data Availability.
The data that support the findings of this study are available from the corresponding author on request.
Acknowledgments
We thank Drs. I. Timofeev, M. M. Poo, X. Han, J. H. Lee, D. H. Sanes, J. F. He, and C. S. Poon for insightful comments; Drs. A. To, S. J. Fan, K. K. Y. Wong, Y. I. Shih, Q. Li, L. Xu, X. Li, W. Chen, H. Lei, L. C. Ho, M. Lyu, Y. Liu, and A. Mok for technical assistance; and Dr. K. Deisseroth for providing us with the ChR2 viral construct. This work was supported by the Hong Kong Research Grant Council (HKU17103015 to E.X.W.), State Key Laboratory of Pharmaceutical Biotechnology at the University of Hong Kong, and a generous donation from the Lam Woo Foundation.
Footnotes
The authors declare no conflict of interest.
This article is a PNAS Direct Submission.
This article contains supporting information online at www.pnas.org/lookup/suppl/doi:10.1073/pnas.1616361113/-/DCSupplemental.
References
- 1.Stern P. The heavily connected brain. Connection, connection, connection... Introduction. Science. 2013;342(6158):577. doi: 10.1126/science.342.6158.577. [DOI] [PubMed] [Google Scholar]
- 2.Oh SW, et al. A mesoscale connectome of the mouse brain. Nature. 2014;508(7495):207–214. doi: 10.1038/nature13186. [DOI] [PMC free article] [PubMed] [Google Scholar]
- 3.Park H-J, Friston K. Structural and functional brain networks: From connections to cognition. Science. 2013;342(6158):1238411. doi: 10.1126/science.1238411. [DOI] [PubMed] [Google Scholar]
- 4.Kasthuri N, et al. Saturated reconstruction of a volume of neocortex. Cell. 2015;162(3):648–661. doi: 10.1016/j.cell.2015.06.054. [DOI] [PubMed] [Google Scholar]
- 5.Fox MD, Raichle ME. Spontaneous fluctuations in brain activity observed with functional magnetic resonance imaging. Nat Rev Neurosci. 2007;8(9):700–711. doi: 10.1038/nrn2201. [DOI] [PubMed] [Google Scholar]
- 6.Buckner RL, Krienen FM, Yeo BT. Opportunities and limitations of intrinsic functional connectivity MRI. Nat Neurosci. 2013;16(7):832–837. doi: 10.1038/nn.3423. [DOI] [PubMed] [Google Scholar]
- 7.Smith SM, et al. WU-Minn HCP Consortium Resting-state fMRI in the Human Connectome Project. Neuroimage. 2013;80:144–168. doi: 10.1016/j.neuroimage.2013.05.039. [DOI] [PMC free article] [PubMed] [Google Scholar]
- 8.Wang D, et al. Parcellating cortical functional networks in individuals. Nat Neurosci. 2015;18(12):1853–1860. doi: 10.1038/nn.4164. [DOI] [PMC free article] [PubMed] [Google Scholar]
- 9.Liang X, Zou Q, He Y, Yang Y. Coupling of functional connectivity and regional cerebral blood flow reveals a physiological basis for network hubs of the human brain. Proc Natl Acad Sci USA. 2013;110(5):1929–1934. doi: 10.1073/pnas.1214900110. [DOI] [PMC free article] [PubMed] [Google Scholar]
- 10.Zhou IY, et al. Brain resting-state functional MRI connectivity: Morphological foundation and plasticity. Neuroimage. 2014;84:1–10. doi: 10.1016/j.neuroimage.2013.08.037. [DOI] [PubMed] [Google Scholar]
- 11.Lu H, et al. Low- but not high-frequency LFP correlates with spontaneous BOLD fluctuations in rat whisker barrel cortex. Cereb Cortex. 2016;26(2):683–694. doi: 10.1093/cercor/bhu248. [DOI] [PMC free article] [PubMed] [Google Scholar]
- 12.Belcher AM, et al. Functional connectivity hubs and networks in the awake marmoset brain. Front Integr Nuerosci. 2016;10:9. doi: 10.3389/fnint.2016.00009. [DOI] [PMC free article] [PubMed] [Google Scholar]
- 13.Boyden ES, Zhang F, Bamberg E, Nagel G, Deisseroth K. Millisecond-timescale, genetically targeted optical control of neural activity. Nat Neurosci. 2005;8(9):1263–1268. doi: 10.1038/nn1525. [DOI] [PubMed] [Google Scholar]
- 14.Deisseroth K. Optogenetics. Nat Methods. 2011;8(1):26–29. doi: 10.1038/nmeth.f.324. [DOI] [PMC free article] [PubMed] [Google Scholar]
- 15.Steriade M, Contreras D, Curró Dossi R, Nuñez A. The slow (< 1 Hz) oscillation in reticular thalamic and thalamocortical neurons: Scenario of sleep rhythm generation in interacting thalamic and neocortical networks. J Neurosci. 1993;13(8):3284–3299. doi: 10.1523/JNEUROSCI.13-08-03284.1993. [DOI] [PMC free article] [PubMed] [Google Scholar]
- 16.Crunelli V, Hughes SW. The slow (<1 Hz) rhythm of non-REM sleep: A dialogue between three cardinal oscillators. Nat Neurosci. 2010;13(1):9–17. doi: 10.1038/nn.2445. [DOI] [PMC free article] [PubMed] [Google Scholar]
- 17.Mohajerani MH, et al. Spontaneous cortical activity alternates between motifs defined by regional axonal projections. Nat Neurosci. 2013;16(10):1426–1435. doi: 10.1038/nn.3499. [DOI] [PMC free article] [PubMed] [Google Scholar]
- 18.Stroh A, et al. Making waves: Initiation and propagation of corticothalamic Ca2+ waves in vivo. Neuron. 2013;77(6):1136–1150. doi: 10.1016/j.neuron.2013.01.031. [DOI] [PubMed] [Google Scholar]
- 19.Buzsáki G, Logothetis N, Singer W. Scaling brain size, keeping timing: Evolutionary preservation of brain rhythms. Neuron. 2013;80(3):751–764. doi: 10.1016/j.neuron.2013.10.002. [DOI] [PMC free article] [PubMed] [Google Scholar]
- 20.Siegel M, Donner TH, Engel AK. Spectral fingerprints of large-scale neuronal interactions. Nat Rev Neurosci. 2012;13(2):121–134. doi: 10.1038/nrn3137. [DOI] [PubMed] [Google Scholar]
- 21.Wang L, Saalmann YB, Pinsk MA, Arcaro MJ, Kastner S. Electrophysiological low-frequency coherence and cross-frequency coupling contribute to BOLD connectivity. Neuron. 2012;76(5):1010–1020. doi: 10.1016/j.neuron.2012.09.033. [DOI] [PMC free article] [PubMed] [Google Scholar]
- 22.Ekman M, Derrfuss J, Tittgemeyer M, Fiebach CJ. Predicting errors from reconfiguration patterns in human brain networks. Proc Natl Acad Sci USA. 2012;109(41):16714–16719. doi: 10.1073/pnas.1207523109. [DOI] [PMC free article] [PubMed] [Google Scholar]
- 23.Somogyi P, Tamás G, Lujan R, Buhl EH. Salient features of synaptic organisation in the cerebral cortex. Brain Res Brain Res Rev. 1998;26(2-3):113–135. doi: 10.1016/s0165-0173(97)00061-1. [DOI] [PubMed] [Google Scholar]
- 24.Brown SP, Hestrin S. Intracortical circuits of pyramidal neurons reflect their long-range axonal targets. Nature. 2009;457(7233):1133–1136. doi: 10.1038/nature07658. [DOI] [PMC free article] [PubMed] [Google Scholar]
- 25.Viaene AN, Petrof I, Sherman SM. Synaptic properties of thalamic input to the subgranular layers of primary somatosensory and auditory cortices in the mouse. J Neurosci. 2011;31(36):12738–12747. doi: 10.1523/JNEUROSCI.1565-11.2011. [DOI] [PMC free article] [PubMed] [Google Scholar]
- 26.Viaene AN, Petrof I, Sherman SM. Synaptic properties of thalamic input to layers 2/3 and 4 of primary somatosensory and auditory cortices. J Neurophysiol. 2011;105(1):279–292. doi: 10.1152/jn.00747.2010. [DOI] [PMC free article] [PubMed] [Google Scholar]
- 27.MacLean JN, Watson BO, Aaron GB, Yuste R. Internal dynamics determine the cortical response to thalamic stimulation. Neuron. 2005;48(5):811–823. doi: 10.1016/j.neuron.2005.09.035. [DOI] [PubMed] [Google Scholar]
- 28.Poulet JF, Fernandez LM, Crochet S, Petersen CC. Thalamic control of cortical states. Nat Neurosci. 2012;15(3):370–372. doi: 10.1038/nn.3035. [DOI] [PubMed] [Google Scholar]
- 29.Alonso JM, Swadlow HA. Thalamus controls recurrent cortical dynamics. Nat Neurosci. 2015;18(12):1703–1704. doi: 10.1038/nn.4175. [DOI] [PubMed] [Google Scholar]
- 30.Fanselow EE, Sameshima K, Baccala LA, Nicolelis MA. Thalamic bursting in rats during different awake behavioral states. Proc Natl Acad Sci USA. 2001;98(26):15330–15335. doi: 10.1073/pnas.261273898. [DOI] [PMC free article] [PubMed] [Google Scholar]
- 31.McCormick DA, McGinley MJ, Salkoff DB. Brain state dependent activity in the cortex and thalamus. Curr Opin Neurobiol. 2015;31:133–140. doi: 10.1016/j.conb.2014.10.003. [DOI] [PMC free article] [PubMed] [Google Scholar]
- 32.Logothetis NK, et al. The effects of electrical microstimulation on cortical signal propagation. Nat Neurosci. 2010;13(10):1283–1291. doi: 10.1038/nn.2631. [DOI] [PubMed] [Google Scholar]
- 33.Millard DC, Whitmire CJ, Gollnick CA, Rozell CJ, Stanley GB. Electrical and optical activation of mesoscale neural circuits with implications for coding. J Neurosci. 2015;35(47):15702–15715. doi: 10.1523/JNEUROSCI.5045-14.2015. [DOI] [PMC free article] [PubMed] [Google Scholar]
- 34.Cruikshank SJ, Urabe H, Nurmikko AV, Connors BW. Pathway-specific feedforward circuits between thalamus and neocortex revealed by selective optical stimulation of axons. Neuron. 2010;65(2):230–245. doi: 10.1016/j.neuron.2009.12.025. [DOI] [PMC free article] [PubMed] [Google Scholar]
- 35.Crandall SR, Cruikshank SJ, Connors BW. A corticothalamic switch: Controlling the thalamus with dynamic synapses. Neuron. 2015;86(3):768–782. doi: 10.1016/j.neuron.2015.03.040. [DOI] [PMC free article] [PubMed] [Google Scholar]
- 36.Benson DL, Isackson PJ, Hendry SH, Jones EG. Differential gene expression for glutamic acid decarboxylase and type II calcium-calmodulin-dependent protein kinase in basal ganglia, thalamus, and hypothalamus of the monkey. J Neurosci. 1991;11(6):1540–1564. doi: 10.1523/JNEUROSCI.11-06-01540.1991. [DOI] [PMC free article] [PubMed] [Google Scholar]
- 37.Logothetis NK, Pauls J, Augath M, Trinath T, Oeltermann A. Neurophysiological investigation of the basis of the fMRI signal. Nature. 2001;412(6843):150–157. doi: 10.1038/35084005. [DOI] [PubMed] [Google Scholar]
- 38.Mattis J, et al. Principles for applying optogenetic tools derived from direct comparative analysis of microbial opsins. Nat Methods. 2011;9(2):159–172. doi: 10.1038/nmeth.1808. [DOI] [PMC free article] [PubMed] [Google Scholar]
- 39.Castro-Alamancos MA. Properties of primary sensory (lemniscal) synapses in the ventrobasal thalamus and the relay of high-frequency sensory inputs. J Neurophysiol. 2002;87(2):946–953. doi: 10.1152/jn.00426.2001. [DOI] [PubMed] [Google Scholar]
- 40.Landisman CE, Connors BW. VPM and PoM nuclei of the rat somatosensory thalamus: Intrinsic neuronal properties and corticothalamic feedback. Cereb Cortex. 2007;17(12):2853–2865. doi: 10.1093/cercor/bhm025. [DOI] [PubMed] [Google Scholar]
- 41.Ahissar E, Sosnik R, Haidarliu S. Transformation from temporal to rate coding in a somatosensory thalamocortical pathway. Nature. 2000;406(6793):302–306. doi: 10.1038/35018568. [DOI] [PubMed] [Google Scholar]
- 42.Debanne D, Campanac E, Bialowas A, Carlier E, Alcaraz G. Axon physiology. Physiol Rev. 2011;91(2):555–602. doi: 10.1152/physrev.00048.2009. [DOI] [PubMed] [Google Scholar]
- 43.Zhou IY, Cheung MM, Lau C, Chan KC, Wu EX. Balanced steady-state free precession fMRI with intravascular susceptibility contrast agent. Magn Reson Med. 2012;68(1):65–73. doi: 10.1002/mrm.23202. [DOI] [PubMed] [Google Scholar]
- 44.Pawela CP, et al. Modeling of region-specific fMRI BOLD neurovascular response functions in rat brain reveals residual differences that correlate with the differences in regional evoked potentials. Neuroimage. 2008;41(2):525–534. doi: 10.1016/j.neuroimage.2008.02.022. [DOI] [PMC free article] [PubMed] [Google Scholar]
- 45.Lau C, et al. BOLD responses in the superior colliculus and lateral geniculate nucleus of the rat viewing an apparent motion stimulus. Neuroimage. 2011;58(3):878–884. doi: 10.1016/j.neuroimage.2011.06.055. [DOI] [PubMed] [Google Scholar]
- 46.Isaacson JS, Scanziani M. How inhibition shapes cortical activity. Neuron. 2011;72(2):231–243. doi: 10.1016/j.neuron.2011.09.027. [DOI] [PMC free article] [PubMed] [Google Scholar]
- 47.Douglas RJ, Martin KA. Recurrent neuronal circuits in the neocortex. Curr Biol. 2007;17(13):R496–R500. doi: 10.1016/j.cub.2007.04.024. [DOI] [PubMed] [Google Scholar]
- 48.Markram H, et al. Interneurons of the neocortical inhibitory system. Nat Rev Neurosci. 2004;5(10):793–807. doi: 10.1038/nrn1519. [DOI] [PubMed] [Google Scholar]
- 49.Sherman SM. Tonic and burst firing: Dual modes of thalamocortical relay. Trends Neurosci. 2001;24(2):122–126. doi: 10.1016/s0166-2236(00)01714-8. [DOI] [PubMed] [Google Scholar]
- 50.Krahe R, Gabbiani F. Burst firing in sensory systems. Nat Rev Neurosci. 2004;5(1):13–23. doi: 10.1038/nrn1296. [DOI] [PubMed] [Google Scholar]
- 51.Mease RA, Krieger P, Groh A. Cortical control of adaptation and sensory relay mode in the thalamus. Proc Natl Acad Sci USA. 2014;111(18):6798–6803. doi: 10.1073/pnas.1318665111. [DOI] [PMC free article] [PubMed] [Google Scholar]
- 52.Steriade M, McCormick DA, Sejnowski TJ. Thalamocortical oscillations in the sleeping and aroused brain. Science. 1993;262(5134):679–685. doi: 10.1126/science.8235588. [DOI] [PubMed] [Google Scholar]
- 53.Swadlow HA, Gusev AG. The impact of ‘bursting’ thalamic impulses at a neocortical synapse. Nat Neurosci. 2001;4(4):402–408. doi: 10.1038/86054. [DOI] [PubMed] [Google Scholar]
- 54.David F, et al. Essential thalamic contribution to slow waves of natural sleep. J Neurosci. 2013;33(50):19599–19610. doi: 10.1523/JNEUROSCI.3169-13.2013. [DOI] [PMC free article] [PubMed] [Google Scholar]
- 55.Bezdudnaya T, et al. Thalamic burst mode and inattention in the awake LGNd. Neuron. 2006;49(3):421–432. doi: 10.1016/j.neuron.2006.01.010. [DOI] [PubMed] [Google Scholar]
- 56.Wallace MT, Ramachandran R, Stein BE. A revised view of sensory cortical parcellation. Proc Natl Acad Sci USA. 2004;101(7):2167–2172. doi: 10.1073/pnas.0305697101. [DOI] [PMC free article] [PubMed] [Google Scholar]
- 57.Stein BE, Stanford TR, Rowland BA. Development of multisensory integration from the perspective of the individual neuron. Nat Rev Neurosci. 2014;15(8):520–535. doi: 10.1038/nrn3742. [DOI] [PMC free article] [PubMed] [Google Scholar]
- 58.Hillyard SA, Vogel EK, Luck SJ. Sensory gain control (amplification) as a mechanism of selective attention: Electrophysiological and neuroimaging evidence. Philos Trans R Soc Lond B Biol Sci. 1998;353(1373):1257–1270. doi: 10.1098/rstb.1998.0281. [DOI] [PMC free article] [PubMed] [Google Scholar]
- 59.Schwartz O, Simoncelli EP. Natural signal statistics and sensory gain control. Nat Neurosci. 2001;4(8):819–825. doi: 10.1038/90526. [DOI] [PubMed] [Google Scholar]
- 60.Zakiewicz IM, Bjaalie JG, Leergaard TB. Brain-wide map of efferent projections from rat barrel cortex. Front Neuroinform. 2014;8:5. doi: 10.3389/fninf.2014.00005. [DOI] [PMC free article] [PubMed] [Google Scholar]
- 61.Ganguly K, Poo MM. Activity-dependent neural plasticity from bench to bedside. Neuron. 2013;80(3):729–741. doi: 10.1016/j.neuron.2013.10.028. [DOI] [PubMed] [Google Scholar]
- 62.Feller MB. Spontaneous correlated activity in developing neural circuits. Neuron. 1999;22(4):653–656. doi: 10.1016/s0896-6273(00)80724-2. [DOI] [PubMed] [Google Scholar]
- 63.Katz LC, Shatz CJ. Synaptic activity and the construction of cortical circuits. Science. 1996;274(5290):1133–1138. doi: 10.1126/science.274.5290.1133. [DOI] [PubMed] [Google Scholar]
- 64.Tritsch NX, Yi E, Gale JE, Glowatzki E, Bergles DE. The origin of spontaneous activity in the developing auditory system. Nature. 2007;450(7166):50–55. doi: 10.1038/nature06233. [DOI] [PubMed] [Google Scholar]
- 65.Gao L, et al. Entrainment of slow oscillations of auditory thalamic neurons by repetitive sound stimuli. J Neurosci. 2009;29(18):6013–6021. doi: 10.1523/JNEUROSCI.5733-08.2009. [DOI] [PMC free article] [PubMed] [Google Scholar]
- 66.Timofeev I. Neuronal plasticity and thalamocortical sleep and waking oscillations. Prog Brain Res. 2011;193:121–144. doi: 10.1016/B978-0-444-53839-0.00009-0. [DOI] [PMC free article] [PubMed] [Google Scholar]
- 67.Schölvinck ML, Maier A, Ye FQ, Duyn JH, Leopold DA. Neural basis of global resting-state fMRI activity. Proc Natl Acad Sci USA. 2010;107(22):10238–10243. doi: 10.1073/pnas.0913110107. [DOI] [PMC free article] [PubMed] [Google Scholar]
- 68.Ohno S, et al. A morphological analysis of thalamocortical axon fibers of rat posterior thalamic nuclei: A single neuron tracing study with viral vectors. Cereb Cortex. 2012;22(12):2840–2857. doi: 10.1093/cercor/bhr356. [DOI] [PubMed] [Google Scholar]
- 69.Viaene AN, Petrof I, Sherman SM. Properties of the thalamic projection from the posterior medial nucleus to primary and secondary somatosensory cortices in the mouse. Proc Natl Acad Sci USA. 2011;108(44):18156–18161. doi: 10.1073/pnas.1114828108. [DOI] [PMC free article] [PubMed] [Google Scholar]
- 70.Diamond ME, von Heimendahl M, Knutsen PM, Kleinfeld D, Ahissar E. ‘Where’ and ‘what’ in the whisker sensorimotor system. Nat Rev Neurosci. 2008;9(8):601–612. doi: 10.1038/nrn2411. [DOI] [PubMed] [Google Scholar]
- 71.Sherman SM, Guillery RW. On the actions that one nerve cell can have on another: Distinguishing “drivers” from “modulators.”. Proc Natl Acad Sci USA. 1998;95(12):7121–7126. doi: 10.1073/pnas.95.12.7121. [DOI] [PMC free article] [PubMed] [Google Scholar]
- 72.Chung S, Li X, Nelson SB. Short-term depression at thalamocortical synapses contributes to rapid adaptation of cortical sensory responses in vivo. Neuron. 2002;34(3):437–446. doi: 10.1016/s0896-6273(02)00659-1. [DOI] [PubMed] [Google Scholar]
- 73.Bezdudnaya T, Keller A. Laterodorsal nucleus of the thalamus: A processor of somatosensory inputs. J Comp Neurol. 2008;507(6):1979–1989. doi: 10.1002/cne.21664. [DOI] [PMC free article] [PubMed] [Google Scholar]
- 74.Yizhar O, Fenno LE, Davidson TJ, Mogri M, Deisseroth K. Optogenetics in neural systems. Neuron. 2011;71(1):9–34. doi: 10.1016/j.neuron.2011.06.004. [DOI] [PubMed] [Google Scholar]
- 75.Herman AM, Huang L, Murphey DK, Garcia I, Arenkiel BR. Cell type-specific and time-dependent light exposure contribute to silencing in neurons expressing Channelrhodopsin-2. eLife. 2014;3:e01481. doi: 10.7554/eLife.01481. [DOI] [PMC free article] [PubMed] [Google Scholar]
- 76.Gao PP, Zhang JW, Fan SJ, Sanes DH, Wu EX. Auditory midbrain processing is differentially modulated by auditory and visual cortices: An auditory fMRI study. Neuroimage. 2015;123:22–32. doi: 10.1016/j.neuroimage.2015.08.040. [DOI] [PubMed] [Google Scholar]
- 77.Sparta DR, et al. Construction of implantable optical fibers for long-term optogenetic manipulation of neural circuits. Nat Protoc. 2011;7(1):12–23. doi: 10.1038/nprot.2011.413. [DOI] [PMC free article] [PubMed] [Google Scholar]
- 78.Lee JH, et al. Global and local fMRI signals driven by neurons defined optogenetically by type and wiring. Nature. 2010;465(7299):788–792. doi: 10.1038/nature09108. [DOI] [PMC free article] [PubMed] [Google Scholar]
Associated Data
This section collects any data citations, data availability statements, or supplementary materials included in this article.
Data Availability Statement
The data that support the findings of this study are available from the corresponding author on request.


