Abstract
We report studies of unfolding and ultrafast hydration dynamics of the protein human serum albumin. Unique in this study is our ability to examine different domains of the same protein and the intermediate on the way to the unfolded state. With femtosecond resolution and site-selective labeling, we isolate the dynamics of domains I and II of the native protein, domain I of the intermediate at 2 M guanidine hydrochloride, and the unfolded state at 6 M of the denaturant. For studies of unfolding, we used the fluorophores, acrylodan (covalently bound to Cys-34 in domain I) and the intrinsic tryptophan (domain II), whereas for hydration dynamics, we probed acrylodan and prodan; the latter is bound to domain II. From the time-dependent spectra and the correlation functions, we obtained the time scale of dynamically ordered water: 57 ps for the more stable domain I and 32 ps for the less stable domain II, in contrast to ≈0.8 ps for labile, bulk-type water. This trend suggests an increased hydrophilic residues–water interaction of domain I, contrary to some packing models. In the intermediate state, which is characterized by essentially intact domain I and unfolded domain II, the dynamics of ordered water around domain I is nearly the same (61 ps) as that of native state (57 ps), whereas that in the unfolded protein is much shorter (13 ps). We discuss the role of this fluidity in the correlation between stability and function of the protein.
Hydration is an integral part of protein folding and unfolding. There are several models that deal with the issue of hydration, ranging from the crude hydrophobic (oil/water-like) description to the iceberg and energy landscape models (1–6). Clearly, both entropic and enthalpic, including heat capacity, changes (1–3) must be considered in the treatment of any model. What have not been directly probed experimentally are the relevant time scales involved in hydration dynamics and associated protein local motions. In this article, we study the dynamics of hydration (ref. 7 and references therein and ref. 8) in the different states of unfolding for the protein human serum albumin (HSA). Previously, in this laboratory, we have studied the dynamics of HSA molecular recognition (9), and here we report on the dynamics of hydration and unfolding of different domains of the protein, with the goal of elucidating the influence of specific regions of the landscape on dynamics and function. We use site-selective labeling in these domains and correlate hydration in different states with the degree of unfolding, or more accurately with the degree of denaturation (1).
HSA, which is the most abundant protein in the circulatory system, binds and transports a wide variety of fatty acids, metabolites, and drugs (10). It is a monomeric globular protein of 585 aa having three structurally similar α-helical domains I–III (11, 12). Several studies on the unfolding pathways of HSA have been reported in the literature (13–18). Most of the studies inferred that the unfolding of HSA by denaturants, such as urea and guanidine hydrochloride (Gdn·HCl), occurs through a highly cooperative two-state process involving only the native and unfolded states (13–16). However, some recent studies suggested that Gdn·HCl unfolding of HSA occurs through incremental loss of structure, with no stable intermediate state (17), whereas another study reported that unfolding occurs in multiple steps, with at least one intermediate (18). Thus, the presence of an intermediate state in the unfolding pathway of HSA remains controversial.
The unfolding studies reported here with >30 data points, for the sake of isolating possible intermediates, indicate the presence of an intermediate at 2–2.4 M Gdn·HCl and that it is characterized by an unfolded domain II and intact domain I. The protein is found to unfold completely at 6 M Gdn·HCl. In these different states, ultrafast hydration dynamics were obtained for the protein to unravel the nature of the water layer of the different domains, I and II. We also examined the rigidity of the selected sites by studying the anisotropy of their fluorescence on the femtosecond and beyond time scale.
Experimental Procedures
Sample Preparation. HSA (essentially fatty acid free), Gdn·HCl, Sephadex G-25, and L-tryptophan were obtained from Sigma. Acrylodan (6-acryloyl-2-(dimethylamino)naphthalene, AC) and prodan (6-propionyl-2-(dimethylamino)naphthalene, PD) were obtained from Molecular Probes. Dialysis membrane tubing (10-kDa cut-off) was obtained from Spectrum Laboratories, Houston. The buffer used was 50 mM sodium phosphate buffer, pH 7.0. Concentrations of HSA, AC, and PD in the said buffer were determined spectrophotometrically by using ε280 = 36.6 mM–1·cm–1 (13), ε360 = 12.9 mM–1·cm–1 (19), and ε365 = 14.5 mM–1·cm–1 (20), respectively. Deionized water (Nanopure, Dubuque, IA) was used in the preparation of buffer. All experiments were conducted at room temperature (25°C).
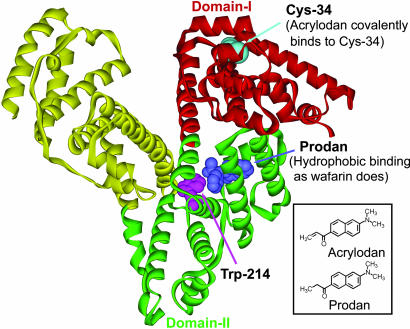
AC binds covalently to Cys-34 in domain I of HSA (Fig. 1) with binding affinity of 2.2 × 10⁶ M–1 (21). PD occupies the warfarin binding site (hydrophobic and electrostatic mode of binding) in domain II (22, 23) (Fig. 1) with a binding affinity of 3.9 × 10⁵ M–1 (23). AC-labeled HSA (AC-HSA) was prepared by using Wang et al.'s method (24) with minor modifications. Briefly, an aliquot of AC in acetonitrile was added to HSA in buffer to final concentrations of 110 and 100 μM, respectively. This mixture was incubated at room temperature with gentle stirring for 10 h followed by dialysis against 4 liters of 1:20 (vol/vol) acetonitrile buffer at first and then with two changes of 4 liters of buffer each, with an interval of 5 h. The sample was then passed through a Sephadex G-25 column. The above sample (10 μM) was used for hydration dynamics studies. PD-labeled HSA (PD-HSA) was prepared by adding an aliquot of PD in acetonitrile to HSA in buffer to final concentrations of 6.4 and 140 μM, respectively. The final acetonitrile concentration in the solution was <0.5%.
Fig. 1.
Structures of HSA, AC, and PD. The positions of the single cysteine (Cys-34), tryptophan (Trp-214), and PD are indicated. AC binds to Cys-34 and PD occupies the warfarin binding site. The x-ray crystal structure of the protein was obtained from the Protein Data Bank (ID code 1ha2).
Hydration Dynamics. The hydration dynamics experiments were carried out by using a femtosecond-resolved fluorescence up-conversion technique, as described (25). A femtosecond pulse of ≈200 nJ was used to excite the AC and PD at 360 nm. Fluorescence transients were collected with a time delay up to 300 ps. Time-resolved anisotropy [r(t)] and hydration correlation function [C(t)] decays were constructed according to the procedure reported in ref. 7 and references therein.
Unfolding Studies. Unfolding of the protein was monitored both by fluorescence and circular dichroism (CD) techniques. Protein solutions of 2–2.5 μM were equilibrated with various Gdn·HCl concentrations, ranging from 0 to 8 M for 2 h at room temperature before the spectra were taken. Fluorescence measurements were carried out by using a Spex Industries (Metuchen, NJ) FluoroMax-2 spectrofluorimeter with a rectangular cell of 10-mm path length. The unfolding of tertiary structure of domain I was monitored by AC fluorescence of AC-HSA at excitation wavelengths (λex) of 360 and 297 nm and that of domain II was monitored by tryptophan fluorescence of HSA at λex = 297 nm. The unfolding of the global secondary structure was monitored by measuring CD at 222 nm of AC-HSA in an Aviv Associates (Lakewood, NJ) 62A-DS spectropolarimeter with a rectangular cell of 2-mm path length.
Results
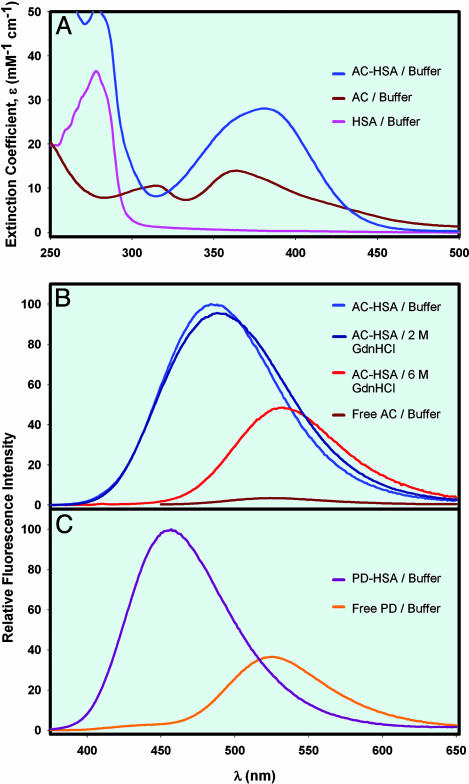
It has been reported that binding of AC and PD to HSA does not perturb the structure of the protein and unfolding pathway (17, 26, 27). AC and PD are naphthalene dyes that are very sensitive to the polarity of the medium with fluorescence emission maximum shifting from 401 nm in nonpolar cyclohexane to 531 nm in polar water (20); hence, they are suitable probes for hydration dynamics and unfolding studies. The fluorescence is strongly quenched in water and undergoes a dramatic increase upon binding to proteins. The emission maximum is blue-shifted from 525 nm to 487 nm for AC binding to HSA and to 457 nm for PD binding to HSA (Fig. 2). This high sensitivity to the solvent polarity is rooting from the emission from a planar intramolecular charge transfer state in which an electron transfer from the amino nitrogen to the carbonyl oxygen occurs, producing a substantial excited-state dipole moment (28), similar to other probes studied in this laboratory (ref. 7 and references therein). The fluorophores are in different locations. AC is covalently bound to Cys-34, which is at the surface. Although the location of PD (Fig. 1) is away from protein surface compared to the AC binding site, its emission maximum (457 nm) is significantly red-shifted from that in hydrophobic medium (401 nm) (20), indicating sufficient solvent exposure for probing ultrafast hydration dynamics. Trp-214 is buried in the interior of the protein. Two lifetime values, ≈2 and ≈4 ns at emission maximum, have been reported for AC-HSA in buffer (18, 29). For free PD in buffer, a single lifetime value of ≈2 ns (20, 30) and for PD-HSA in buffer, a mean lifetime value of ≈3 ns (31) have been reported.
Fig. 2.
Steady-state absorption and emission spectra. (A) Absorption spectra of HSA, free AC, and AC-HSA. (B) Steady-state fluorescence spectra of AC-HSA in buffer, 2 M Gdn·HCl, 6 M Gdn·HCl, and free AC in buffer. The excitation wavelength was 360 nm. (C) Steady-state fluorescence spectra of PD-HSA in buffer and free PD in buffer. The excitation wavelength was 360 nm.
The fluorescence of free probes AC, PD, and Trp showed no significant shift (<2 nm) in their emission maximum on increasing the Gdn·HCl concentration from 0 to 6 M (data not shown), suggesting that Gdn·HCl does not directly alter the polarity of the fluorophore environment. But, their intensity is found to increase (<70%). However, this finding does not hinder our interpretation of the unfolding data, because the fluorescence from the protein (AC-HSA and HSA) is found to decrease with red shift, from 0 to 6 M Gdn·HCl (Fig. 2), indicative of unfolding. Because of the very low fluorescence quantum yield of AC in buffer, it is difficult to investigate its hydration dynamics under the present experimental conditions. However, PD in buffer showed substantial quantum yield, making it possible to study as probe in bulk water. Both AC and PD are very similar in structure and show identical emission maxima in water (525 nm). Further, it is noteworthy that the hydration is essentially independent of structural details of the fluorophore (ref. 7 and references therein).
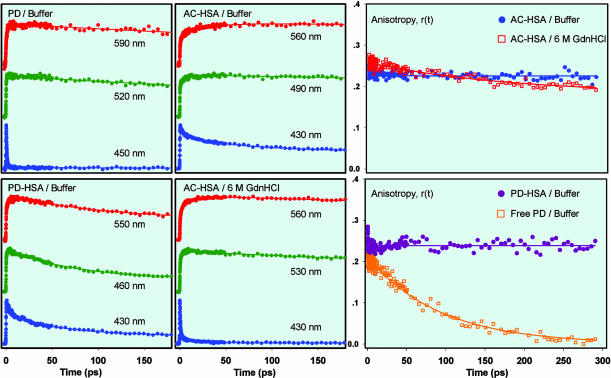
Femtosecond-Resolved Anisotropy. To attribute the observed spectral relaxation to the water dipolar reorientation, the contribution from the rotational diffusion of the probe and/or the protein should be examined. We measured the r(t) of the probe bound to HSA in buffer and in Gdn·HCl and of the free probe in buffer (Fig. 3). There is practically no decay observed in the r(t) of AC-HSA and PD-HSA in buffer and in Gdn·HCl, up to 300 ps, indicating that the probe is sterically restricted within the protein matrix and that the conformational changes of the protein are negligible. The r(t) of PD in buffer is observed to be nearly single exponential with a rotational correlation time of ≈100 ps. The change in r(t) at the earliest times is not the concern of this study.
Fig. 3.
Femtosecond-resolved fluorescence and anisotropy decays. (Left) Femtosecond-resolved fluorescence decays at three characteristic wavelengths for free PD in buffer, AC-HSA in buffer, PD-HSA in buffer, and AC-HSA in 6 M Gdn·HCl. Many other transients were similarly obtained at other wavelengths. (Right) r(t) at near emission maxima, for AC-HSA in buffer (490 nm), in 6 M Gdn·HCl (530 nm), PD-HSA in buffer (460 nm), and free PD in buffer (520 nm). The excitation wavelength was 360 nm.
Femtosecond-Resolved Hydration Dynamics. Free PD in buffer. Three representative femtosecond-resolved fluorescence up-conversion transients of PD in buffer, spanning the blue edge (450 nm), peak (520 nm), and red edge (590 m) of the emission spectrum are shown in Fig. 3. On the blue edge, the signal is seen to decay (≈0.6 ps), whereas on the red edge it rises on a similar time scale (≈1 ps) indicative of solvent relaxation.
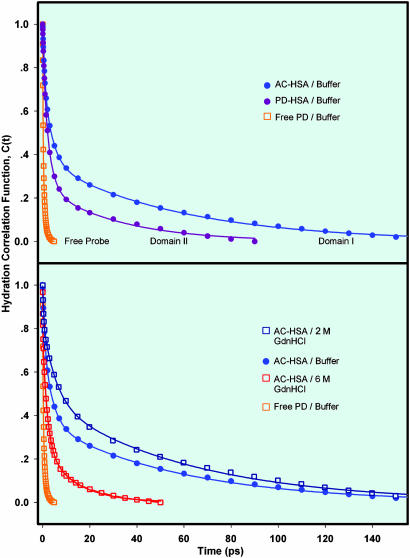
From this and other (data not shown) families of transients, we constructed the time-resolved emission spectra and C(t) (Fig. 4). The overall spectral shift is 2,313 cm–1. The C(t) shows an apparent biexponential decay with time constants of 130 (47%) and 770 fs (53%); any sub-100-fs component in the dynamics would be unresolved. This behavior is typical of hydration of molecular probe in bulk water (ref. 7 and references therein). The observed rotational correlation time (≈100 ps) is much longer than the time scales of hydration.
Fig. 4.
Time-resolved hydration correlation functions. (Upper) C(t) of AC-HSA in buffer, PD-HSA in buffer, and free PD in buffer. (Lower) C(t) of AC-HSA in 2 M Gdn·HCl and 6 M Gdn·HCl. C(t) of AC-HSA and free PD in buffer are presented for comparison (see text).
AC-HSA and PD-HSA in buffer. The characteristic transients at three wavelengths for AC-HSA and PD-HSA are shown in Fig. 3. On the blue edge, the signal is seen to decay, whereas on the red edge it rises. The net spectral shift is 1,680 cm–1 for AC-HSA and 916 cm–1 for PD-HSA, consistent with the behavior depicted in Fig. 2. For AC-HSA, the spectral evolution with respect to steady-state is 78% complete at 180 ps and 81% complete at 300 ps. The C(t), as shown in Fig. 4, is a sum of three exponentials, with the time constants of 710 fs (23%), 3.7 ps (41%), and 57 ps (36%), up to 180 ps. Spectral relaxation extending to longer times has contributing factors from variation in the relative population of multiple emitting states of distinct emission maxima (8), and/or amino acid dipolar reorientation. The decay-associated spectra that we constructed (data not shown) from the reported two lifetimes and their amplitudes at various emission wavelengths of AC-HSA (29) indicate negligible contribution of the shorter lifetime component to the steady-state spectrum. Reported spectral relaxation study of AC-HSA in the nanosecond range showed two time constants of 1.4 and 13.7 ns attributed to amino acid dipolar reorientation (29), which explains the observed slow relaxing tail of the C(t).
For PD-HSA, the spectral evolution reached steady state, well within 90 ps, indicating the near absence of protein dipolar reorientation, which may be because of the relatively hydrophobic environment of the PD binding site as compared with the AC binding site, consistent with their emission maxima. The C(t), as shown in Fig. 4, for PD-HSA is a sum of three exponentials, with the time constants of 780 fs (19%), 2.6 ps (56%), and 32 ps (25%); any sub-100-fs components in these dynamics are unresolved. During the hydration time, the rotational motions of the bound probe molecule and the protein are negligible (Fig. 3).
AC-HSA in Gdn·HCl. The characteristic transients at three wavelengths for AC-HSA in 6 M Gdn·HCl are shown in Fig. 3. Gdn·HCl has a denaturing effect on the protein (discussed below). The C(t), as shown in Fig. 4, is a sum of three exponentials, with the time constants of 280 fs (16%), 5.4 ps (36%), and 61 ps (48%) for AC-HSA in 2 M Gdn·HCl and 120 fs (20%), 2.0 ps (55%), and 13.5 ps (25%) in 6 M Gdn·HCl, up to 180 ps; any sub-100-fs components in these dynamics are unresolved. Addition of Gdn·HCl did not bring any significant change in the rotational motions of both the bound probe and the protein within the experimental time window (Fig. 3).
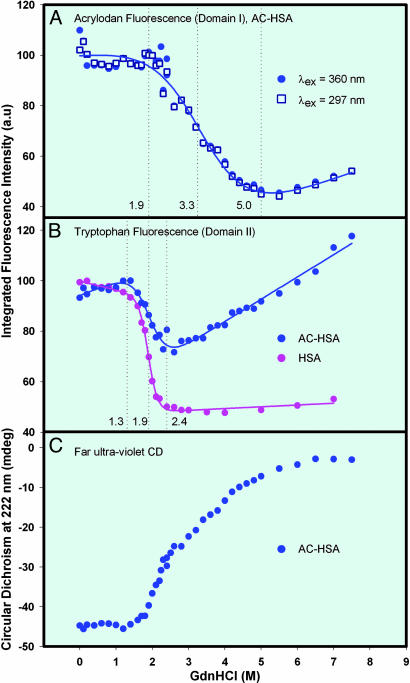
Protein unfolding. Unfolding behavior of HSA was examined by chemical denaturation with Gdn·HCl. The changes in the steady-state fluorescence were monitored as a function of Gdn·HCl concentration for AC in AC-HSA for the unfolding of domain I and Trp-214 in both HSA and AC-HSA for the unfolding of domain II. Gdn·HCl dependence of the integrated area under the AC fluorescence spectrum of AC-HSA at λex = 360 nm is shown in Fig. 5A (solid circles). Initially there is a preunfolding baseline with no major changes in both the intensity and peak wavelength up to 2 M Gdn·HCl (Figs. 2 and 5A). This finding indicates that the domain I is intact up to 2 M Gdn·HCl. The unfolding transition occurs between 2 and 5 M Gdn·HCl with a large change in both the intensity (50%) and peak wavelength (490–534 nm) (Figs. 2 and 5A). The decrease in the fluorescence intensity and the red shift of the emission maximum are in accordance with the probe being exposed to water as a result of unfolding. The postunfolding baseline starts >5 M Gdn·HCl where the fluorescence intensity and emission maximum experiences no major changes, indicating that the domain I is completely unfolded at these Gdn·HCl concentrations. An identical unfolding profile for the AC emission is obtained when λex = 297 nm (Fig. 5A, open squares). At this excitation wavelength, through Förster's resonance energy transfer mechanism (18, 32), Trp-214 fluorescence (300–400 nm) is quenched by AC, which emits at longer wavelengths (400–650 nm). The complete overlap of the two unfolding curves indicates that the changes in the AC fluorescence caused by changes in the Trp-214 fluorescence (accompanied by the unfolding of domain II; see below), are negligibly small, owing to the very low quantum yield of Trp-214 (≈30-fold) compared with AC.
Fig. 5.
Protein unfolding. (A) Gdn·HCl induced unfolding curves of AC-HSA monitored by integrated AC fluorescence intensity at λex = 360 nm (emission in the range of 403 to 648 nm) and 297 nm (emission in the range of 415 to 585 nm). (B) Gdn·HCl induced unfolding curves of unlabeled HSA and AC-HSA monitored by integrated tryptophan fluorescence intensity (emission in the range of 305 to 450 nm for HSA and 305 to 390 nm for AC-HSA) at λex = 297 nm. In all cases, the intensity at 0 M Gdn·HCl is taken as 100%. The AC emission at λex = 297 nm is ≈2-fold lower than that at λex = 360 nm at all Gdn·HCl concentrations and the Trp-214 emission of AC-HSA is 5-fold lower than that of HSA at all Gdn·HCl concentrations. The fit to the data points is according to the nonlinear least-squares equation given in ref. 44. The trend observed in the fluorescence of free probes at different Gdn·HCl concentrations does not change the interpretation of our unfolding data since the fluorescence of free probe molecules tends to increase, not decrease, with no significant shift of spectra (see text). (C) Gdn·HCl induced unfolding curve of AC-HSA (2 μM) monitored by CD at 222 nm. Path length of the cell was 2 mm.
Gdn·HCl dependence of the integrated area under the tryptophan fluorescence spectrum (Raman corrected) of HSA and AC-HSA are shown in Fig. 5B. The preunfolding baseline is up to 1.3 M Gdn·HCl with very little change in both the intensity (<10%) and peak wavelength (1-nm blue shift from 339 nm), indicating the intactness of domain II. This small intensity change is in the increasing direction for the case of AC-HSA and caused by the slight relief in the quenching of Trp-214 from AC due to the initial interdomain (I and II) separation, as has been discussed by Flora et al. (18). The unfolding transition occurs between 1.3 and 2.4 M Gdn·HCl with a 50% intensity decrease for HSA and 30% decrease for AC-HSA. In the postunfolded baseline (>2.4 M Gdn·HCl), the intensity does not change for HSA, but increases by 50% for AC-HSA and is caused by the strong relief in the quenching from AC, when domain I unfolds.
Taken together, these results indicate that, at Gdn·HCl concentrations of 2 M, domain I is intact with >50% of domain II unfolded, suggesting the formation of an intermediate state. This finding further indicates that the stabilization energy of domain I is higher than that of domain II.
Gdn·HCl dependence of the CD at 222 nm of AC-HSA is shown in Fig. 5C. Far UV CD (178–260 nm) of a protein conforms to its secondary structure, and the value at 222 nm is signature of its α-helical content (33). HSA contains ≈68% α-helix (and no β-sheet) with 32% contribution from domain I, 34% from domain II, and 34% from domain III (11, 12). Fig. 5C shows that the protein has intact helical content up to 1.3 M Gdn·HCl. The loss of α-helical content at 2 and 6 M Gdn·HCl are 19% and 97%, respectively, indicating loss of secondary structure as a result of unfolding. The value at 2 M is consistent with the unfolding of >50% of domain II, as depicted in Fig. 5B, with the rest of the protein structure remaining essentially intact. The near absence of α-helical content at 6 M Gdn·HCl indicates complete unfolding of HSA. Thus, CD studies corroborate with the fluorescence studies. Further, up to 2.4 M Gdn·HCl concentration, CD data show a sharp transition with loss of 40% of the total α-helix, consistent with a highly cooperative, predominant unfolding of domain II as depicted in Fig. 5B. Above 2.4 M Gdn·HCl, the transition proceeds with poor cooperativity, indicating the involvement of many intermediate states, whose concentration build-ups are too small to be detected as separate transitions (1, 34).
Discussion
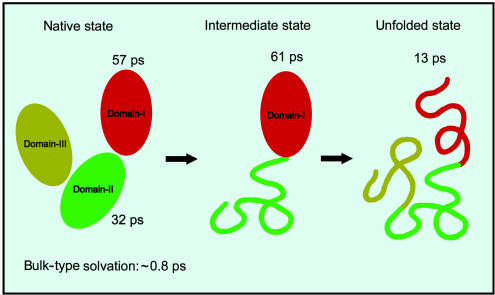
Summarizing the observations of hydration dynamics and unfolding studies we can make the following points: (i) The surface hydration behavior of the two domains of HSA differ from the hydration of free probe. (ii) Three time scales of hydration are obtained for domains I and II in buffer, two ultrafast time scales with τ1 close to 1 ps, and τ2 close to 3 ps, and one slower time (τ3) in the range of 30 to 60 ps, reflecting the presence of two types of water, bulk type (labile water) and surface-bound type (ordered water). (iii) Domain I of HSA has higher stabilization energy than domain II (from unfolding studies) and the time scale describing the ordered water (τ3) around domain I (57 ps, 36%) is ≈2-fold longer than that around domain II (32 ps, 25%). (iv) Unfolding of HSA is a multistep process. The intermediate state at 2 M Gdn·HCl is characterized by intact domain I and unfolded domain II. The dynamics of ordered water around domain I is nearly unchanged in 2 M Gdn·HCl (61 ps, 48%). (v) HSA is completely unfolded at 6 M Gdn·HCl, and a faster time scale (13 ps, 25%) is obtained for τ3. Note that the time scales for hydration (“residence times”) are not necessarily reflected in the magnitude of the steady-state Stokes shift, because the latter represents the integrated influence of dipole stabilization, whereas the former is the rate of hydrogen bond breakage (ref. 7 and references therein and ref. 8). Also, note that solvation by residues could contribute to the static Stokes shift, but for the dynamic Stokes shifts, the time scale of hydration is different from that of residue motion. This description is supported by the effect of unfolding on hydration (Fig. 6) reported here (see also discussion in ref. 7).
Fig. 6.
Schematic representing the native, intermediate, and unfolded states of HSA, with the time constants of ultrafast hydration dynamics indicated. The intermediate is characterized by intact domain I and unfolded domain II.
For domains I and II of HSA, the slow component of hydration (τ3) is 2 orders of magnitude different from bulk-type solvation and is characteristic of protein hydration, as has been discussed (ref. 7 and references therein). The τ3 values of 57 ps (36%) for domain I and 32 ps (25%) for domain II of HSA for the “ordered water” are in line with those observed for subtilisin Carlsberg (38 ps) (35), monellin (16 ps) (25), and α-chymotrypsin (28 ps) (36) in buffer at near neutral pH. The present study is especially unique for two reasons. First, it reports on hydration of different domains with distinct stabilities in the same protein. Second, the study attempts to correlate the behavior of surface water with protein folding and unfolding.
Our observation of a longer time scale of τ3 for the relatively stable domain I as compared with domain II suggests that the surface water molecules in domain I are ordered and strongly bound. It is noteworthy that τ1 and τ2 are similar for both domains. The observation of relatively strong bound water with larger contribution (37), for more stable domain I over domain II, suggests that the hydrophilic residues of domain I are comparatively more solvent exposed (including those that are strongly charged and hence can have stronger hydrogen bonds with water). In the literature there exist several models describing the driving force for folding/unfolding, and these include the “hydrophobic model” (burial of hydrophobic residues; dominant entropic contribution) (2, 38), “packing model” (burial of both hydrophobic and hydrophilic residues; enthalpic and entropic contribution) (39–41), and the “burial gap model” (burial of hydrophobic residues and unburial of hydrophilic residues, dominant entropic contribution) (42). The differences are based on the change in the structure of water around hydrophobic and hydrophilic residues in the unfolded states and the entropic and enthalpic changes that occur upon folding. Our results indicate that hydrophilic residues are unburied and optimize the interaction with water, as evidenced in the increased degree of order at the surface. The shortening of τ3 from 60 to 13 ps upon unfolding reflects the “dilution” of charge distribution by exposed hydrophobic residues, which occupy ≈50% of the total residues in random-coiled polypeptide chains. Flexibility of the chains and their many possible conformations also contribute to the shorter hydration time in the unfolded state.
For the intermediate state (intact domain I and unfolded domain II), the nearly unchanged hydration time of 61 ps, compared with that of the native state (57 ps), suggests that the intactness of structure is strongly correlated to the integrity of solvation. The value of τ3 is not expected to be greatly influenced by the added Gdn·HCl salt, because the hydration layer of the intact regions of the protein avoid contact with Gdn·HCl to keep their integrity. However, some change is expected because of the slower rate of “feedback process” of the far-removed bulk water (37). As noted above, in 6 M Gdn·HCl, a significantly shorter time constant (13 ps) was obtained, and the ultrafast components (τ1 and τ2) dominate the decay by ≈75%, suggesting that water is now less ordered and weakly bound. It should be noted that hydration of Trp in bulk water with Gdn·HCl (0 and 6 M) leads to some change in C(t) decay (τ1 changed from 0.2 to 0.6 ps and τ2 changed from 1.1 to 4.4 ps) (25, 35), but it is still much shorter than τ3.
The residence times discussed above are significant to protein stability, flexibility, and function. From the study of unfolding, domain I is more stable than domain II and is associated with a longer residence time of the dynamically ordered water, as discussed above. This longer water residence time may aid kinetic trapping of the protein in the native state, assuming that local motion on the energy landscape is correlated with water dynamics. As for the function, it is reported that the principal substrate binding regions on HSA are located in domains II and III (11, 12), suggesting that the less active domain I contributes significantly to protein stability, whereas the less stable domain II contributes to protein function. There is a tradeoff between stability and activity of domains I and II of HSA. From the perspective of ultrafast hydration dynamics, the longer residence time of surface water in domain I may increase the effective rigidity and reduce its conformational flexibility, which contributes to the lower activity, since protein fluctuations modulate the entry of bulky substrates to the binding site(s). As discussed in ref. 7 and references therein and refs. 36 and 43, the time scale for molecular recognition should be longer than that of bulk water, but less than that of “rigid ice” for it to act as an effective lubricant.
Acknowledgments
This work was supported by the National Science Foundation.
Abbreviations: HSA, human serum albumin; Gdn·HCl, guanidine hydrochloride; AC, acrylodan (6-acryloyl-2-(dimethylamino)naphthalene); PD, prodan (6-propionyl-2-(dimethylamino)naphthalene; λex, excitation wavelength; r(t), time-resolved anisotropy; C(t), time-resolved hydration correlation function.
References
- 1.Fersht, A. (1999) Enzyme Structure and Mechanism (Freeman, New York).
- 2.Dill, K. A. (1990) Biochemistry 29, 7133–7155. [DOI] [PubMed] [Google Scholar]
- 3.Huang, D. M. & Chandler, D. (2000) Proc. Natl. Acad. Sci. USA 97, 8324–8327. [DOI] [PMC free article] [PubMed] [Google Scholar]
- 4.Lum, K., Chandler, D. & Weeks, J. D. (1999) J. Phys. Chem. B 103, 4570–4577. [Google Scholar]
- 5.Lazaridis, T. & Karplus, M. (2003) Biophys. Chem. 100, 367–395. [DOI] [PubMed] [Google Scholar]
- 6.Onuchic, J. N. & Wolynes, P. G. (2004) Curr. Opin. Struct. Biol. 14, 70–75. [DOI] [PubMed] [Google Scholar]
- 7.Pal, S. K. & Zewail, A. H. (2004) Chem. Rev. 104, 2099–2124. [DOI] [PubMed] [Google Scholar]
- 8.Lu, W., Kim, J., Qiu, W. & Zhong, D. P. (2004) Chem. Phys. Lett. 388, 122–126. [Google Scholar]
- 9.Zhong, D. P., Douhal, A. & Zewail, A. H. (2000) Proc. Natl. Acad. Sci. USA 97, 14056–14061. [DOI] [PMC free article] [PubMed] [Google Scholar]
- 10.Peters, T. (1996) All About Albumin: Biochemistry, Genetics, and Medical Applications (Academic, San Diego).
- 11.He, X. M. & Carter, D. C. (1992) Nature 358, 209–215. [DOI] [PubMed] [Google Scholar]
- 12.Sugio, S., Kashima, A., Mochizuki, S., Noda, M. & Kobayashi, K. (1999) Protein Eng. 12, 439–446. [DOI] [PubMed] [Google Scholar]
- 13.Wallevik, K. (1973) J. Biol. Chem. 248, 2650–2655. [PubMed] [Google Scholar]
- 14.Chmelik, J., Anzenbacher, P. & Chmelikova, J. (1988) Collect. Czech. Chem. Commun. 53, 411–422. [Google Scholar]
- 15.Tayyab, S., Siddiqui, M. U. & Ahmad, N. (1995) Biochem. Ed. 23, 162–164. [Google Scholar]
- 16.Muzammil, S., Kumar, Y. & Tayyab, S. (2000) Proteins 40, 29–38. [DOI] [PubMed] [Google Scholar]
- 17.Krishnakumar, S. S. & Panda, D. (2002) Biochemistry 41, 7443–7452. [DOI] [PubMed] [Google Scholar]
- 18.Flora, K., Brennan, J. D., Baker, G. A., Doody, M. A. & Bright, F. V. (1998) Biophys. J. 75, 1084–1096. [DOI] [PMC free article] [PubMed] [Google Scholar]
- 19.Prendergast, F. G., Meyer, M., Carlson, G. L., Iida, S. & Potter, J. D. (1983) J. Biol. Chem. 258, 7541–7544. [PubMed] [Google Scholar]
- 20.Weber, G. & Farris, F. J. (1979) Biochemistry 18, 3075–3078. [DOI] [PubMed] [Google Scholar]
- 21.Moreno, F., Cortijo, M. & Gonzáles-Jiménez, J. (1999) Photochem. Photobiol. 70, 695–700. [PubMed] [Google Scholar]
- 22.Petitpas, I., Bhattacharya, A. A., Twine, S., East, M. & Curry, S. (2001) J. Biol. Chem. 276, 22804–22809. [DOI] [PubMed] [Google Scholar]
- 23.Moreno, F., Cortijo, M. & Gonzáles-Jiménez, J. (1999) Photochem. Photobiol. 69, 8–15. [PubMed] [Google Scholar]
- 24.Wang, R., Sun, S., Bekos, E. & Bright, F. (1995) Anal. Chem. 67, 149–159. [DOI] [PubMed] [Google Scholar]
- 25.Peon, J., Pal, S. K. & Zewail, A. H. (2002) Proc. Natl. Acad. Sci. USA 99, 10964–10969. [DOI] [PMC free article] [PubMed] [Google Scholar]
- 26.Narazaki, R., Maruyama, T. & Otagiri, M. (1997) Biochim. Biophys. Acta 1338, 275–281. [DOI] [PubMed] [Google Scholar]
- 27.Gonzáles-Jiménez, J. & Cortijo, M. (2002) J. Protein Chem. 21, 75–79. [DOI] [PubMed] [Google Scholar]
- 28.Lobo, B. C. & Abelt, C. J. (2003) J. Phys. Chem. A 107, 10938–10943. [Google Scholar]
- 29.Buzádi, A., Erostyák, J. & Somogyi, B. (2001) Biophys. Chem. 94, 75–85. [DOI] [PubMed] [Google Scholar]
- 30.Krasnowska, E. K., Gratton, E. & Parasassi, T. (1998) Biophys. J. 74, 1984–1993. [DOI] [PMC free article] [PubMed] [Google Scholar]
- 31.Basak, S., Debnath, D., Haque, E., Ray, S. & Chakrabarthi, A. (2001) Indian J. Biochem. Biophys. 38, 84–89. [PubMed] [Google Scholar]
- 32.Lakowicz, J. R. (1999) Principles of Fluorescence Spectroscopy (Kluwer/Plenum, New York), 2nd Ed.
- 33.Johnson, W. C. (1999) Proteins 35, 307–312. [PubMed] [Google Scholar]
- 34.Kamal, J. K. A., Nazeerunnisa, M. D. & Behere, D. V. (2002) J. Biol. Chem. 277, 40717–40721. [DOI] [PubMed] [Google Scholar]
- 35.Pal, S. K., Peon, J. & Zewail, A. H. (2002) Proc. Natl. Acad. Sci. USA 99, 1763–1768. [DOI] [PMC free article] [PubMed] [Google Scholar]
- 36.Pal, S. K., Peon, J. & Zewail, A. H. (2002) Proc. Natl. Acad. Sci. USA 99, 15297–19302. [DOI] [PMC free article] [PubMed] [Google Scholar]
- 37.Bhattacharya, S. M., Wang, Z.–G. & Zewail, A. H. (2003) J. Phys. Chem. B 107, 13218–13228. [Google Scholar]
- 38.Kauzmann, W. (1959) Adv. Protein Chem. 14, 1–63. [DOI] [PubMed] [Google Scholar]
- 39.Harpaz, Y., Gerstein, M. & Chothia, C. (1994) Structure (London) 2, 641–649. [DOI] [PubMed] [Google Scholar]
- 40.Ratnaparkhi, G. S. & Varadarajan, R. (2000) Biochemistry 39, 12365–12374. [DOI] [PubMed] [Google Scholar]
- 41.Pace, C. N. (2001) Biochemistry 40, 310–313. [DOI] [PubMed] [Google Scholar]
- 42.Zhou, H. & Zhou, Y. (2004) Proteins 54, 315–322. [DOI] [PubMed] [Google Scholar]
- 43.Zhao, L., Pal, S. K., Xia, T. & Zewail, A. H. (2004) Angew. Chem. Int. Ed. Engl. 43, 60–63. [DOI] [PubMed] [Google Scholar]
- 44.Kamal, J. K. A. & Behere, D. V. (2002) Biochemistry 41, 9034–9042. [DOI] [PubMed] [Google Scholar]


