Abstract
A key question in clarifying human–environment interactions is how dynamic complexity develops across integrative scales from molecular to population and global levels. Apart from its public health importance, measles is an excellent test bed for such an analysis. Simple mechanistic models have successfully illuminated measles dynamics at the city and country levels, revealing seasonal forcing of transmission as a major driver of long-term epidemic behavior. Seasonal forcing ties closely to patterns of school aggregation at the individual and community levels, but there are few explicit estimates of school transmission due to the relative lack of epidemic data at this scale. Here, we use data from a 1904 measles outbreak in schools in Woolwich, London, coupled with a stochastic Susceptible-Infected-Recovered model to analyze measles incidence data. Our results indicate that transmission within schools and age classes is higher than previous population-level serological data would suggest. This analysis sheds quantitative light on the role of school-aged children in measles cross-scale dynamics, as we illustrate with references to the contemporary vaccination landscape.
Keywords: cross-scale dynamics, measles, mathematical model, childhood infection, vaccine refusal
The dynamics of measles are a paradigm for the emergence of algorithmically simple (albeit often dynamically complex) host–natural enemy cycles (1). At the most predictable scales, the Susceptible-Infected-Recovered (SIR) family of models has been used to analyze measles dynamics in city and country metapopulations (1–4), as well as in allowing for heterogeneities in space (5, 6), age (7, 8), and population sizes (9, 10). As a badge of simplicity, SIR models successfully assume well-mixed mass action in city populations (i.e., that the number of individuals who will become infected is proportional to the total number currently infected as well as those currently susceptible). Mass-action assumptions can use a simple constant contact rate or use a complex time-varying contact function to capture seasonality.
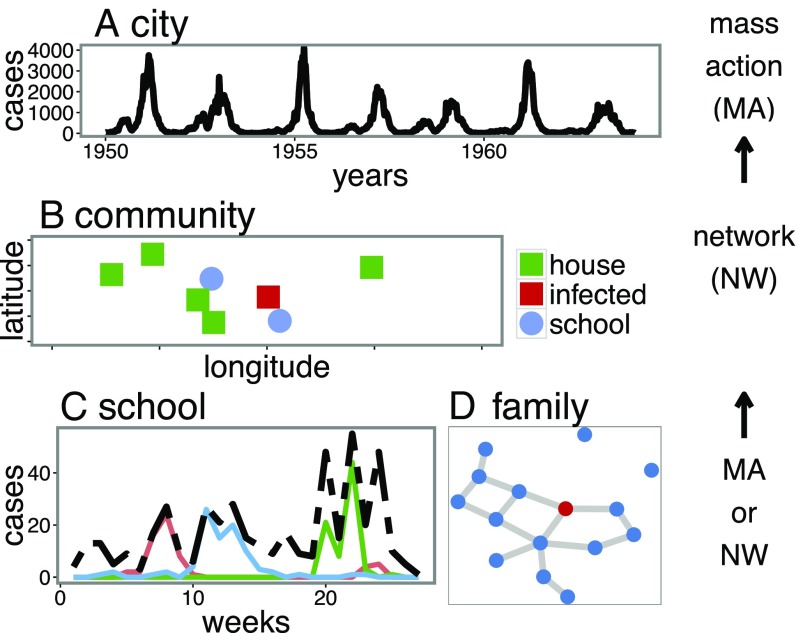
The time dependency (or lack thereof) of the contact rate is determined by the temporal scale of the data. For example, prevaccination measles is characterized by strong multiennial (1) epidemics (Fig. 1A; reported case counts from London) that were driven by the increased seasonal contact rate between children during the school term (7, 11, 12). The contact rate is in the numerator of expressions for the basic reproductive ratio , which measures the number of secondary cases per infected individual in a fully susceptible population. This measure informs various quantities important for public health such as timing of epidemic peaks and what proportion of the population must be vaccinated to prevent an outbreak (13). estimates for measles are frequently reported as being between 7 and 18 (13, 14), consistent with an average age at first infection of 4 to 10 y. However, because serology is generally reported in broad age bands, it may smooth out the sharpness of school epidemics, as reflected in ref. 15. Recent studies have argued that higher values ( = 30 to 57) inferred from time-series data reflect transmission within schools rather than the actual population-level average (4, 14, 16), underscoring the importance of school-age children in a population-level outbreak.
Fig. 1.
This figure shows a schematic of the chain of cross-scale transmission dynamics of measles as well as the methods used to analyze them (mass action or network models). (A) The city-level data of a large city (London), where the dynamics are smooth and regular. (B) Possible community-level dynamics (simulated data) where spatial coupling between schools and households is important. (C) Three school-level outbreaks (pink, blue, and green; data from Woolwich) as well the aggregate (black), demonstrating the more violent underside of the population and community-level outbreaks. (D) A potential family network model where the blue dot indicates susceptible individuals and the red indicates infected.
The cross-scale dynamics of measles are summarized schematically in Fig. 1. We see more complexities, and often violent “superspreader” dynamics, emerge at the underlying micro scales of schools and families (e.g., Fig. 1 C and D). Fig. 1C (data from Woolwich, London analyzed in this paper) shows outbreaks from three schools (colored lines), which combine into a highly stochastic school-level time series (dashed black). Fig. 1D schematically illustrates family-to-family transmission, which can connect school epidemics. These micro outbreaks can be explored using both mass-action and network models (17). The school and family outbreaks scale up to local community level (Fig. 1B); these outbreaks have traditionally been studied with network models (17). However, few studies have examined the transmission hotspots that add up to the “emergent simplicity” of the population-level dynamics.
One notable exception is the exquisitely detailed dataset from an 1861 measles outbreak in Hagelloch, Germany, during which all 188 susceptible children in the village became infected. With fine-grain information such as family units, house location, and which classroom each child was in recorded, the Hagelloch outbreak has been extensively studied using network models, and has been estimated to be in the range of 6 to 19 (17–19). However, 1861 Hagelloch was a small population, bearing little resemblance to a city such as London. It is therefore difficult to extrapolate the Hagelloch transmission in the context of school outbreaks in a large city. Additionally, there were only two school epidemics in Hagelloch, so there are no estimates of variability (20).
Schools act as measles transmission hotspots, and such deviations from the average are especially important, as noted in the work of Lloyd-Smith et al. (20) on superspreading. Unfortunately, measles outbreaks in schools are not a relic of the prevaccination era (21). Although vaccine coverage in most US schools is high, vaccine refusal and personal belief exemptions trends are increasing (22, 23), leading to considerable variability in vaccination rates (21, 24), and measles susceptibility rates in some US kindergartens are below the critical coverage (25). In this paper, we aim to illuminate the dynamics of school-based measles transmission by analyzing detailed data from a 1904 measles outbreak across several schools in Woolwich, London. First, we present the data and difficulties associated with fitting school-level incidence data for measles. We then fit a stochastic SIR model to the data to estimate transmission in schools and age classes. We then discuss the role of school children in city-level estimates. Finally, we investigate the implications of our findings for recently reported heterogeneities in California school vaccination rates as an example of the transmissibility that could be observed in schools in other states with variable vaccination coverage. We conclude by discussing the general implication of these results for cross-scale dynamics in epidemiology and ecology.
Results
Measles in 1904.
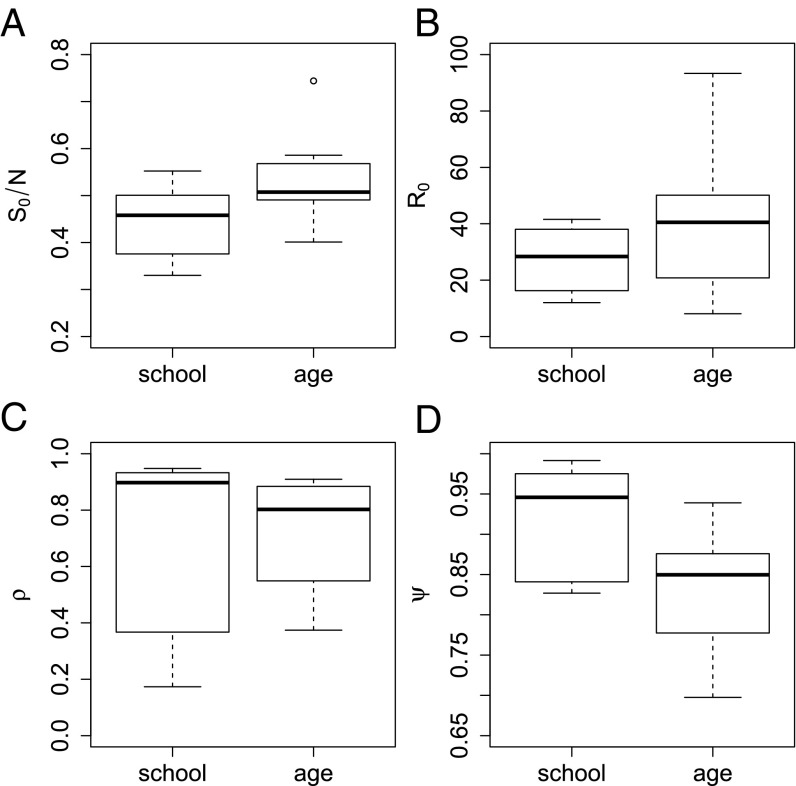
For the school-level data we estimate an average = 27 with range (12, 42), an average reporting ratio = 70% with range (17%, 95%), and an average dispersion of the negative binomial = 0.92 with range (0.83, 0.99). The age-class data show similar, although reduced, transmission variability, with an average = 40 and a range of (8, 93). The average estimated reporting rate is = 72% with a range of (37%, 91%) and the average dispersion of the negative binomial was estimated to be 0.83 with range (0.70, 0.94). These results are shown in Fig. 2 B–D). The number of time series used for the school level was n = 6, and n = 12 for the age level. For both datasets the high dispersion estimates indicate a high degree of variability in the reporting rates.
Fig. 2.
Differences in the school and age data and results. (A) Overall susceptibility at the school level and age level for the datasets we perform inference on. (B) Overall estimated reproductive ratio . (C) Overall estimated reporting rate . (D) Overall estimated dispersion rate .
For , , and we run t tests to determine how different the estimates for the school versus the age groups are based on the means. No t test results came out statistically significant except for the estimates (P = 0.02581). We did not detect a significant difference in the means of the and estimates for schools versus age classes. However, differences in the dispersion parameter indicate there may be variability in underreporting in schools and age classes.
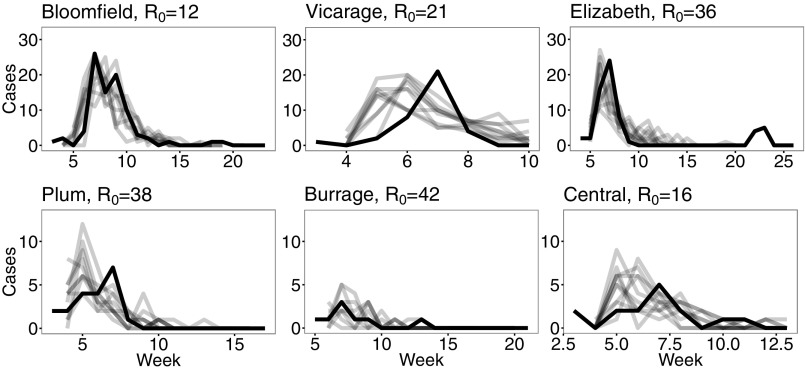
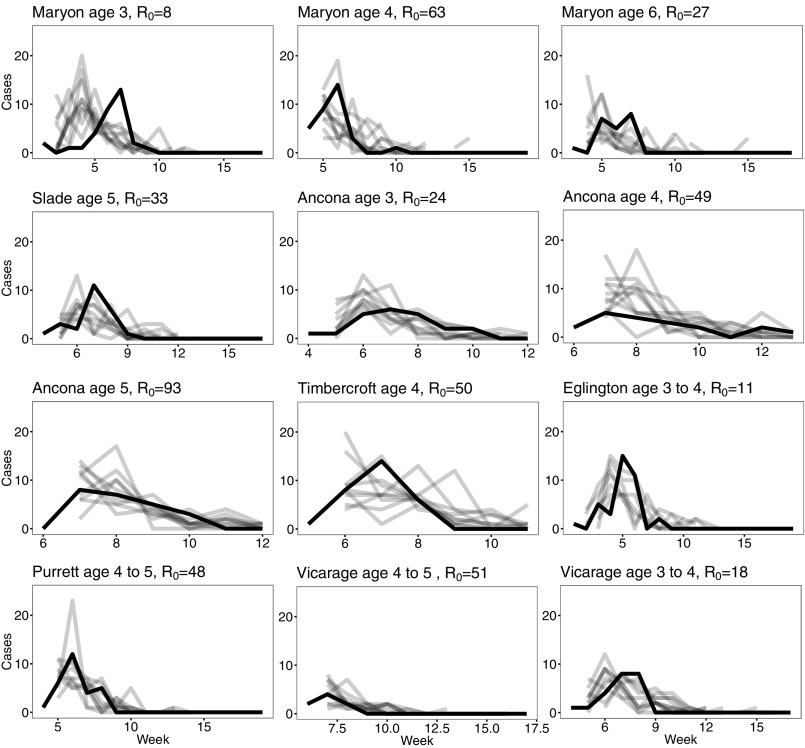
Resimulating the model using the estimated parameters yields generally close fits (using as a simple estimate) to the data, as seen in Figs. 3 and 4. For the school data, the adjusted range is 0.3 to 0.87, with all P values statistically significant with the exception of Vicarage Road. For the age data, the adjusted range is 0.076 to 0.94, with all P values statistically significant with the exception of Maryon Park, age 3. If that exception is removed, the adjusted range increases to 0.37 to 0.94. There was no clear trend between estimates and school size or age class. These results can be seen in Supporting Information.
Fig. 3.
Inputting the inferred parameters back into the stochastic SIR model yields relatively close fits (gray) to the data (black) for the school level. Here we show 10 randomly chosen simulations against the data. Note that the vertical scales are different and names have been slightly abbreviated.
Fig. 4.
Fig. 4 is equivalent to Fig. 3 but for the age-class data.
Measles in 2016.
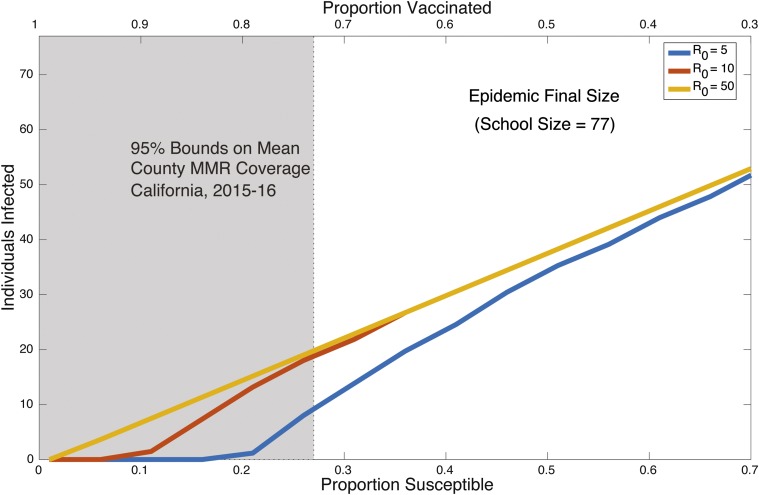
Our results and estimates showcase the potential effects of a lowered vaccine coverage. Fig. 5 shows the range of potential outbreak final sizes for varying vaccination coverage levels using values consistent with those found in this study. The lowest value, 5, is used to take into account potential control measures. Predicted outbreak sizes are in the range of 10 to over 50 cases for a school size of 77, reflecting an average across over 7,000 kindergartens in California (25). Many individual schools in California have been below the critical vaccination threshold for measles, indicating a large risk (21, 24, 25). Mean up-to-date coverage in 2015–2016 in California kindergartens was 93% with a 5 to 95 percentile range of 73 to 100% and minimum and maximum coverage levels of 5 to 100% (25). The shaded region in Fig. 5 indicates this 5 to 95 percentile range, although it does not include the over 300 schools whose coverage is below the fifth percentile, and whose average coverage level is just over 55% (25). Here we assume 100% vaccine efficacy. These results indicate the possibility of very large outbreaks building in the postvaccine era.
Fig. 5.
A simulation showing the variation in outbreak final size for a range of values over increasing proportion susceptible/decreasing proportion vaccinated. The shaded region indicates a 95% range of MMR (measles, mumps, and rubella) vaccination coverage in schools in California, demonstrating that the risk of outbreaks is still present in the postvaccination era (26).
Discussion
Understanding the processes that underlie large-scale dynamics of a complex, multilevel system can lend valuable insight into the transition of complexity across scales (27). Here, this transition refers to how large-scale aggregation of incidence data can produce relatively predictable patterns. Seasonal forcing determined by the school calendar is known to be an important driver of measles dynamics. Here, we underpin this phenomenon with direct analysis of school-level data, demonstrating very high prevaccination transmission within schools and age classes. Our results highlight differences in age-specific transmission, thus demonstrating the importance of school transmission hotspots (15). Recalling that traditional population-level estimates of values are between 7 and 18 (13, 14), we confirm hypotheses that higher estimates based on time-series data are effectively picking up transmission within the schools. On the low end of the school and age estimates, our values are similar to those from the Hagelloch dataset. However, the Hagelloch was derived from the community-level data, whereas the Hagelloch classroom data show a much faster spread of infection, which would support a higher , in line with the results presented in this paper.
Although an of 93 is extremely high, written accounts of these outbreaks may support even higher values. In a 1905 measles report on the Education Committee of the London County Council, Dr. Kerr reports an incident in which a Woolwich child of 5 y “in spite of prompt and energetic measures, may be said to have caused at least 207 known cases in four schools” (28). However, it is not completely clear whether this account refers to direct transmission or the child’s transmission tree (28). Furthermore, this is in line with the famous 1951 Greenland epidemic in which one person infected over 200 others (29). The Greenland epidemic was used in Lloyd-Smith et al.’s (20) important study of epidemic superspreaders. Looking at transmission variability, Lloyd-Smith et al. (20) estimated the negative binomial dispersion for variability parameter, k, as <0.1 for measles. In this context, a small k indicates a high degree of transmission variability where superspreaders drive the majority of the outbreak. Using the distribution of the 18 inferred , we calculate k = 1.3 via a moment estimate, indicating less transmission variability than the Lloyd-Smith et al. (20) estimate. However, here we are fitting the upper tail of transmission of the epidemic size range, so our results are likely to underestimate overdispersion. Our estimated reporting rates are slightly higher than previous estimates such as 51% in ref. 1 and 13–78% in ref. 4, which may be due to the attention given to documenting the 1904 outbreaks.
Applying the low end of the school transmission to the current vaccine landscape in California schools yields an unsettling implication for outbreaks (Fig. 5). In some cases, vaccination coverage may be underestimated, because children with nonmedical vaccine exemptions often do not have their true vaccination status assessed (30). Individual school vaccination coverage levels may be slightly higher than reports indicate; ref. 30 estimates that 10–50% of children with personal belief exemptions (PBEs) may actually have received a full MMR vaccination course, so Fig. 5 may be conservatively pessimistic. Nonetheless, even if 50% of children with PBEs are covered, coverage in many schools would still be well below the herd immunity threshold for measles. If a measles outbreak were to occur in just one or a few of the low-coverage schools, the resulting epidemic final sizes could approach annual numbers of measles cases reported in the United States (ranging from 50 to 700 between 2010 and 2015) (31). Effectively, herd immunity for measles really is a measure of whether measles can be kept out of the school, and limitation of establishment of endemicity. Once measles is in a school, it will find and infect susceptible individuals with great efficiency.
Our study, and the data themselves, have a number of limitations. First, within our school population we assume homogeneous mixing, although some studies have suggested that even within school-age children contact is not constant (32). Second, in our model we do not account for time-dependent imported infections, which may account for a number of school-level outbreaks. In a similar vein, we do not consider the role of family and siblings in our study. In the same Education Committee of the London County Council report, Dr. Kerr states that infection may have been spread between age classes because older children often walked younger students home (28). Additionally, these import infections may help to explain the appearance of noise in our datasets that rendered a significant number of the time series unusable under our well-mixed assumption—indicating that perhaps a network or spatial compartmental model could be of use in future analysis of this dataset. We also assume that contemporary California schools resemble early 20th-century London schools in ways that are important for measles transmission (i.e., class sizes and homogeneous transmission within the age classes and schools). Additionally, we only applied the low end of the London estimates to modern California, even using to account for control measures. However, even with these limitations in mind, our study yields valuable insight into past and current measles dynamics in a previously understudied subpopulation.
In summary, we have provided the most detailed and reporting rate estimates for within school and age classes based on time-series outbreak data. These estimates confirm beliefs that high city-level estimates are driven by school-aged children. Applying these results to the postvaccine landscape demonstrates the need for increased vaccine uptake in school-aged children in certain California schools.
Broader Implications and Future Work
Our results underpin a number of implications for cross-scale dynamics in human–environment interactions. First, we have demonstrated major hotspots of infection at the school level, even despite still relatively smooth “predator–prey” oscillations at the city level (1). This implies “emergent simplicity,” despite many complexities at finer scales (Fig. 1). To dissect this contradiction, we need to construct network models and the associated approximations spanning the underlying family-school-population level (Fig. 1). However, to take this analysis further, the key need here (as in all cross-scale dynamics) is acquiring data that record dynamics at the relevant intermediate scales. This paper is a first step for schools. An important area of future development includes the construction and analysis of community-wide network models that may further reconcile the coarse- with the fine-grain dynamics.
Materials and Methods
The Dataset and Inclusion Criteria.
To obtain prevaccination era school data we searched the Wellcome Library online archives collection “London’s Pulse: Medical Officer of Health Reports 1848–1972” (33). We found two records of interest. First, the “Annual Report of the Medical Officer of Health for Woolwich, 1904” provides an appendix (ref. 34, appendix I, p. 129) on the incidence of measles in classes, Christmas to May 1904, in 18 elementary schools of the borough of Woolwich, London. Second, the “Report of the Medical Officer of Health for London County Council, 1904” gives an appendix (ref. 35, p. 46) with detailed accounts of outbreaks of measles in 15 elementary schools of the borough of Woolwich in 1904 that partially overlaps with the Woolwich report. This report provides qualitative information on the mode of transmission between children in school versus out of school. Additionally, the documentation provides information on transmission during classes and holiday, as well as the efficiency of measures taken by school teachers to stop the spread of the measles. Both datasets reported that no students died of measles. Although daily data are reported, we use weekly incidence for our analysis because weekends serve as a natural weekly clock. In our study we break our data into two sets: (i) school-level data and (ii) epidemics disaggregated by school age class.
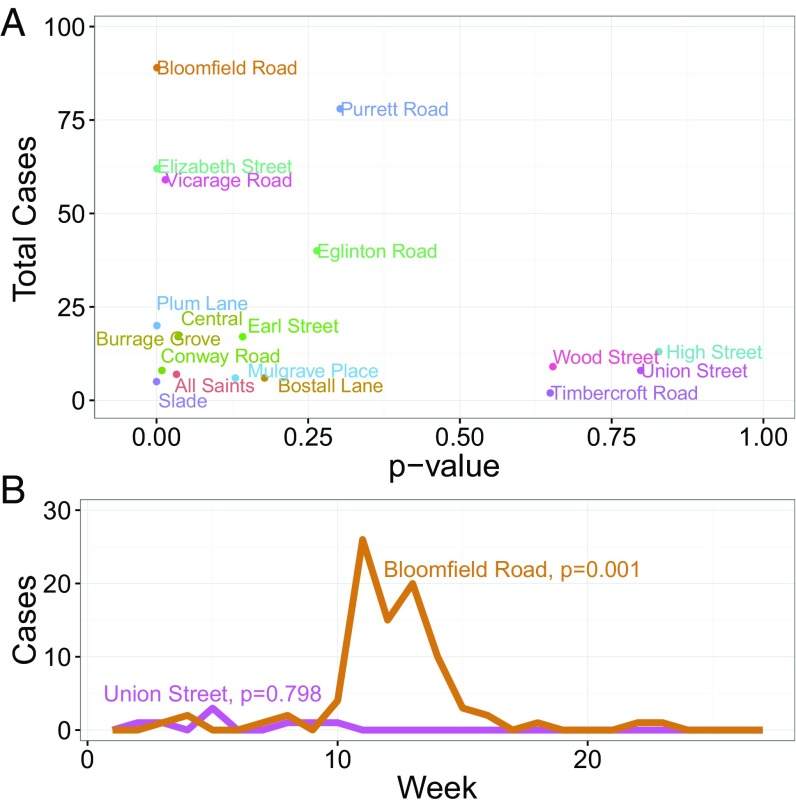
Because our time series contain multiple peaks as well as large variability in the number of reported cases, we devise selection criteria to determine which time series are suitable for statistical inference. We use two criteria: (i) the total number of cases must be greater than eight and (ii) the time series must pass the Ljung–Box test; this is a portmanteau test that looks at the overall randomness based on a set number of lags in the data. Because we assume a Markov process, we take the number of lags to be a single time step week. The Ljung–Box test assumes the null hypothesis that the data are independently distributed, thus any observed correlation is from random sampling, and the alternative hypothesis is that the data are not independently distributed (36). To reject the null hypothesis, we adopt a P value less than 0.05. In Fig. 6 we show our selection criteria for the schools dataset as well as an example of a dataset we select (Bloomfield Road), which resembles the behavior of a simple, closed SIR model, and a dataset we reject (Union Street) due to minimal cases and a more complicated epidemic pattern. Many time series have a number of zeros before the outbreak begins, so we take our start time, , for inference to be the first week in which we have nonzero cases, and then set our initial condition , where is the observed cases. Additionally, the Vicarage Road School time series is characterized by two outbreaks with 14 wk between them, indicating two completely separate events. Because the SIR with constant contact assumes a single outbreak, we only use the second outbreak to infer parameters. The first outbreak has a peak size of 9, and the second 21. We note that in Fig. 6 we have two relative outliers, Purrett Road and Eglinton Road, which we address in Supporting Information.
Fig. 6.
Selection criteria of the school outbreak data. (A) Each of the 18 schools is plotted based on its P value from the Ljung–Box white noise test and the total number of cases. The gray shading represents the time series that we estimate parameters on corresponding to P value 0.05 and at least eight reported cases. The figure for age-class data is similar using the same selection criteria. (B) A dataset we use for inference (Bloomfield Road) and one we reject (Union Street). Bloomfield Road has an extremely low Ljung–Box P value and resembles typical SIR mass-action behavior, whereas Union Street fails the Ljung–Box test and has fewer than eight reported cases.
The school sizes range between 403 and 1,631 students aged 3 to 8 y. Additionally, we have record card data for each school and class that allow us to estimate how many students previously had measles and were thus immune. Because these only represent a sample of each class size, we linearly interpolate these susceptible and recovered ratios to the whole school or class to use as our initial conditions. At the school level, average susceptibility is 45%, whereas average by age susceptibility is 53%. These percentages are calculated using an average of the time series that pass our selection criteria. The difference between these two is likely attributed to a number of the older classes, ages 7 and 8 y, having zero cases and lower susceptibility. A box plot of this difference is seen in Fig. 2A.
To obtain recent school vaccination rates we used and summarized reports of MMR vaccine and exemption status in California kindergartens reported by California Department of Public Health (2015–2016) (25). Although there is some evidence that vaccine status may be underestimated (30), the current vaccine landscape still falls below the critical vaccination threshold in particular locales. All datasets are freely available online (25, 33–35). Additionally, the school data used have been archived (https://github.com/adbecker/1904WoolwichMeasles).
Epidemic Models and Inference.
Within the school year, we assume a simple mass-action epidemic (4) with no recruitment into the susceptible class. In this setting, the assumptions of frequency and density dependence give rise to similar dynamics given the small group size and high transmission rate (37). We use a continuous time model under the assumption that the epidemic is a partially observed Markov process. Using a stochastic SIR model with constant contact during the school term, the probability of successfully observing an infection is modeled as a dispersed negative binomial to allow for underreporting, , and measurement error, per ref. 38. Mathematically this is equivalent to . The parameter can be seen as the shape parameter for an overdispersed Poisson distribution (38). We choose an SIR model over an SEIR (susceptible, exposed, infected, and resistant) model due to the reduction in required parameter, initial condition, and state fitting, as well as minimal qualitative difference between the two models (39, 40). Given school or age-class data, we estimate parameters using the iterated filtering algorithm. A full discussion of the development, algorithm, and convergence criteria can be found in refs. 41 and 42. We estimate the basic reproductive ratio ), reporting rate , and dispersion rate . is exponentially transformed and and are expit-transformed to reflect the assumption that both are positive and reporting is bounded between 0 and 100%. Inference is performed using the POMP R package (43, 44) in the R programming language (45) [plots are produced using the ggplot2 R package (46)]. We fix the infectious period to be 13 d due to identifiability issues (16), which may be due to varying population sizes (4). As a test of the inference method in a school setting, we simulated partially observed short epidemics over a range of transmission rates and successfully recovered the assumed values of (a fit showing an estimated versus an input is in Supporting Information) (44). Finally, these results are applied to the current school vaccine rates in California via a hypothetical school of 77 students with varying rates of vaccination/susceptibility. Using the final size equation as described by refs. 47–49,
| [1] |
or, when the initial population is not all susceptible,
| [2] |
where
| [3] |
we calculate the final sizes that correspond to a range of estimates of (= 5, 10, and 50) that have been shown to be realistic in a school setting. Note the low estimate of 5 is used to account for the potential enactment of control measures.
Inference Method.
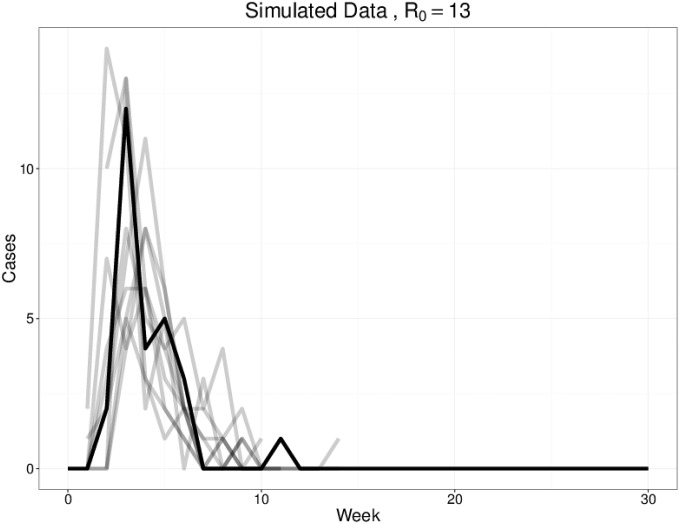
To ensure that the school transmission estimates can be effectively recovered from true data, we tested the inference on simulated data. Inputting an = 12, , and in a population of 500 with 200 susceptible, we simulated data (black) for 30 wk. We successfully recovered the following estimates: and . These results are shown in Fig. S1.
Fig. S1.
As a test of the inference method, we fit simulated data (black). The gray lines show 10 randomly chosen simulations, which fit well.
Age Estimates.
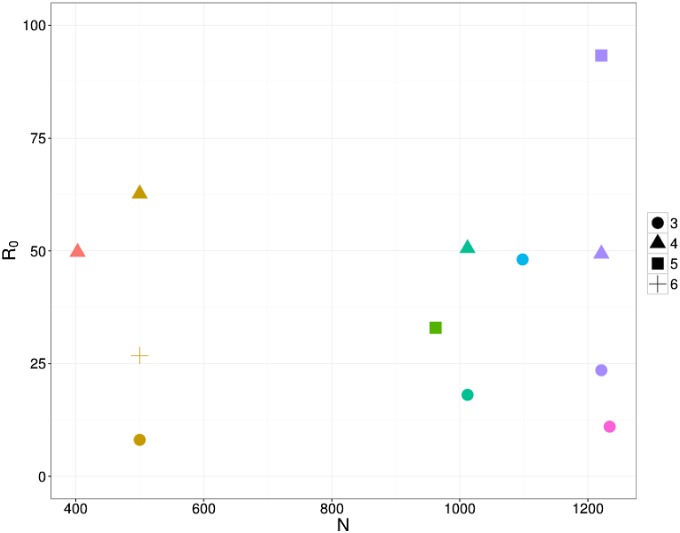
The age-class estimates are shown in Fig. S2. Here, each school is plotted in a different color, where the shape indicates the age class. Note that the x axis is the overall school size. We found no clear trend between age and .
Fig. S2.
This figure shows estimates for the age-stratified data based on ages 3 through 6 y and school size.
Outliers.
As seen in Fig. 6, we have two relative outliers in Purrett Road and Eglington Road. Although both of these schools fail the Ljung–Box white noise test, they differ from the rejected school datasets in their relatively large outbreak size. It is thus difficult to completely exclude them for the analysis. To address this issue, we simulate the model for 8, 25, and 42 with an infection period of 13 d, a reporting rate of , and a dispersion rate for both Purrett Road and Eglington Road. We compare the final size (adjusted for underreporting) of our 100 simulated outbreaks for each level and compare with the final size of the reported cases. For Purrett Road, at , we get a final size of 36 with a confidence interval (CI) of (32, 41), at we get a final size of 49 with a CI of (45, 53), and at we get a final size of 56 with CI (53, 58). These ’s underestimate the reported final size of 78 cases. For Eglington Road, at , we get a final size of 39 with a CI of (33, 45), at we get a final size of 60 with a CI of (56, 64), and at we get a final size of 62 with a CI of (60, 65). An of 8 compares well with the reported final size of 40 cases.
Acknowledgments
We thank the Wellcome Collection for digitalizing the original documents. A.D.B. was supported by the Center for Health and Wellbeing at Princeton University. B.T.G. was supported by the Research and Policy for Infectious Disease Dynamics program of the Science and Technology Directorate, Department of Homeland Security, the Fogarty International Center, National Institutes of Health, and the Bill and Melinda Gates Foundation. The findings and conclusions in this report are those of the author(s) and do not necessarily represent the official position of the Centers for Disease Control and Prevention.
Footnotes
This paper results from the Arthur M. Sackler Colloquium of the National Academy of Sciences, “Coupled Human and Environmental Systems,” held March 14–15, 2016, at the National Academy of Sciences in Washington, DC. The complete program and video recordings of most presentations are available on the NAS website at www.nasonline.org/Coupled_Human_and_Environmental_Systems.
The authors declare no conflict of interest.
This article is a PNAS Direct Submission.
This article contains supporting information online at www.pnas.org/lookup/suppl/doi:10.1073/pnas.1604976113/-/DCSupplemental.
References
- 1.Finkenstädt BF, Grenfell BT. Time series modelling of childhood diseases: A dynamical systems approach. J Roy Stat Soc C Appl Stat. 2000;49(2):187–205. [Google Scholar]
- 2.Grenfell BT, Bjørnstad ON, Finkenstädt BF. Dynamics of measles epidemics: Scaling noise, determinism, and predictability with the TSIR model. Ecol Monogr. 2002;72(2):185–202. [Google Scholar]
- 3.Glass K, Xia Y, Grenfell BT. Interpreting time-series analyses for continuous-time biological models—Measles as a case study. J Theor Biol. 2003;223(1):19–25. doi: 10.1016/s0022-5193(03)00031-6. [DOI] [PubMed] [Google Scholar]
- 4.He D, Ionides EL, King AA. Plug-and-play inference for disease dynamics: Measles in large and small populations as a case study. J R Soc Interface. 2010;7(43):271–283. doi: 10.1098/rsif.2009.0151. [DOI] [PMC free article] [PubMed] [Google Scholar]
- 5.Bolker B, Grenfell B. Space, persistence and dynamics of measles epidemics. Philos Trans R Soc Lond B Biol Sci. 1995;348(1325):309–320. doi: 10.1098/rstb.1995.0070. [DOI] [PubMed] [Google Scholar]
- 6.Grenfell BT, Bjørnstad ON, Kappey J. Travelling waves and spatial hierarchies in measles epidemics. Nature. 2001;414(6865):716–723. doi: 10.1038/414716a. [DOI] [PubMed] [Google Scholar]
- 7.Schenzle D. An age-structured model of pre- and post-vaccination measles transmission. IMA J Math Appl Med Biol. 1984;1(2):169–191. doi: 10.1093/imammb/1.2.169. [DOI] [PubMed] [Google Scholar]
- 8.Ferguson NM, Nokes DJ, Anderson RM. Dynamical complexity in age-structured models of the transmission of the measles virus: Epidemiological implications at high levels of vaccine uptake. Math Biosci. 1996;138(2):101–130. doi: 10.1016/s0025-5564(96)00127-7. [DOI] [PubMed] [Google Scholar]
- 9.Rhodes CJ, Anderson RM. A scaling analysis of measles epidemics in a small population. Philos Trans Biol Sci. 1996;351(1348):1679–1688. doi: 10.1098/rstb.1996.0150. [DOI] [PubMed] [Google Scholar]
- 10.Caudron Q, et al. Predictability in a highly stochastic system: Final size of measles epidemics in small populations. J R Soc Interface. 2015;12(102):20141125. doi: 10.1098/rsif.2014.1125. [DOI] [PMC free article] [PubMed] [Google Scholar]
- 11.London WP, Yorke JA. Recurrent outbreaks of measles, chickenpox and mumps I. Seasonal variation in contact rates. Am J Epidemiol. 1973;98(6):453–468. doi: 10.1093/oxfordjournals.aje.a121575. [DOI] [PubMed] [Google Scholar]
- 12.Fine PE, Clarkson JA. Measles in England and Wales–I: An analysis of factors underlying seasonal patterns. Int J Epidemiol. 1982;11(1):5–14. doi: 10.1093/ije/11.1.5. [DOI] [PubMed] [Google Scholar]
- 13.Anderson RM, May RM. Infectious Diseases of Humans: Dynamics and Control. Vol 15 Oxford Univ Press; Oxford: 1992. [Google Scholar]
- 14.Wallinga J, Lévy-Bruhl D, Gay NJ, Wachmann CH. Estimation of measles reproduction ratios and prospects for elimination of measles by vaccination in some Western European countries. Epidemiol Infect. 2001;127(2):281–295. doi: 10.1017/s095026880100601x. [DOI] [PMC free article] [PubMed] [Google Scholar]
- 15.Fine PEM, Clarkson JA. Measles in England and Wales—II: The impact of the measles vaccination programme on the distribution of immunity in the population. Int J Epidemiol. 1982;11(1):15–25. doi: 10.1093/ije/11.1.15. [DOI] [PubMed] [Google Scholar]
- 16.Hooker G, Ellner SP, Roditi LDV, Earn DJD. Parameterizing state–space models for infectious disease dynamics by generalized profiling: Measles in Ontario. J R Soc Interface. 2011;8(60):961–974. doi: 10.1098/rsif.2010.0412. [DOI] [PMC free article] [PubMed] [Google Scholar]
- 17.Groendyke C, Welch D, Hunter DR. A network-based analysis of the 1861 Hagelloch measles data. Biometrics. 2012;68(3):755–765. doi: 10.1111/j.1541-0420.2012.01748.x. [DOI] [PMC free article] [PubMed] [Google Scholar]
- 18.Neal PJ, Roberts GO. Statistical inference and model selection for the 1861 Hagelloch measles epidemic. Biostatistics. 2004;5(2):249–261. doi: 10.1093/biostatistics/5.2.249. [DOI] [PubMed] [Google Scholar]
- 19.Britton T, Kypraios T, O’neill PD. Inference for epidemics with three levels of mixing: Methodology and application to a measles outbreak. Scand J Stat. 2011;38(3):578–599. [Google Scholar]
- 20.Lloyd-Smith JO, Schreiber SJ, Kopp PE, Getz WM. Superspreading and the effect of individual variation on disease emergence. Nature. 2005;438(7066):355–359. doi: 10.1038/nature04153. [DOI] [PMC free article] [PubMed] [Google Scholar]
- 21.Sugerman DE, et al. Measles outbreak in a highly vaccinated population, San Diego, 2008: Role of the intentionally undervaccinated. Pediatrics. 2010;125(4):747–55. doi: 10.1542/peds.2009-1653. [DOI] [PubMed] [Google Scholar]
- 22.Omer SB, et al. Nonmedical exemptions to school immunization requirements. JAMA. 2006;296(14):1757. doi: 10.1001/jama.296.14.1757. [DOI] [PubMed] [Google Scholar]
- 23.Omer SB, Richards JL, Ward M, Bednarczyk RA. Vaccination policies and rates of exemption from immunization, 2005–2011. N Engl J Med. 2012;367(12):1170–1171. doi: 10.1056/NEJMc1209037. [DOI] [PMC free article] [PubMed] [Google Scholar]
- 24.Thompson KM, et al. Trends in the risk of U.S. polio outbreaks and poliovirus vaccine availability for response. Public Health Rep. 2012;127(1):23–37. doi: 10.1177/003335491212700104. [DOI] [PMC free article] [PubMed] [Google Scholar]
- 25.California Department of Public Health 2016. Immunization rates in child care and schools (California Department of Public Health, Sacramento, CA). Available at https://www.cdph.ca.gov/PROGRAMS/IMMUNIZE/Pages/ImmunizationLevels.aspx.
- 26.Cherry JD, Harriman KH. 2012. Why do vaccine-preventable disease outbreaks occur in the US? Infectious Disease Special Edition 2012:53–57. Available at www.idse.net/download/VPD_IDSE12_WM.pdf.
- 27.Glasser JW, Feng Z, Omer SB, Smith PJ, Rodewald LE. The effect of heterogeneity in uptake of the measles, mumps, and rubella vaccine on the potential for outbreaks of measles: A modelling study. Lancet Infect Dis. 2016;16(5):599–605. doi: 10.1016/S1473-3099(16)00004-9. [DOI] [PMC free article] [PubMed] [Google Scholar]
- 28.Committee LCCPH School hygiene. Brit Med J. 1906;1(2352):216–218. [Google Scholar]
- 29.Christensen PE, et al. An epidemic of measles in southern Greenland, 1951; measles in virgin soil. II. The epidemic proper. Acta Med Scand. 1953;144(6):430–49. doi: 10.1111/j.0954-6820.1953.tb15717.x. [DOI] [PubMed] [Google Scholar]
- 30.Buttenheim AM, et al. MMR vaccination status of children exempted from school-entry immunization mandates. Vaccine. 2015;33(46):6250–6256. doi: 10.1016/j.vaccine.2015.09.075. [DOI] [PMC free article] [PubMed] [Google Scholar]
- 31.Centers for Disease Control and Prevention 2016. Measles cases and outbreaks (Centers for Disease Control and Prevention, Atlanta). Available at www.cdc.gov/measles/cases-outbreaks.html.
- 32.Mossong J, et al. Social contacts and mixing patterns relevant to the spread of infectious diseases. PLoS Med. 2008;5(3):e74. doi: 10.1371/journal.pmed.0050074. [DOI] [PMC free article] [PubMed] [Google Scholar]
- 33.Medical Officer of Health Reports 1848. London’s pulse: Medical officer of health reports 1848–1972. Available at wellcomelibrary.org/moh/
- 34.Davies S, et al. 1904. Annual report of the medical officer of health for Woolwich. Available at wellcomelibrary.org/moh/report/b19823290/0#?c=0&m=0&s=0&cv=0.
- 35.London County Council 1904. Report of the Medical Officer of Health for London County Council. Available at wellcomelibrary.org/moh/report/b18252539/1#?c=0&m=0&s=0&cv=6&z=-0.0815%2C0.1432%2C1.1545%2C0.4507.
- 36.Ljung GM, Box GEP. On a measure of lack of fit in time series models. Biometrika. 1978;65(2):297–303. [Google Scholar]
- 37.Bjørnstad ON, Finkenstädt BF. Dynamics of measles epidemics: Estimating scaling of transmission rates using a time series SIR model. Ecol Monogr. 2002;72(2):169–184. [Google Scholar]
- 38.Bhadra A, et al. Malaria in Northwest India: Data analysis via partially observed stochastic differential equation models driven by Lévy noise. J Am Stat Assoc. 2011;106(494):440–451. [Google Scholar]
- 39.Earn DJD, Rohani P, Bolker BM, Grenfell BT. A simple model for complex dynamical transitions in epidemics. Science. 2000;287(5453):667–670. doi: 10.1126/science.287.5453.667. [DOI] [PubMed] [Google Scholar]
- 40.Krylova O, Earn DJD. Effects of the infectious period distribution on predicted transitions in childhood disease dynamics. J R Soc Interface. 2013;10(84):20130098. doi: 10.1098/rsif.2013.0098. [DOI] [PMC free article] [PubMed] [Google Scholar]
- 41.Ionides EL, Bretó C, King AA. Inference for nonlinear dynamical systems. Proc Natl Acad Sci USA. 2006;103(49):18438–18443. doi: 10.1073/pnas.0603181103. [DOI] [PMC free article] [PubMed] [Google Scholar]
- 42.Ionides EL, Bhadra A, Atchadé Y, King A. Iterated filtering. Ann Math Stat. 2011;39(3):1776–1802. [Google Scholar]
- 43.King AA, et al. 2016. pomp: Statistical inference for partially observed Markov processes. Available at kingaa.github.io/pomp/
- 44.King AA, Nguyen D, Ionides EL. Statistical inference for partially observed Markov processes via the R Package pomp. J Stat Software. 2016;69(12):1–43. [Google Scholar]
- 45.R Core Team 2015. R: A language and environment for statistical computing (R Foundation for Statistical Computing, Vienna)
- 46.Wickham H, Chang W. 2016. ggplot2: An implementation of the grammar of graphics. Available at https://cran.r-project.org/web/packages/ggplot2/index.html.
- 47.Kermack WO, McKendrick AG. A contribution to the mathematical theory of epidemics. Proc Math Phys Eng Sci. 1927;115(772):700–721. [Google Scholar]
- 48.Allen LJ. An Introduction to Stochastic Processes with Applications to Biology. 2nd Ed Chapman & Hall; London: 2003. [Google Scholar]
- 49.Brauer F, van den Driessche P, Wu J, editors. 2008. Mathematical Epidemiology. Lecture Notes in Mathematics (Springer, Berlin), Vol 1945.


