Abstract
This report describes force measurements and atomic force microscope imaging of lipid–protein interactions that determine the structure of a model membrane system that closely mimics the myelin sheath. Our results suggest that noncovalent, mainly electrostatic and hydrophobic, interactions are responsible for the multilamellar structure and stability of myelin. We find that myelin basic protein acts as a lipid coupler between two apposed bilayers and as a lipid “hole-filler,” effectively preventing defect holes from developing. From our protein-mediated-adhesion and force–distance measurements, we develop a simple quantitative model that gives a reasonably accurate picture of the molecular mechanism and adhesion of bilayer-bridging proteins by means of noncovalent interactions. The results and model indicate that optimum myelin adhesion and stability depend on the difference between, rather than the product of, the opposite charges on the lipid bilayers and myelin basic protein, as well as on the repulsive forces associated with membrane fluidity, and that small changes in any of these parameters away from the synergistically optimum values can lead to large changes in the adhesion or even its total elimination. Our results also show that the often-asked question of which membrane species, the lipids or the proteins, are the “important ones” may be misplaced. Both components work synergistically to provide the adhesion and overall structure. A better appreciation of the mechanism of this synergy may allow for a better understanding of stacked and especially myelin membrane structures and may lead to better treatments for demyelinating diseases such as multiple sclerosis.
Keywords: lipid–protein interactions, myelin membrane structure, membrane adhesion, membrane regeneration/healing, demyelinating diseases
This communication addresses the general question of the molecular interactions that determine the structure and stability of membranes that are stabilized by bridging proteins, with the myelin sheath of the central nervous system (CNS) being taken as a prime example of this type of structure. The myelin sheath is formed by extensions of oligodendrocyte cell membranes that wrap around the axon to form a cylindrical scroll a few tens of micrometers in diameter (1, 2). The sheath consists of repeat units of “double” bilayers separated by 3- to 4-nm-thick aqueous layers that alternate between the cytoplasmic and extracellular spaces (2). Seventy to 80% of the dry weight of myelin consists of lipids, a proportion that is significantly higher than in most other cell membranes. There are two major proteins: myelin basic protein (MBP), which spans the aqueous cytoplasmic spaces, and proteolipid protein, which spans the bilayers (2). Myelin acts as a transmitter of electric signals known as action potentials, its efficiency being attributed to the low dielectric constant associated with the high lipid content of its closely apposed membranes. Electrical impulses are transmitted along myelinated axons orders of magnitude faster than along unmyelinated axons (2–4). There are a number of human diseases, of which multiple sclerosis is the most common, that result in damage to the myelin sheath through membrane de-adhesion and swelling (demyelination or vacuolization) and ultimate vesiculation (5, 6).
The forces and interactions that keep the myelin sheath intact likely include (i) noncovalent electrostatic and hydrophobic “bridging” forces between the negatively charged cytoplasmic membrane surfaces mediated by the positively charged MBP (7, 8, 9), (ii) attractive van der Waals forces between the two extracellular surfaces (10), and (iii) lipid–integral membrane protein interactions and/or curvature-determining packing forces within the membranes themselves (11). We show here that the attractive electrostatic interactions between different model myelin membranes are subtly dependent on the amount and ratio (or difference) of the lipid and protein charges, possibly sufficiently to explain the structure of healthy and diseased myelin. We also show and provide a simple explanation for how MBP adsorbs to and prevents defects from forming in myelin membranes.
Materials and Methods
The bilayers used in our experiments were modeled on the complex distribution of the lipids and proteins in native myelin membranes (12), although the choice of representative lipids was complicated by conflicting reports of the lipid compositions of healthy and diseased myelin and brain white matter in multiple sclerosis (3, 12–15). Our choices for the compositions of the “healthy” and “diseased” lipid bilayers (Table 1) were based on a previous study (12) in which we simplified the differences by simply enriching the phosphatidylcholine (PC) mole fraction of the diseased lipid mixture by 50% while keeping the relative amounts of the other lipids the same. Although the diseased lipid composition we used is unlikely to be a quantitative representation of the changes that occur in multiple sclerosis, the measured effects of changing the lipid composition on the various lipid–lipid and lipid–protein interactions are likely to be generally applicable. The sources of the lipids and other chemicals used are given in Table 1.
Table 1. Lipid compositions used for the control and diseased bilayers.
| Composition, mol %
|
||
|---|---|---|
| Lipid | Control | Diseased (PC enriched) |
| PC | 11 | 16 |
| Phosphatidylethanolamine | 16 | 15 |
| PS- | 1 | 1 |
| CerS- | 5 | 4 |
| Sphingomyelin | 8 | 7 |
| Cholesterol | 49 | 47 |
| Cerebrosides | 11 | 10 |
The myelin lipid mixture compositions are based on HPLC analysis of healthy (control) and normal-appearing but multiple-sclerosis diseased human brain white matter by Ohler et al. (12), where the only statistically significant changes were increases in the two major zwitterionic lipids PC and phosphatidylethanolamine. Our diseased lipid sample was simplified and amplified by simply increasing the PC composition by 50% and leaving all the other relative compositions unchanged. Note that the units here are in mol % rather than mass % as in ref. 12. The two negatively charged lipids are in bold type; the rest are neutral or zwitterionic. Porcine brain PC, PS-, phosphatidylethanolamine, sphingomyelin, and the cerebrosides, of purity >99%, were purchased from Avanti Polar Lipids and stored in chloroform until used. Cholesterol was purchased from Sigma—Aldrich.
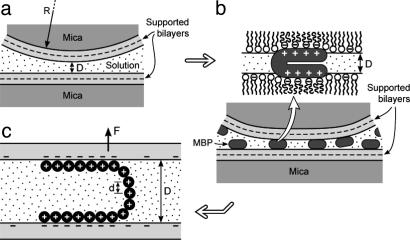
MBP, which is believed to hold the myelin membranes together, has an overall positive charge of 20 at physiological pH because of an excess of lysine and arginine residues, both of which bind to anionic lipids such as phosphatidylserine (PS–) and cerebroside sulfatide (CerS–) (16). MBP is water soluble and appears to be devoid of any secondary structure in solution (2, 16), but within the myelin sheath, MBP is believed to be in a bent configuration with a length of 7 nm and a thickness of 3 nm (17–19) (Fig. 1b). McLaurin et al. (20) found that the intermembrane bridging of MBP is reduced as the net positive charge drops from 20 (known as the C1 isomer) to 10 (the C8 isomer). For our studies we chose the most abundant MBP C1 isomer (of the 18.5-kDa isoform), purified and lipid-free, as described and characterized in ref. 7. Fig. 1 shows sketches of the supported mixed lipid bilayer systems studied.
Fig. 1.
Geometry of supported bilayer surfaces during force measurements and AFM imaging. An SFA 2 was used for the force measurements (10, 36). Force measurements were made between two symmetrical, crossed cylindrical surfaces of radius R, which is equivalent to a sphere of radius R approaching a planar surface. Lipid bilayers were formed on freshly cleaved mica substrates by conventional Langmuir–Blodgett deposition (25). (a) The first layer deposited was “solid”-phase dipalmitoylphosphatidylethanolamine (Avanti Polar Lipids) at a surface pressure of 35 mN/m and a molecular area of ≈0.42 nm2. The second monolayer was either the control or diseased lipid mixture, given in Table 1, which was deposited at 37 mN/m. After the deposition of the second layer, the bilayer-covered surfaces were transferred underwater into the SFA. The force F between the bilayer-coated surfaces in pH 7.4 4-morpholinepropanesulfonic acid (Mops) buffer (150 mM sodium nitrate/10 mM Mops sodium salt) was measured as a function of separation D, after which the two surfaces were separated, and 100 μl (low coverage) or 200 μl (high coverage) of 0.5 mg/ml solutions of MBP C1 in Mops buffer was injected. (Sodium chloride was substituted by sodium nitrate in the Mops buffer solution to avoid corrosion of the semireflecting silver layers under the mica substrates, which occurs in high concentrations of chloride ions. Mops sodium salt and sodium nitrate were purchased from Sigma–Aldrich.) After allowing the bilayers to equilibrate with the protein for >60 min, the surfaces were brought together again, and the new forces were measured (b). (c) Proposed conformation of the protein interacting with the anionic lipids based on the measured force–distance curves.
Adhesion and long-range force–distance measurements were conducted by using a surface forces apparatus (SFA 2, built in-house at the University of California, Santa Barbara) of internal liquid volume 500 ml, as previously described for performing experiments with supported bilayers (21) and proteins (22). Further experimental details are given in the figure legends.
Results
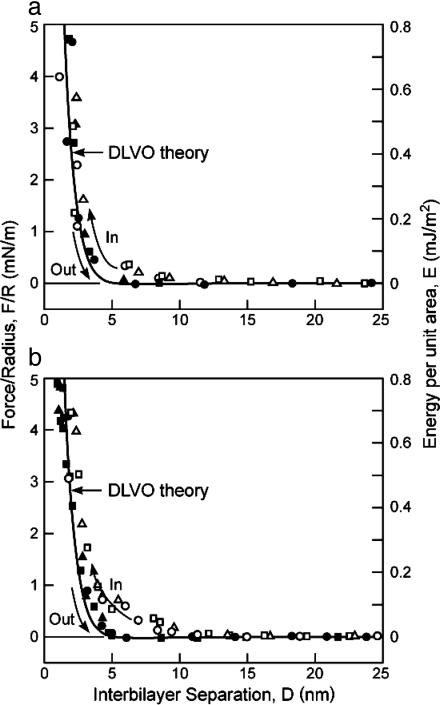
SFA Force Measurements. Fig. 2 shows the measured forces for control or healthy (a) and diseased (b) lipid bilayers in the absence of MBP. As expected from the minor changes in lipid composition, the measured forces are similar. The forces measured on separation are well described by the Derjaguin–Landau–Verwey–Overbeek (DLVO) theory (10), which includes the attractive van der Waals and repulsive electrostatic double-layer forces between two negatively charged bilayers. A zero or very weak van der Waals adhesion of order F/R = –0.05 ± 0.05 mN/m was measured at distances D between 10 and 15 nm (Fig. 2) for the healthy lipids but not for the diseased lipid mixture. We note, as has been observed in many previous force measurements between biological samples (23, 24), that the approach is more repulsive than the separation. This effect is probably due to the initially rougher and less correlated surfaces, which become smoothed out and where attractive species diffuse toward each other on contact to make the separation more attractive (or less repulsive). The short-range forces measured on separation are therefore likely to be closer to the “equilibrium” adhesion forces and are better described by theory.
Fig. 2.
Measured force profiles between control (a) and diseased (PC-enriched) (b) lipid bilayers with no MBP in 0.15 M NaNO3 solutions at t = 25°C (cf. Fig. 1a). The right-hand axes give the corresponding energy per unit area between two flat surfaces as given by the Derjaguin approximation (10), E = F/2πR. ○, □, and ▵, approach; •, ▪, and ▴, separation. Three to four separately measured approach and separation runs are shown in each case. The lines are theoretical expressions based on the DLVO theory (9), where the repulsive electrostatic and attractive van der Waals forces are given by F/R = 64πεε0κ(kT/e)2tanh2(eψ0/4kT)e–κD – A/6D2, where κ–1 = 0.8 nm is the expected Debye length in 0.15 M NaNO3 solution at 25°C(T = 298 K); ψ0 =–32 and –30 mV, respectively, as calculated for the surface potentials of healthy (a) and diseased (b) bilayers consisting of 5.7% and 5.3% negatively charged lipid (Table 1); and A = 3 × 10–21 J is the calculated nonretarded but screened Hamaker constant (10). Inserting these values into the above equation yields the curves in a and b, where we have computed the repulsive electrostatic forces on the assumption that the negative charges are located 0.5 nm farther out from the compressed surfaces, which defines D = 0, because the negative charges are located at the extreme ends of the flexible PS– and CerS– head groups.
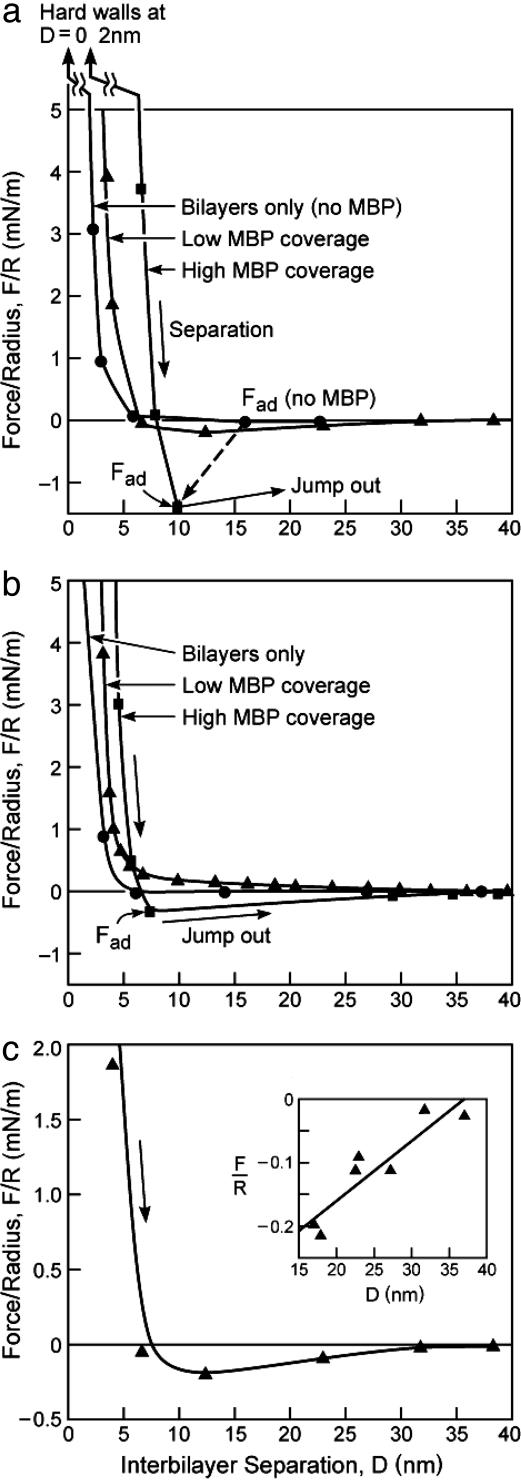
Fig. 3 shows that addition of MBP causes a dramatic increase in the interbilayer adhesion. The positively charged MBP likely bridges negatively charged PS– and CerS– lipids on both surfaces (Fig. 1c) (8, 9, 16–19). The steric “hard-wall” repulsion moves out from D = 0 nm to D ≈ 2.0 nm, consistent with the atomic force microscope (AFM) images (Fig. 4 c and d), because of the presence of the protein between the surfaces, whereas the attractive adhesion force moves in (dashed line in Fig. 3a). The adhesion “sets in” only after the surfaces have been pressed close together, and the adhesion increases the longer the surfaces are kept close together (data not shown).
Fig. 3.
Measured force profiles on separation between control (a and c) and diseased (b) bilayers in 0.15 M NaNO3 solutions at t = 25°C without MBP in the solution (•) and after one injection of 100 μl of 0.5 mg/ml solution of MBP between the surfaces followed by a second injection of the same solution. The forces measured after the first and second injections are identified as “low MBP coverage” (▴) and “high MBP coverage” (▪), respectively. The interactions are purely repulsive on approach, i.e., there is no initial attraction, as also found in the case of the mixed lipid bilayers (Fig. 2). c and its Inset show the low coverage separation force profiles measured between control bilayers, as in a, but in greater detail and showing results from a number of different force runs. Only when the adhesion is not strong enough to cause the surfaces to jump apart can one measure the whole force–distance curve. The straight line through the data points in Inset of c is based on a simple polymer-bridging theory, Eq. 1, as discussed in the text.
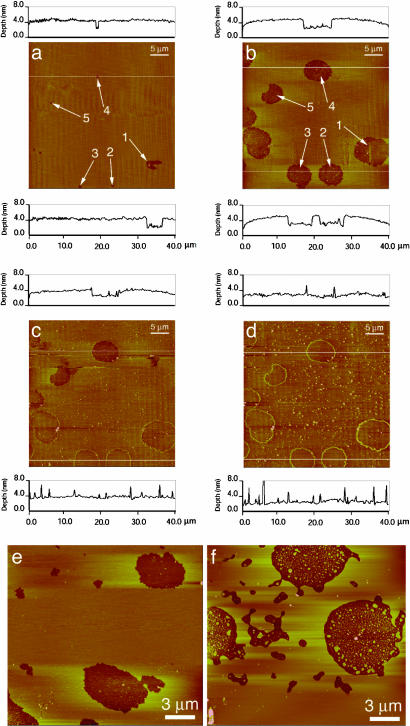
Fig. 4.
Tapping-mode AFM images of the same 40 × 40 μm region of a Langmuir–Blodgett-deposited myelin lipid bilayer (control composition from Table 1) on mica imaged in 0.15 mM NaNO3 solution at 25°C. (a) After 18 min of scanning. (b) After a further 12 h in stagnant water without scanning, showing the growth of 2.7-nm-deep (i.e., monolayer) holes or defects in an otherwise smooth bilayer. (c and d) Images of the same area 30 and 120 min, respectively, after adding 5 μl of 0.5 mg/ml MBP to the solution. MBP adsorbs to the bilayer surface (seen as the small white dots scattered throughout the film) with a lower concentration inside the hydrophobic monolayer holes and a higher concentration at the defect edges, creating a rim 2–5 nm high with the majority of heights being 2 or 4 nm above the surrounding bilayer surface. The defects also gradually heal; the holes fill in, presumably with lipid, because the inside of the hole has the same average height as the outside. The protein rim remains at the original boundaries of the hole. Bilayer deep holes (not shown) also were healed by added MBP. (e) After deposition, stable holes form in the bilayers as in a, but 12 h after myelin lipids with no MBP were added to the buffer solution the holes do not fill in, although some rearrangement of the bilayers has occurred (f). AFM images were acquired by using a Nanoscope III AFM (Digital Instruments, Santa Barbara, CA) with oxide-sharpened silicon nitrate tips with nominal spring constants of ≈0.12 or 0.32 N/m using tapping mode at frequencies of 9 and 29 kHz. The scanning rates ranged between 1 and 4 Hz. Through continuous adjustment of the scanning parameters, we verified that imaging affected neither surface structure nor MBP adsorption dynamics.
AFM Imaging. To better characterize the MBP organization, “tapping mode” AFM was done under water or saline buffer on films prepared in the same way as for the SFA measurements. Fig. 4a shows the control myelin lipid bilayer immediately after deposition. The films have a number of small “pinholes” either ≈2.7 nm (monolayer) or ≈6 nm (bilayer) deep (25, 26). If the films are left under buffer (without scanning), the holes grow larger through the loss of lipid from the defect sites. The holes are stable after a few hours of growth and do not fill in or grow further during tapping mode imaging (Fig. 4b), similar to pores in red blood cell ghosts and other bilayer membranes (11, 27).
Fig. 4 c and d show the same area of the film 30 and 120 min, respectively, after adding MBP to the solution. MBP adsorbs over the entire film (white dots in images) (28) but preferentially locates at the rims of the film defects (29). The preferential adsorption of MBP to the edges could be due to the increased hydrophobic attraction between MBP and the less densely packed lipids at these highly curved defect boundaries (30). Alternatively, anionic lipids may preferentially locate at the highly curved rims of the defects to minimize electrostatic interactions (11, 31), causing the positively charged MBP to preferentially bind to these regions.
In addition to the MBP adsorption, Fig. 4c shows that the holes begin to fill in with time (the line trace at the bottom of the image shows no height difference inside and outside the protein rim). After 120 min (Fig. 4d), all of the defects in the monolayer have filled in, and the surface is uniformly flat except for the adsorbed MBP, which sticks out ≈2 or 4 nm from the surface. Fig. 4 e and f shows that no “healing” occurs when lipid is added to the solution in the absence of MBP, attesting to its crucial secondary role.
This defect-healing effect (Fig. 4d) is consistent with a partial insertion of MBP into the outer monolayer, as illustrated schematically in Fig. 1b. This partial insertion increases the average area per lipid molecule, thus forcing lipids to flow laterally out into the monolayer holes. Langmuir monolayer studies show that the average area per lipid molecule increases after adsorption of MBP (28). As MBP inserts, it exerts a lateral pressure (see horizontal arrows in Fig. 1b) that forces lipid into the defect sites. Adding myelin lipids to defective films in the absence of MBP did not show this defect-healing effect (Fig. 4f).
Discussion and Theoretical Considerations
The experimental and theoretical results in Fig. 2 suggest that the DLVO forces between myelin lipids alone cannot account for the sheath structure. The adhesion is too weak and, for unsupported bilayers, would be even weaker because of their additional thermal undulation forces (32, 10). The increased PC content of the diseased films acts to further reduce the small intermembrane adhesion. MBP dramatically magnifies the adhesion in a way that is expected for a linear polymer whose segments bridge two surfaces as shown in Fig. 1c. If the surface–segment interaction energy is –ε, the maximum adhesion force is simply ε/d per molecule, where d is the distance between the excess positive charges on MBP. The force, therefore, is (33)
 |
[1] |
where the minus sign signifies attraction, a is the mean area per lipid molecule, f is the fraction of lipids that are (negatively) charged in the bilayer, Dmax is the fully extended length of MBP, and φ is the fraction of positive charges on MBP that are bound to the bilayer. Eq. 1 predicts a straight line of constant slope, which is consistent with the measured force–distance curve plotted in the Inset of Fig. 3c. [We note that this is an averaged force because it involves many bonds breaking at many distances or times; for a single MBP molecule, we would expect a succession of discrete breaks, as is often measured by AFM in single-molecule detachment experiments (8, 9, 34).] From the intercept at F = 0, we expect Dmax ≈ 35 nm, in excellent agreement with AFM force measurements of the maximum extension of MBP (8, 9). The maximum adhesion force, i.e., assuming that every negative lipid is bound to a lysine or arginine group, is F/R =–2πfφε/a = 4.0–6.5 mN/m [using f = 0.05, φ = 1, a = 0.40–0.65 nm2, and ε ≈ 2kT, which is the Coulomb energy for an ionic bond in water at an interionic separation of ≈0.3 nm (10)]. This value is 3–5 times larger than the adhesion force of –1.5 mN/m measured at the higher concentration of MBP (Fig. 3a), suggesting that not all of the MBP binding sites were occupied or that additional repulsive interactions are also involved.
The above model for the maximum adhesion can be developed further to quantify the synergistic roles of the lipids and protein in generating an attraction or repulsion between the membranes. First, as discussed above, in the absence of MBP the net long-ranged “background” force between the free lipid bilayers due to the DLVO, thermal-protrusion, and undulation forces is likely to be overall repulsive and therefore expressible in terms of a positive interaction energy +εrep per lipid molecule or +nεrep per unit area, where n = 1/a is the total number of lipid molecules per unit area in each monolayer. Let there be n– negative charges (of PS– and CerS–) per unit area facing n+ positively charged groups (of arginine and lysine) per unit area, and let each PS––MBP+ bond have a negative “ionic bond” energy of –εionic, where εionic is the same as ε in Eq. 1. Any excess or unbonded lipid or protein charge must be exposed either to a similarly charged or uncharged bilayer and therefore contributes a repulsive (positive) electrostatic double-layer force with an energy of, say, +εes. The magnitude of this nonbonding energy εes is likely to be smaller than the bonding energy εionic. Finally, we may assume that the lipids and proteins are laterally mobile and can diffuse so that each negative charge will find a positive charge with which to bind, if one is available. The total energy of the system per unit area is, therefore,
 |
[2] |
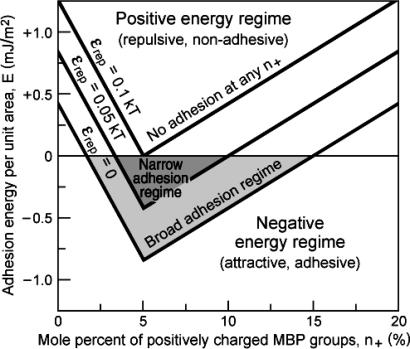
The maximum (negative) binding energy of E = –n+εionic + nεrep = –n–εionic + nεrep occurs, as expected, when n+ = n– (equal but opposite MBP and PS charges). Eq. 2 also shows that the window of good adhesion can be wide or narrow (or nonexistent), depending on the values of the energy parameters εionic, εes, and εrep and the fractions n– and n+ of negative lipids and positive MBP. As an example of the generic form of Eq. 2, Fig. 5 shows plots of the total energy as a function of MBP concentration n+ in the case where the negatively charged lipid concentration n– is fixed at the typical physiological value of 5% mol/mol. Three different nonelectrostatic repulsive energies εrep were considered. Fig. 5 shows that once the mismatch of positive and negative charges on the membrane and protein surfaces falls outside a certain range (3–10% MBP in the case of the intermediate repulsion in Fig. 5), the interaction is overall repulsive, and the membranes will demyelinate, i.e., they will swell, vacuolize, or vesiculate. It is likely that even before this point is reached, lateral phase separation will occur, in which adhesive regions or domains will be separated from nonadhesive regions. For good contact to occur throughout the structure, it may be that the electrostatic balance, i.e., n+ = n–, has to be satisfied everywhere (not only on the average) or there will be defective regions where the membranes are not in close apposition.
Fig. 5.
Total interaction energy, E, per unit membrane area with increasing MBP concentration n+ for a fixed concentration of negatively charged lipids n– of 5%. The following values were used: n = 2 × 10¹⁸ per m2 (corresponding to 50 Å2 per lipid), n– = 1017 per m2 (corresponding to a 5% fraction of charged lipids), εionic = 2 kT, εes = 1 kT, and εrep variable between 0 (no thermal repulsion) and 0.1 kT (significant repulsion). Adhesive regimes are shaded.
Finally, in regard to the apparent “membrane-healing power” of MBP, our results (Fig. 4) suggest that when MBP binds to myelin lipid bilayers it acts like a surfactant “piston oil” (35), providing a mechanism to maintain a high or constant surface pressure in the monolayers. This “healing” mechanism could be very valuable in maintaining the structure of myelin where a large area of membrane must be kept free of conducting pathways (defect holes) for the sheath to function properly as a low dielectric insulator. The uncontrolled growth of membrane defects could also lead to ultimate breakup and vesiculation of the myelin membranes (5, 11, 27). This also suggests a general mechanism of sealing leaking membranes (of vesicles, cell membranes, etc.) both in vivo and in vitro, and we note that certain classes of amphiphilic polymers such as polyoxamers are also effective sealers of lipid monolayers in vitro and of leaking or “damaged” membranes in vivo (37).
In conclusion, our results suggest that, in general, protein-mediated adhesion between fluid biological membranes requires a very delicate balance between the charges on the membranes and the opposite charges on the bridging proteins that together determine the attractive forces. The degree of membrane or lipid fluidity, which determines both the repulsive forces and the ability of binding sites to find each other by means of diffusion, also affects protein-mediated adhesion between fluid biological membranes. Small changes in any one of these parameters away from the optimum values can lead to large changes in the adhesion and, in turn, the morphology of stacked membrane systems.
Acknowledgments
Helpful discussions with Dan Schwartz and Jay Groves are gratefully acknowledged. This work was partially supported by the Materials Research Laboratory Program of the National Science Foundation under Award DMR00-80034, National Institutes of Health Grant HL-51177, and Tobacco-Related Disease Research Program Grant RT11-0228.
Abbreviations: AFM, atomic force microscope; CerS–, cerebroside sulfatide; DLVO, Derjaguin–Landau–Verwey–Overbeek; MBP, myelin basic protein; Mops, 4-morpholinepropanesulfonic acid; PC, phosphatidylcholine; PS, phosphatidylserine; SFA, surface forces apparatus.
References
- 1.Morell, P. & Norton, W. T. (1980) Sci. Am. 242, 88–90. [DOI] [PubMed] [Google Scholar]
- 2.Boggs, J. M. & Moscarello, M. A. (1978) Biochim. Biophys. Acta 515, 1–21. [DOI] [PubMed] [Google Scholar]
- 3.Wood, D. D. & Moscarello, M. A. (1984) J. Membr. Biol. 79, 195–201. [DOI] [PubMed] [Google Scholar]
- 4.Cuzner, M. L. & Norton, W. T. (1996) Brain Pathol. 6, 231–242. [DOI] [PubMed] [Google Scholar]
- 5.Genain, C. P., Cannella, B., Hauser, S. L. & Raine, C. S. (1999) Nat. Med. 5, 170–175. [DOI] [PubMed] [Google Scholar]
- 6.Ohler, B., Graf, K., Bragg, R., Lemons, T., Coe, R., Genain, C., Israelachvili, J. & Husted, C. (2004) Biochim. Biophys. Acta 1688, 10–17. [DOI] [PubMed] [Google Scholar]
- 7.Boggs, J. M., Wood, D. D. & Moscarello, M. A. (1981) Biochemistry 20, 1065–1073. [DOI] [PubMed] [Google Scholar]
- 8.Mueller, H., Butt, H. J. & Bamberg, E. (1999) Biophys. J. 76, 1072–1079. [DOI] [PMC free article] [PubMed] [Google Scholar]
- 9.Mueller, H., Butt, H. J. & Bamberg, E. (2000) J. Phys. Chem. B 104, 4552–4559. [Google Scholar]
- 10.Israelachvili, J. N. (1992) Intermolecular and Surface Forces (Academic, London).
- 11.Betterton, M. D. & Brenner, M. P. (1999) Phys. Rev. Lett. 82, 1598–1601. [Google Scholar]
- 12.Ohler, B., Revenko, I. & Husted, C. (2001) J. Struct. Biol. 133, 1–9. [DOI] [PubMed] [Google Scholar]
- 13.Chia, L. S., Thompson, J. E. & Moscarello, M. A. (1984) Proc. Natl. Acad. Sci. USA 81, 1871–1874. [DOI] [PMC free article] [PubMed] [Google Scholar]
- 14.Ginsberg, L. & Gershfeld, N. L. (1991) Neurosci. Lett. 130, 133–136. [DOI] [PubMed] [Google Scholar]
- 15.Husted, C. A., Matson, G. B., Adams, D. A., Goodin, D. S. & Weiner, M. W. (1994) Ann. Neurol. 36, 239–241. [DOI] [PubMed] [Google Scholar]
- 16.Moscarello, M. A. (1990) Prog. Clin. Biol. Res. 336, 25–48. [PubMed] [Google Scholar]
- 17.Beniac, D. R., Luckevich, M. D., Czarnota, G. J., Tompkins, T. A., Risdale, R. A., Ottensmeyer, F. P., Moscarello, M. A. & Harauz, G. (1997) J. Biol. Chem. 272, 4261–4268. [DOI] [PubMed] [Google Scholar]
- 18.Risdale, R. A., Beniac, D. R., Tompkins, T. A., Moscarello, M. A. & Harauz, G. (1997) J. Biol. Chem. 272, 4269–4275. [DOI] [PubMed] [Google Scholar]
- 19.Haas, H., Oliveira, C. L. P., Torriani, I. L., Polverini, E., Fasano, A., Carlone, G., Cavatorta, P. & Riccio, P. (2004) Biophys. J. 86, 455–460. [DOI] [PMC free article] [PubMed] [Google Scholar]
- 20.McLaurin, J., Ackerley, C. A. & Moscarello, M. A. (1993) J. Neurosci. Res. 35, 618–628. [DOI] [PubMed] [Google Scholar]
- 21.Marra, J. & Israelachvili, J. N. (1985) Biochemistry 24, 4608–4618. [DOI] [PubMed] [Google Scholar]
- 22.Leckband, D. E., Schmitt, F.-J., Israelachvili, J. N. & Knoll, W. (1994) Biochemistry 33, 4611–4624. [DOI] [PubMed] [Google Scholar]
- 23.Hinterdorfer, P. (2004) in Handbook of Nanotechnology, ed. Bhushan, B. (Springer, Berlin), pp. 475–494.
- 24.Schirmeisen, A., Anczykowski, B. & Fuchs, H. (2004) in Handbook of Nanotechnology, ed. Bhushan, B. (Springer, Berlin), pp. 449–473.
- 25.Zasadzinski, J. A., Viswanathan, R., Madsen, L., Garnaes, J. & Schwartz, D. K. (1994) Science 263, 1726–1733. [DOI] [PubMed] [Google Scholar]
- 26.Takamoto, D. Y., Aydil, E., Zasadzinski, J. A., Ivanova, A., Schwartz, D. K., Yang, T. & Cremer, P. (2001) Science 293, 1292–1295. [DOI] [PubMed] [Google Scholar]
- 27.Steck, T. L., Weinstein, R. S., Straus, J. H. & Wallach, D. F. H. (1970) Science 168, 255–257. [DOI] [PubMed] [Google Scholar]
- 28.Polverini, E., Arisi, S., Cavotorta, P., Berzina, T., Cristofolini, L., Fasano, A., Riccio, P. & Fontana, M. P. (2003) Langmuir 19, 872–877. [Google Scholar]
- 29.Facci, P., Cavatorta, P., Cristofolini, L., Fontana, M. P., Fasano, A. & Riccio, P. (2000) Biophys. J. 78, 1413–1419. [DOI] [PMC free article] [PubMed] [Google Scholar]
- 30.Israelachvili, J. N., Mitchell, D. J. & Ninham, B. W. (1976) J. Chem. Soc. Faraday Trans. 2 72, 1526–1568. [Google Scholar]
- 31.Israelachvili, J. N. (1973) Biochim. Biophys. Acta 323, 659–663. [DOI] [PubMed] [Google Scholar]
- 32.Helfrich, W. (1978) Z. Naturforsch. A 33, 305–315. [Google Scholar]
- 33.Leckband, D. & Israelachvili, J. N. (2001) Q. Rev. Biophys. 34, 105–267. [DOI] [PubMed] [Google Scholar]
- 34.Becker, N., Oroudjev, E., Mutz, S., Cleveland, J. P., Hansma, P. K., Hayashi, C. Y., Makarov, D. E. & Hansma, H. G. (2003) Nat. Mater. 2, 278–283. [DOI] [PubMed] [Google Scholar]
- 35.Schwartz, D. K. (1997) Surf. Sci. Rep. 27, 241–334. [Google Scholar]
- 36.Israelachvili, J. N. & Adams, G. E. (1978) J. Chem. Soc. Faraday Trans. 1 74, 975–1001. [Google Scholar]
- 37.Wu, G., Majewski, J., Ege, C., Kjaer, K., Weygand, M. J. & Lee, K. Y. (2004) Phys. Rev. Lett. 93, 1–4. [DOI] [PubMed] [Google Scholar]


