Abstract
A microfluidic cytometer with integrated on-chip optical systems was designed for red blood cell (RBC) and platelet (PLT) counting. The design, fabrication, and characterization of the microfluidic cytometer with on-chip optical signal detection were described. With process using only a single mask, the device that integrates optical fibers and on-chip microlens with microfluidic channels on a polydimethylsiloxane layer by standard soft photolithography. This compact structure increased the sensitivity of the device and eliminated time-consuming free-space optical alignments. The microfluidic cytometer was used to count red blood cells and platelets. Forward scatter and extinction were collected simultaneously for each cell. Experimental results indicated that the microfluidic cytometer exhibited comparable performance with a conventional cytometer and demonstrated superior capacity to detect on-chip optical signals in a highly compact, simple, truly portable, and low-cost format that is well suitable for point-of-care clinical diagnostics.
I. INTRODUCTION
Flow cytometry is a powerful tool for measuring and analyzing optical signals arising from particles, such as cells and beads. Scattering light inspection provides rich information about cells or particles of interest.1 Small-angle forward scatter (FSC) provides size information, whereas large-angle side scatter (SSC) offers information on internal properties (granularity and viability). Flow cytometry has been widely used for various applications such as clinical hematology diagnosis,2,3 immunology,4 and cancer biology.5 However, the high cost, large size, mechanical complexity, large consumption of expensive agents, and requirements for professional operation of flow cytometry have limited its application.
In the past few decades, microfluidic chips have attracted considerable attention because of their unique advantages such as small size, low reagent and power consumption, low cost, and short reaction time. Currently, microchip-based devices have been widely used in clinical blood tests,6–10 DNA detection,11–13 urine analysis,14–17 protein analysis,18,19 and many other applications. In order to miniaturize the functionality of a conventional flow cytometer, researchers have exerted significant efforts to develop miniaturized flow cytometry devices based on microfluidic chips. At the beginning, some researchers initially miniaturized the flow cytometer through integrating the microfluidic chip with the conventional free-space optics.20–25 However, most of these microsystems are either complicated in chip processing or only miniaturized in the microfluidic chip itself. In addition, these microsystems still rely on free-space optics, including high-power light source, microscope objectives, filters, and dichroic mirror. The complex integration and alignment of these free-space components generally render the entire system bulky, costly, and rigidly fixed.
With the development of the microelectromechanical systems (MEMS) technology, the integration of optical components into microchip devices has become a feasible method to produce truly portable and compact microsystems.26 Integrated optical components, such as optofluidic lenses,27 on-chip lenses,28,29 waveguides,30,31 fibers,32–34 and beam stops,35 have been designed and fabricated on microchips via mature microfabrication. In order to demonstrate true cytometry functions, a microfluidic cytometer must possess an excitation beam shaping system and an effective on-chip optical signal collection system. Many groups have studied the on-chip beam shaping system to form a narrow and uniform light spot in the channel.36–40 However, few researchers focused on optimizing the on-chip optical signal collection system, the optical fibers or waveguides used for optical signal detection were located on the chip subjectively according to their common sense, instead of according to the actual beam characteristics formed by the on-chip beam shaping system. Like the beam shaping system, the effective on-chip optical signal collection system plays an equally vital role in improving the signal-to-noise ratio (SNR) of scattering or fluorescent light. Therefore, both functional on-chip optical systems should be considered together during the optical system optimization process to improve the SNR and lower the detection limit of the entire system.
The present research described the design, fabrication, and performance of a cheap and disposable microfluidic cytometer with both integrated optical excitation and on-chip collection systems. Both the integrated optical excitation and on-chip collection systems were optimized, which will significantly reduce the waist diameter of the beam, lower the detection limit, and improve the SNR of the system. Microgrooves, microlens, and microchannels were fabricated on a polydimethylsiloxane (PDMS) layer by soft lithography. Microgrooves were used to realize the physical registration of optical fibers that serve as optical waveguides for laser excitation and FSC detection. Microlens was designed to reshape the beam emitted from the end face of the excitation fiber, and light was precisely focused at the center of the microchannel to form an interrogation region for single particle detection. This work demonstrated the capability of the versatile microfluidic cytometer to improve FSC on-chip detection. In addition, the fabrication and packaging of the disposable integrated microfluidic device were simple and fast. Its significant size reduction facilitates the development of a truly portable, inexpensive microchip-based microfluidic cytometer well suitable for point-of-care (POC) diagnosis and on site analysis.
II. MATERIALS AND METHODS
A. Microfluidic cytometer overview
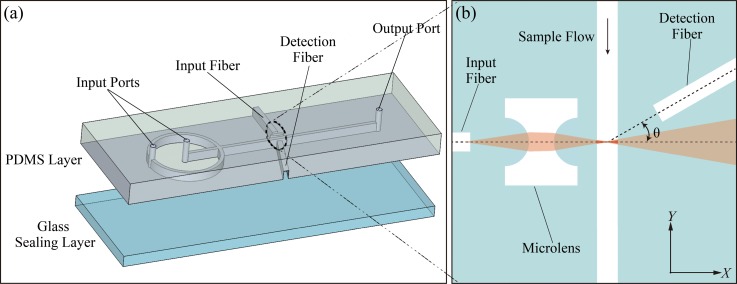
In the microfluidic cytometer, the main innovative parts are the integrated optical systems for optical excitation and effective measurement of scattered light. Figure 1 shows the diagram of the microfluidic cytometer design.
FIG. 1.
(a) 3D structural drawing of the microfluidic cytometer. (b) Detailed schematic of the integrated optical systems.
As shown in Figure 1(a), all integrated on-chip optical components were fabricated in the same plane of the microfluidic networks, including microchannels for 2D hydrodynamic sample focusing, two microgrooves for excitation and detection fibers, and an integrated microlens. Figure 1(b) shows the detailed schematic of the integrated optical systems. The input fiber that is perpendicular to the micro channel guided the excitation light on the first surface of microlens. On the opposite side of the channel, a detection fiber oriented at a small angle relative to the incident light was applied to detect the FSC signals while, at the same time, avoiding coupling of the direct beam from the light source. When the polystyrene microsphere suspension flowed through the interrogation region at the center of the sample channel sandwiched by sheathing flows, the FSC signals arising from the particles were collected using the detection fiber placed at 13° relative to the incident light and then delivered to the photodetector. Finally, the signals of the photodetector were captured by a data acquisition card (PCI-1710U-DE, Advantech), and data post-processing was carried out using the program written in MATLAB (R2014b, USA).
B. Materials and equipment
A 2-in. silicon wafer and a piece of glass were used as the substrate and the cover slip, respectively. SU-8 2050 photoresist and its developer (MicroChem Corp.) were used to form the rigid SU-8 molds. PDMS resin and curing agent (Dow Corning Corp.) were used to replicate the structures on the mold. Molecular Probes' Flow Cytometry Size calibration beads (Molecular Probes, Inc.) were used to demonstrate the FSC on-chip detection capacity of the microfluidic cytometer. In addition, sphericized reagents and cell diluents (Beijing Mansunny Technology Co., Ltd.) for red blood cells (RBCs) and platelet (PLTs) were used to pretreat the blood samples.
A 633 nm excitation light was generated by a laser diode (Changchun New Industries Optoelectronics Technology Co., Ltd.) and coupled into the input fiber via a fiber coupler (Thorlabs Inc.). A single-mode optical fiber (core diameter = 4.3 μm, cladding diameter = 125 μm, and NA = 0.13) was used as the excitation fiber. A multi-mode optical fiber (core diameter = 62.5 μm, cladding diameter = 125 μm, and NA = 0.275) served as the detection fiber (Beijing Xing-Yuan-Ao-Te Optoelectronic Tech. Co., Ltd.). A photodiode (OPT101, Texas Instruments Inc.) served as the detector. Two syringe pumps (Longer Pump Inc.) were used to deliver the sample and the sheathing flows.
III. RESULTS
A. Design and fabrication of integrated on-chip optical systems
1. Design of integrated on-chip optical systems
Although using an optical fiber can improve the flexibility and minimize the system, the divergent output light from the fiber end leads to a larger cone-shaped excitation beam in the microchannel. This divergent beam further increases the possibility of multi-particle detection. Therefore, a properly designed microlens between the fiber and the microchannel is crucial for the performance of the microfluidic cytometer. In addition, the location of the detection fiber is optimized according to the special beam shape formed by the microlens to maximize the SNR of FSC signals.
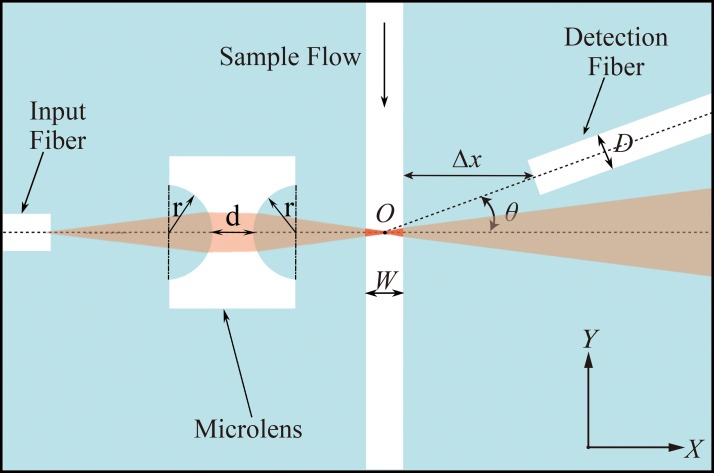
As shown in Figure 2, ray tracing analysis was conducted using the simulation software CODE V® (Synopsys, Inc., USA) to design an integrated on-chip microlens that can focus the incident light to the center of the microchannel. During simulation, the beam waist diameter at the center of the microchannel was set as a merit function, and the distances between the optical elements and the curvature radius of the microlens were set as variables. The optimal parameters for each optical element were obtained by geometric image analysis of the focal plane. In this study, a beam reshaping optical system with a 6 μm beam waist was modeled. As shown in Figure 2, the radius of curvature r of the biconcave cylindrical lens surface was ∼200 μm, and the minimum distance d between the two surfaces of the microlens was approximately 200 μm.
FIG. 2.
Schematic of the integrated on-chip optical systems of microfluidic cytometer.
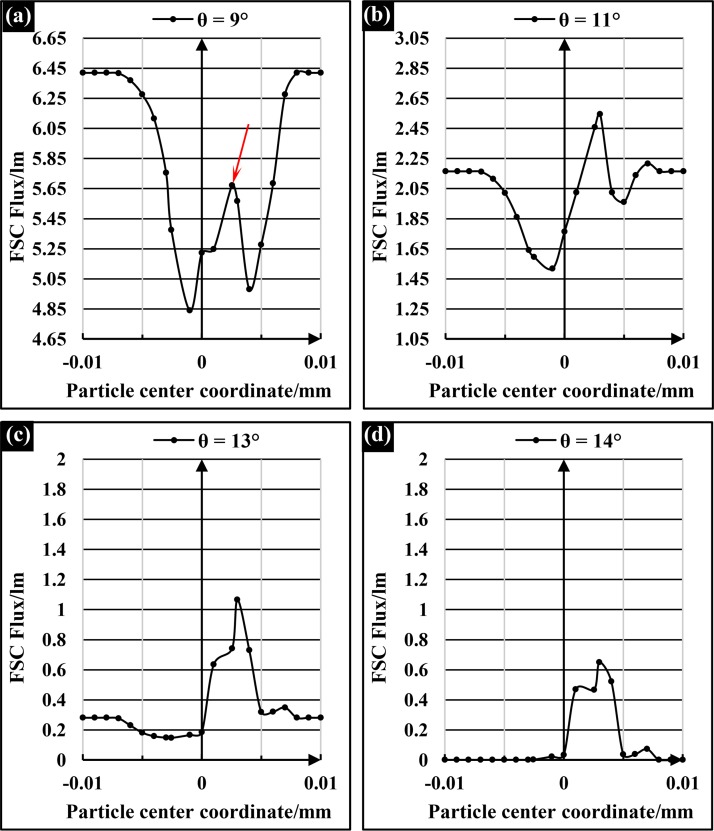
Furthermore, both the integrated optical excitation and on-chip collection systems were verified using the optical simulation software TracePro® (Lambda Research Corporation, Inc., USA) to obtain the best location of the detection fiber and to maximize the SNR of FSC signals. On the basis of the beam reshaping model built in CODE V, a Mie scattering model was used to the cell flowing through the light beam interrogation region to produce the optical scattering pattern. The optimization of θ, the angle between the detection fiber and the incident light, was executed via irradiance/illuminance analysis on the end face of detection fiber using software TracePro. Figure 3 illustrates the simulation FSC signal detected though the detection fibers at a different deflected angle θ when a 10 μm-diameter particle passes through the detection area gradually, and the abscissa of 0 represents that the particle moves to the center of the beam and particle center coordinate intersects with the optical axis.
FIG. 3.
The simulation FSC signal shapes of 10 μm-diameter particle at deflected angles of (a) 9°; (b) 11°; (c) 13°; and (d) 14°.
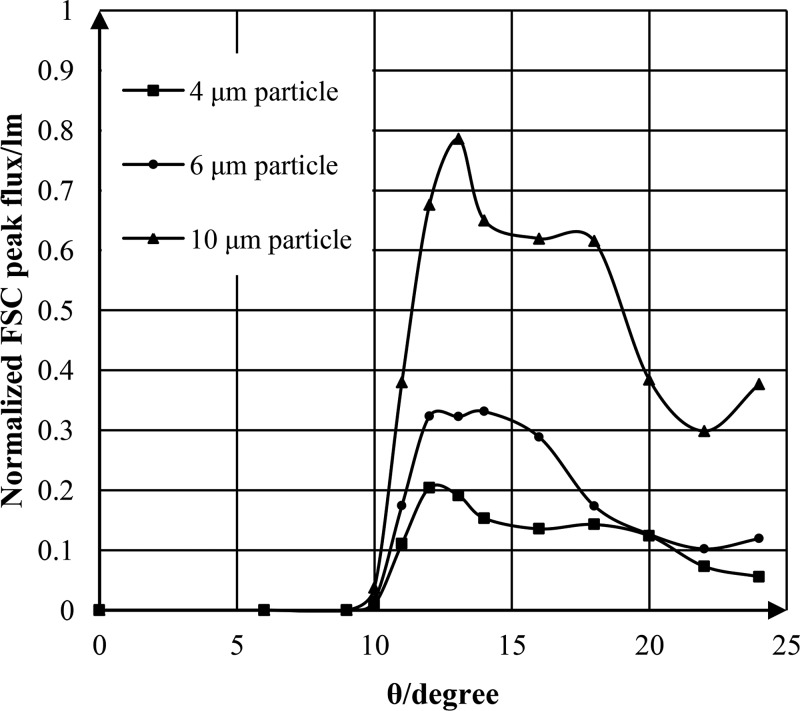
As shown in Figure 3(a), when the detection fiber was deflected a small angle 9° relative to the incident light, the detection fiber would collect a great deal of the incident light (∼6.41 lm) when no particles passed though the beam. As the particles passed through the detection area gradually, the FSC would be collected by the detection fiber. But the FSC peak intensity arising from particles, which was indicated by a red arrow in Figure 3(a), was too weak compared to the incident light intensity, and the SNR of FSC signal was so low that the FSC signal peaks were submerged in the noise. Consequently, the normalized FSC peak flux, which could reflect the SNR of FSC signals, was almost equal to zero when the detection fiber was deflected 9°. However, as shown in Figures 3(b), 3(c), and 3(d), as the deflected angle θ increased from 10° to 14°, the incident light collected by the detection fiber decreased greatly; the FSC intensity was stronger than the incident light intensity. Therefore, the FSC signal peaks emerged from the noise and the normalized FSC peak flux increased rapidly. The normalized FSC peak flux variations of 4 μm-, 6 μm-, and 10 μm-diameter particles with the angle θ ranging from 0° to 24° were shown in Figure 4.
FIG. 4.
The normalized FSC peak flux variations of 4 μm-, 6 μm-, and 10 μm-diameter particle with the angle θ ranging from 0° to 24°.
As shown in Figure 4, the normalized FSC peak flux of 4 μm-, 6 μm-, and 10 μm-diameter particles initially increased with θ, and reached the maximum value at 12°, 14°, and 13° respectively; then, the normalized FSC peak flux decreased slowly with θ. Apparently, the optimal angles for different-size particles were almost the same. In this paper, in order to optimize the SNR of the FSC signals from RBCs and PLTs, and at the same time, taking the micromachining errors into account, the optimal angles for both RBC and PLT were set to be approximately 13° on the basis of the simulation results in Figure 4.
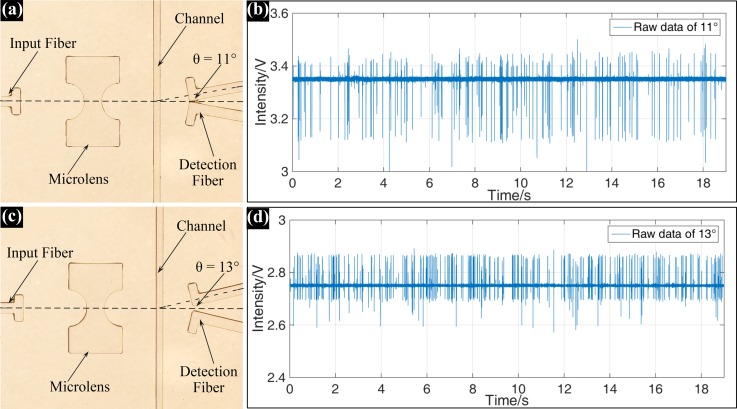
To verify the influence of deflected angle θ on the FSC signals in the actual experimental environment, the detection fibers with typical deflected angles of 11° and 13° were fabricated on the same microchip. Figure 5 shows the real FSC signals of 10 μm-diameter particles detected by the detection fibers located at 11° and 13°.
FIG. 5.
Microscopic images of the integrated optical systems with detection fiber deflected (a) 11° and (c) 13°; the real FSC signal of 10 μm-diameter particle detected at the deflected angles of (b) 11° and (d) 13°.
As shown in Figure 5, obviously, the FSC signal detected by the detection fiber with 11° deflected angle had a higher background (∼3.35 V) and a lower SNR than the FSC signal detected at 13°. Furthermore, the downwards extinction peak in Figure 5(b), which was caused by the particle blocking part of the incident light, was much bigger than that in Figure 5(d). These experimental results were in good agreement with the simulation results in Figure 3, and also fully proved that the optimization of the on-chip optical signal collection system was very necessary.
2. Fabrication of integrated on-chip optical systems
On the basis of the simulation results of CODE V and TracePro, the microlens design models for different biological particles were built, and the designed structure was printed on a photomask via laser printing. In this paper, the entire integrated optical system was fabricated by soft lithography technology, and all optical lenses and optical surfaces were made of PDMS. Soft lithography is a convenient, effective, and low-cost method for manufacturing microstructures, which could generate structures with feature sizes ranging from tens of nanometers to hundreds of microns.41 PDMS is a kind of polymeric materials, and it has several excellent characteristics for optical applications, including high transmittance for light from the visible to the near-infrared wavelengths, high refractive index after hard baking, good thermal stability, and high homogeneity. In recent years, PDMS has been widely used in the fabrication of optical components, such as optical waveguides and microlens. Therefore, both the precise micromachining technology and the good optical properties of PDMS guaranteed the reproducibility of the new system.
During the process of micromachining, the structure on photomask was duplicated to the SU-8 layer by controlling the exposure and developing time, thereby forming a hard and self-aligned SU-8 mold. Then a PDMS replica with the microlens, microchannels, and fiber channels was peeled off from the SU-8 mold. Finally, the PDMS replica was boned to a glass substrate using the conventional oxygen plasma cleaning technology. Figure 6 shows the scanning electron microscope (SEM) images of the convex SU-8 mold and the PDMS microlens. As shown in Figure 6(a), the SU-8 mold had a good semicircular profile and is very steep at the rim, and in Figure 6(b), the PDMS was sputtered with gold for imaging, obviously, the PDMS can make conformal contact with surfaces and can replicate fine structures with high precision.
FIG. 6.
SEM images of (a) the convex SU-8 mold; (b) PDMS microlenses with curvature radius of ∼200 μm.
The fabricated microfluidic cytometer with a 6 μm beam waist diameter at the center of the channel was shown in Figure 7. Figure 7(a) shows the assembled chip of the microfluidic cytometer, and Figure 7(b) illustrates the photomask with integrated on-chip optical components and channels. As shown in Figures 7(a) and 7(b), the device included two input ports and one output port. The micro channels were designed to be 80 μm wide and 129 μm deep for optical fiber insertion. Figure 7(c) shows an amplified microscope image of the integrated optical system to illustrate clearly the arrangement of the input fiber, integrated on-chip lens, and the detection fiber around the microfluidic channel. As discussed previously, the detection fiber was placed at 13° relative to the incident light.
FIG. 7.
(a) A photo of the assembled microfluidic cytometer chip. (b) A global picture of the photomask design. (c) A microscopic image of the integrated on-chip optics.
To confirm the beam waist diameter in the microchannel, the microfluidic channel is filled with Rhodamine B with the concentration of 1 mg/ml to show the property of light spot in the micro channel, accordingly, a 532 nm laser diode was selected as the light source.
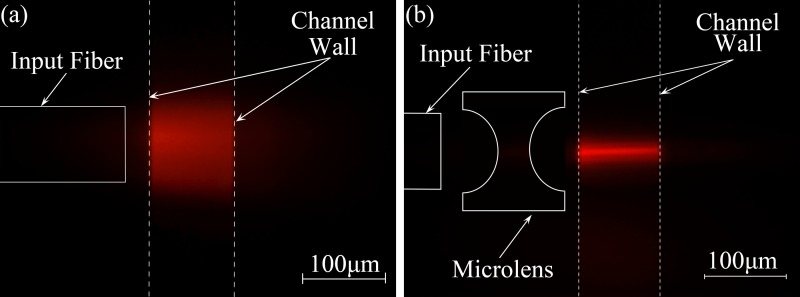
As shown in Figures 8(a) and 8(b), comparing the two images, for the device without microlens in Figure 8(a), the excitation fiber was placed as close as possible to the channel wall (∼200 μm in this system). However, it still had a wide and divergent beam in the microchannel, and the diameter of the beam waist was about 80 μm. In contrast, the device with microlens shown in Figure 8(b) yielded a focused beam in micro channel. The diameter of this focused beam waist was approximately 8 μm showing excellent agreement with the ray tracing simulation. Moreover, this concentrated intensity distribution across the channel guaranteed the consistency of the FSC signal intensities.
FIG. 8.
Microscopic fluorescence images of the beam shapes within the microchannel filled with Rhodamine B. (a) The real light propagation diagram from device without microlens; (b) The real light propagation diagram within the channel from device with microlens. Reprinted with permission from Li et al., Proc. SPIE 10024, 100240J (2016). Copyright 2016 Society of Photo-Optical Instrumentation Engineers.42
B. Microfluidic cytometer performance
1. FSC calibration of the microfluidic cytometer
Polystyrene particles of various diameters at a given concentration of 105particles/ml were used to evaluate the FSC on-chip detection performance of the microfluidic cytometer. To maximize the portability and disposability of the device and to minimize the fabrication cost and processing steps, only 2D hydrodynamic focusing was used to confine the particles to the center of the channel as these particles pass through the interrogation region sequentially. A low sample flow rate of approximately 10 μl/min was adopted to reduce the possibility for cell aggregation. The width of the focused sample stream was easily controlled by adjusting the flow conditions and the geometry of the microfluidic channel. Finally, the ratio of the sample to sheath flows was set to 1:4.1 to produce a ∼7 μm-width particle sample stream.
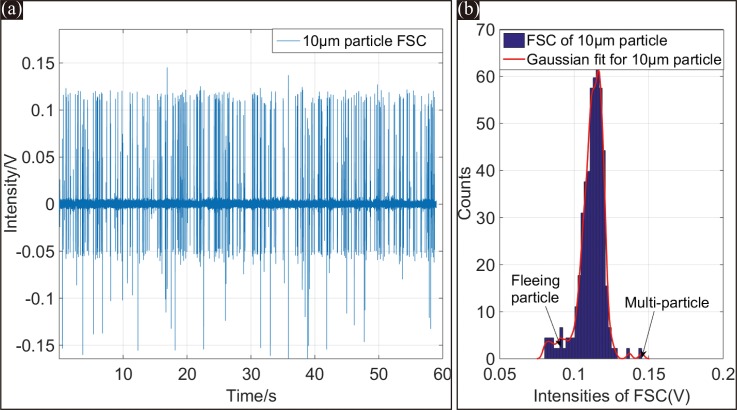
Figure 9(a) shows the FSC signals of 10 μm-diameter particles over a 60 s testing duration. The FSC signal peak intensities were highly uniform, and the SNR of the signal was approximately 22 dB, which is sufficient to identify the FSC signals reliably. The FSC on-chip detection performance of the microfluidic cytometer benefitted from the reshaped light beam in the micro channel by the on-chip microlens. The focused 6 μm-diameter beam with a small divergence and concentrated intensity distribution guaranteed the consistency of the FSC signal intensities. The tilted detection fiber could further guarantee the reliable detection of the microfluidic cytometer.
FIG. 9.
(a) FSC signals of 10 μm-diameter particles within 60 s. (b) Histogram of the detected peak intensities from the entire 60 s FSC test, the CV of FSC is about 6.31%.
The histogram of FSC signal intensities for 10 μm-diameter particles over the entire 60 s test is plotted in Figure 9(b). The coefficient of variation (CV), defined as the standard deviation divided by the mean of the signal intensity, was calculated to be 6.31% from the histogram with a Gaussian fitting curve. This small CV value was on the leading edge of current microchip devices that integrate both beam reshaping and optical signal detection systems on the chip. An additional small peak also appeared near 0.15 V of the histogram. This small peak was caused by the small number of multi-particles simultaneously passing through the interrogation area. Using a sample suspension with a lower concentration could avoid the situation.
2. FSC resolution test of the microfluidic cytometer
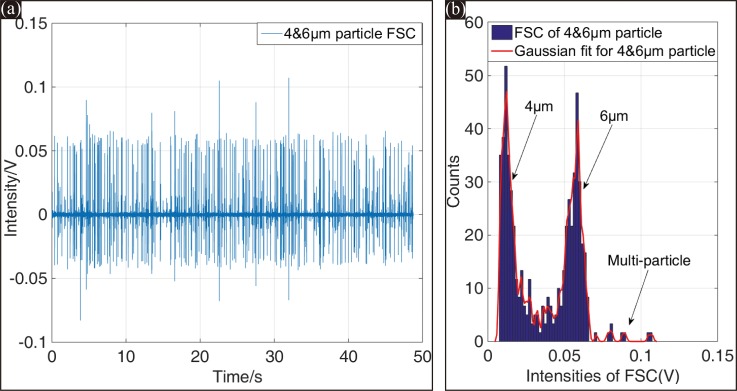
The resolution of this microfluidic cytometer is characterized by its capability to resolve different FSC intensities from various size particles. In this system, 6 μm- and 4 μm-diameter particles were used to mimic the test for RBC and PLT counting. Figure 10(a) shows the FSC signals of the 4 μm- and 6 μm-diameter particles mixed at a ratio of 1:1 over a test period of 50 s. The histogram of the two distinct populations of FSC intensities within 50 s is plotted in Figure 10(b). Apparently, the two populations were well separated, and only a small overlapping occurred between the two histograms.
FIG. 10.
(a) FSC signals of 4 μm- and 6 μm-diameter particles within 50 s. (b) Histogram of the detected peak intensities from the entire 50 s FSC test, the CV values for 4 μm- and 6 μm-diameter particles were 29.07% and 17.89%, respectively.
As mentioned above, the sample stream by 2D hydrodynamic focusing was ∼7 μm in width. The stream width is appropriate for 6 μm-diameter particles but not for 4 μm-diameter particles. Therefore, 4 μm-diameter particles would fluctuate more severely than 6 μm-diameter particles in the focused spot. As demonstrated in Figure 10, the CV values of 4 μm- and 6 μm-diameter particles were 29.07% and 17.89%, respectively. This resolution performance of the microfluidic cytometer was acceptable for resolving the two particle sizes from FSC signals.
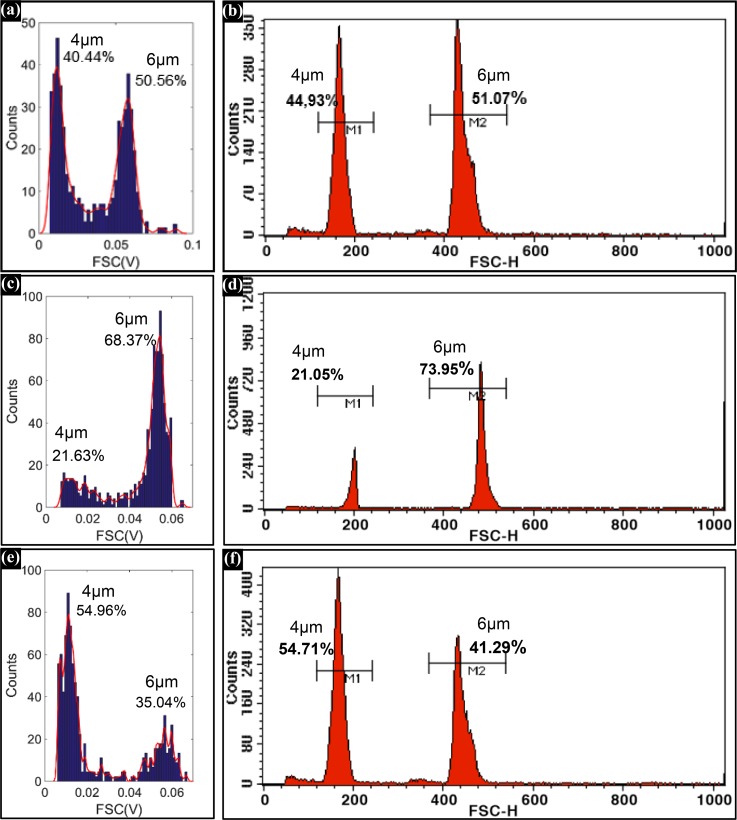
To evaluate the counting accuracy of the new system, 4 μm- and 6 μm-diameter particles were mixed at ratios of 1:1, 1:4, and 3:2 respectively. Three different mixing ratio particles were tested using the microfluidic cytometer and a state-of-the-art flow cytometer (BD FACS Calibur). The counting results were shown in Figure 11. Comparing the counting results shown in Figure 11, the microfluidic cytometer exhibited comparable performance with the conventional cytometer. The acceptable resolution and counting accuracy provided a guarantee for the RBC and PLT counting.
FIG. 11.
Histograms of the FSC signals of 4 μm- and 6 μm-diameter particles in (a), (c), and (e) were detected by the microfluidic cytometer; and histograms of the FSC signals in (b), (d), and (f) were detected by the BD FACS Calibur.
C. RBC and PLT counting
Finally, the microfluidic cytometer was applied to detect RBCs and PLTs. However, differentiating RBCs and PLTs by virtue of their volume difference in their native states is shown to be rather difficult. To overcome this problem, we pretreated the RBC and PLT samples to increase their volume difference before testing the cells with the microfluidic cytometer and the commercial flow cytometer.
1. Preparation of blood sample
A type of sphericized reagent (Beijing Mansunny Technology Co., Ltd.) was used to turn the RBCs into a spherical shape, thus increasing the volume difference between RBCs and PLTs. The pretreated RBCs and PLTs were observed under microscope. As shown in Figures 12(a) and 12(b), RBCs treated by the sphericized reagent were swollen to spheres. This pretreatment allowed the microfluidic cytometer to distinguish and count the RBCs and PLTs accurately.
FIG. 12.
Microscopic images of the RBCs (a) without the RBC and PLT sphericized reagent and (b) with the RBC and PLT sphericized reagent.
Fresh venous blood (10 μl) was treated with EDTA-anticoagulant and then mixed with 10 ml of the sphericized reagent and 40 ml of cell diluent. Finally, the RBCs and PLTs were diluted 10 000 times to concentrations of 4.75 × 10⁵/ml and 2 × 10⁴/ml, accordingly. The number of leukocytes was negligible when compared with those of the RBCs and PLTs.
2. RBC and PLT counting by the microfluidic cytometer
The same RBC and PLT samples treated with the sphericized reagent were tested using the microfluidic cytometer and a state-of-the-art flow cytometer (Backman Counter FC500). The counting results are shown in Figures 13 and 14.
FIG. 13.
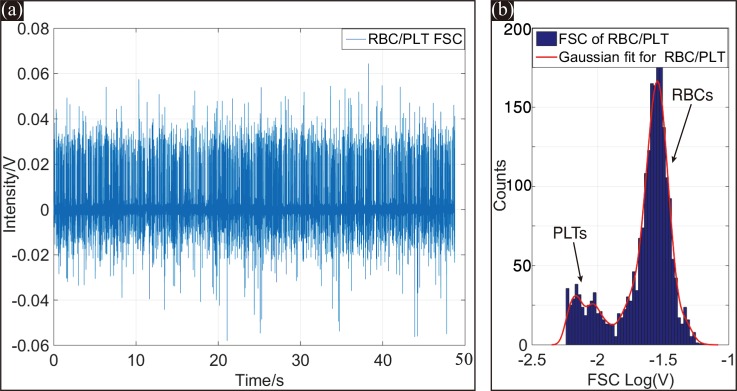
(a) FSC signals of RBCs and PLTs from the microfluidic cytometer within 50 s. (b) Histogram of the detected peak intensities of the entire 50 s FSC test. Reproduced with permission from Li et al., Proc. SPIE 10024, 100240J (2016). Copyright 2016 Society of Photo-Optical Instrumentation Engineers.42
FIG. 14.
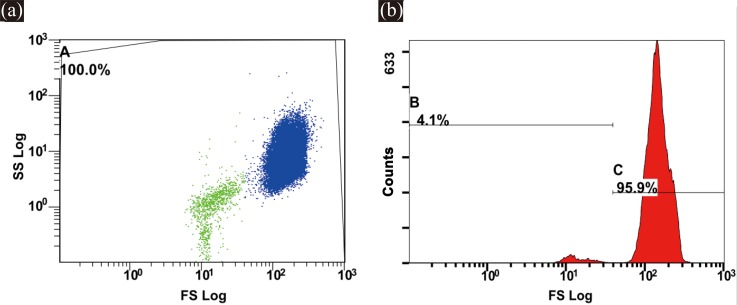
(a) 2D scatter plots of RBCs and PLTs obtained from a commercial flow cytometer. (b) Histogram of the detected FSC signals.
As mentioned above, the PLTs were smaller than the RBCs, and the RBCs were approximately 20 times greater in number than the PLTs. A logarithmic scale was used for plotting the scatterplots and histogram to display the FSC and SSC signals of RBCs and PLTs distinctly. Figure 13(a) shows the FSC signals of the RBCs and PLTs from the microfluidic cytometer within 50 s. Figure 13(b) describes the frequency histogram of the FSC peak intensities within 50 s on a logarithmic scale. As shown in Figure 13(b), the microfluidic cytometer clearly separated the two populations.
Figure 14(a) depicts the scatterplots of the RBCs and PLTs tested by the commercial flow cytometer FC500, and Figure 14(b) shows the FSC frequency histogram of the RBCs and PLTs. As shown in Figures 14(a) and 14(b), all cells were included within the gate A, and the detected cells could be grouped into two distinct clusters using FSC and SSC detection.
Table I shows a comparison of the counting results measured by the microfluidic cytometer and FC500. Only a few microliters of sample were needed for our device, and the sample consumption of the commercial flow cytometer was more than 10 times that of our device. As shown in Table I, the RBC and PLT concentrations (multiplied by the dilution ratio 10 000) obtained from both our device and FC500 matched well with the normal values of a healthy person (RBC concentration: 4.00–5.50 × 10¹²/l, PLT concentration: 100–300 × 109/l).
TABLE I.
Comparison of RBC and PLT counting measured with microfluidic cytometer and FC500.
| Sample consumption (μl) | PLT count | RBC count | Total count | PLT concentration (109/l) | RBC concentration (1012/l) | |
|---|---|---|---|---|---|---|
| Microfluidic cytometer | 8.3 | 168 | 3447 | 3605 | 202 | 4.15 |
| FC500 | 94.3 | 2063 | 47 939 | 49 999 | 219 | 5.08 |
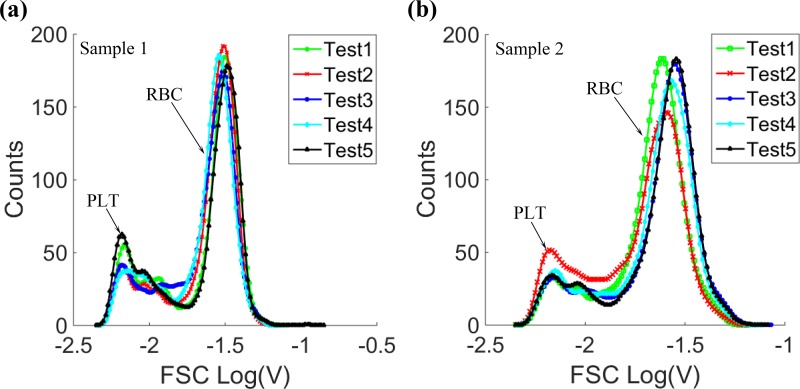
Furthermore, in order to verify the repeatability of the new system, blood samples from two healthy persons were tested 5 times respectively on the microfluidic cytometer, and the histograms of the FSC signals were shown in Figure 15. As demonstrated in Figure 15, whether for the same blood sample, or different blood samples, the system both had acceptable repeatability for RBC and PLT counting. All these results demonstrated the potential application of the microfluidic cytometer in clinical assays.
FIG. 15.
The FSC signal histograms of 5 tests from (a) sample 1 and (b) sample 2.
IV. CONCLUSIONS
The developed microfluidic cytometer with integrated on-chip optical systems demonstrated on-chip optical signal detection. In our device, both the excitation beam shaping system and the on-chip optical signal collection system were integrated in a microfluidic chip. The stability and resolution of the system were tested by counting polystyrene particles, and RBC and PLT counting was realized using the microfluidic cytometer. Compared with conventional flow cytometers, the microfluidic cytometer features simpler fabrication and packaging, smaller sample consumption, lower cost, and easier integration. These features demonstrate the potential feasibility of the present device for a miniaturized cytometer with superior capabilities in detecting small subpopulations of cells in biological samples such as blood. With future improvements based on the similar concept and technology, this device could integrate fluorescence and scattering light detecting systems on a single chip for extended functionalities. The developed microfluidic cytometer holds promise for a cost effective, compact device for POC diagnosis and the on site analysis.
ACKNOWLEDGMENTS
The work described in this paper was financially supported by the National Key Scientific Instrument and Equipment Development Projects of China (2012YQ04014005).
References
- 1. Shapiro H. M., Practical Flow Cytometry ( Wiley-Liss, New York, 2003), p. 53. [Google Scholar]
- 2. Heikali D. and Di Carlo D., JALA , 319 (2010). 10.1016/j.jala.2010.02.005 [DOI] [Google Scholar]
- 3. Coulter W. H., in Proceedings of the National Electronics Conference, Chicago, USA (1956), pp. 1034–1040. [Google Scholar]
- 4. Liang S., Slattery M. J., Wagner D., Simon S. I., and Dong C., Ann. Biomed. Eng. , 661 (2008). 10.1007/s10439-008-9445-8 [DOI] [PMC free article] [PubMed] [Google Scholar]
- 5. Dong C., Slattery M. J., Rank B. M., and You J., Ann. Biomed. Eng. , 344 (2002). 10.1114/1.1468889 [DOI] [PMC free article] [PubMed] [Google Scholar]
- 6. Shi W., Guo L., Kasdan H., and Tai Y., Lab Chip , 1257 (2013). 10.1039/c3lc41059e [DOI] [PubMed] [Google Scholar]
- 7. Van Berkel C., Gwyer J. D., Deane S., Green N., Holloway J., Hollis V., and Morgan H., Lab Chip , 1249 (2011). 10.1039/c0lc00587h [DOI] [PubMed] [Google Scholar]
- 8. Holmes D., Pettigrew D., Reccius C. H., Gwyer J. D., van Berkel C., Holloway J., Davies D. E., and Morgan H., Lab Chip , 2881 (2009). 10.1039/b910053a [DOI] [PubMed] [Google Scholar]
- 9. Han X., van Berkel C., Gwyer J., Capretto L., and Morgan H., Anal. Chem. , 1070 (2012). 10.1021/ac202700x [DOI] [PubMed] [Google Scholar]
- 10. Zhao Y., Li Q., Ge Y., Hu X., Li X., and Deng Y., Space Med. Med. Eng. , 307 (2012). 10.16289/j.cnki.1002-0837.2012.04.006 [DOI] [Google Scholar]
- 11. Kendall E. L., Wienhold E., and DeVoe D. L., Biomicrofluidics , 44109 (2014). 10.1063/1.4891100 [DOI] [PMC free article] [PubMed] [Google Scholar]
- 12. Yang F., Zhang Y., Rafeah S., Ji H., Xie S., Ning Y., and Zhang G., RSC Adv. , 21541 (2014). 10.1039/c4ra02076f [DOI] [Google Scholar]
- 13. Martins D., Levicky R., and Song Y., Biosens. Bioelectron. , 87 (2015). 10.1016/j.bios.2015.04.063 [DOI] [PubMed] [Google Scholar]
- 14. Lin C. C., Tseng C. C., Huang C. J., Wang J. H., and Lee G. B., Biomed. Microdevices , 887 (2010). 10.1007/s10544-010-9443-0 [DOI] [PubMed] [Google Scholar]
- 15. Ge Y., Li Q., Zhao Y., and Hu X., Space Med. Med. Eng. , 151 (2013). 10.16289/j.cnki.1002-0837.2013.02.017 [DOI] [Google Scholar]
- 16. Fernandez-la-Villa A., Bertrand-Serrador V., Pozo-Ayuso D. F., and Castano-Alvarez M., Anal. Methods , 1494 (2013). 10.1039/c2ay26166a [DOI] [Google Scholar]
- 17. Zitka O., Cernei N., Heger Z., Matousek M., Kopel P., Kynicky J., Masarik M., Kizek R., and Adam V., Electrophoresis , 2639 (2013). 10.1002/elps.201300114 [DOI] [PubMed] [Google Scholar]
- 18. Yan J., Hu M., Li D., He Y., Zhao R., Jiang X., Song S., Wang L., and Fan C., Nano Res. , 490 (2008). 10.1007/s12274-008-8052-1 [DOI] [Google Scholar]
- 19. Xu Y., Shen J., Lu J., and Wen Z., Prog. Chem. , 754 (2008). [Google Scholar]
- 20. Mu C., Zhang F., Zhang Z., Lin M., and Cao X., Sens. Actuators, B , 402 (2011). 10.1016/j.snb.2010.09.055 [DOI] [Google Scholar]
- 21. Spencer D., Elliott G., and Morgan H., Lab Chip , 3064 (2014). 10.1039/C4LC00224E [DOI] [PubMed] [Google Scholar]
- 22. Wu T., Mei Z., Pion-Tonachini L., Zhao C., Qiao W., Arianpour A., and Lo Y., AIP Adv. , 22155 (2011). 10.1063/1.3609967 [DOI] [PMC free article] [PubMed] [Google Scholar]
- 23. Guo T., Wei Y., Xu C., Watts B. R., Zhang Z., Fang Q., Zhang H., Selvaganapathy P. R., and Deen M. J., Electrophoresis , 298 (2015). 10.1002/elps.201400211 [DOI] [PubMed] [Google Scholar]
- 24. Joo S., Kim K. H., Kim H. C., and Chung T. D., Biosens. Bioelectron. , 1509 (2010). 10.1016/j.bios.2009.11.011 [DOI] [PubMed] [Google Scholar]
- 25. Frankowski M., Bock N., Kummrow A., Schädel-Ebner S., Schmidt M., Tuchscheerer A., and Neukammer J., Cytometry, Part A , 613 (2011). 10.1002/cyto.a.21083 [DOI] [PubMed] [Google Scholar]
- 26. Cho S. H., Godin J. M., Chen C., Qiao W., Lee H., and Lo Y., Biomicrofluidics , 43001 (2010). 10.1063/1.3511706 [DOI] [PMC free article] [PubMed] [Google Scholar]
- 27. Zhao H. T., Yang Y., Chin L. K., Chen H. F., Zhu W. M., Zhang J. B., Yap P. H., Liedberg B., Wang K., Wang G., Ser W., and Liu A. Q., Lab Chip , 1617 (2016). 10.1039/C6LC00295A [DOI] [PubMed] [Google Scholar]
- 28. Camou S., Fujita H., and Fujii T., Lab Chip , 40 (2003). 10.1039/b211280a [DOI] [PubMed] [Google Scholar]
- 29. Seo J. and Lee L. P., Sens. Actuators, B , 615 (2004). 10.1016/j.snb.2003.11.014 [DOI] [Google Scholar]
- 30. Watts B. R., Zhang Z., Xu C., Cao X., and Lin M., Biomed. Opt. Express , 1051 (2013). 10.1364/BOE.4.001051 [DOI] [PMC free article] [PubMed] [Google Scholar]
- 31. Yang Y., Liu A. Q., Chin L. K., Zhang X. M., Tsai D. P., Lin C. L., Lu C., Wang G. P., and Zheludev N. I., Nat. Commun. , 1 (2012). 10.1038/ncomms1662 [DOI] [PMC free article] [PubMed] [Google Scholar]
- 32. Tung Y. C., Zhang M., Lin C. T., Kurabayashi K., and Skerlos S. J., Sens. Actuators, B , 356 (2004). 10.1016/j.snb.2003.10.010 [DOI] [Google Scholar]
- 33. Kummrow A., Theisen J., Frankowski M., Tuchscheerer A., Yildirim H., Brattke K., Schmidt M., and Neukammer J., Lab Chip , 972 (2009). 10.1039/b808336c [DOI] [PubMed] [Google Scholar]
- 34. Mao X., Nawaz A. A., Lin S. S., Lapsley M. I., Zhao Y., McCoy J. P., El-Deiry W. S., and Huang T. J., Biomicrofluidics , 24113 (2012). 10.1063/1.3701566 [DOI] [PMC free article] [PubMed] [Google Scholar]
- 35. Godin J. and Lo Y., Biomed. Opt. Express , 1472 (2010). 10.1364/BOE.1.001472 [DOI] [PMC free article] [PubMed] [Google Scholar]
- 36. Wang Z., El-Ali J., Engelund M., Gotsaed T., Perch-Nielsen I. R., Mogensen K. B., Snakenborg D., Kutter J. P., and Wolff A., Lab Chip , 372 (2004). 10.1039/B400663A [DOI] [PubMed] [Google Scholar]
- 37. Watts B. R., Kowpak T., Zhang Z., Xu C., and Zhu S., Biomed. Opt. Express , 848 (2010). 10.1364/BOE.1.000848 [DOI] [PMC free article] [PubMed] [Google Scholar]
- 38. Watts B. R., Zhang Z., Xu C., Cao X., and Lin M., Biomed. Opt. Express , 2784 (2012). 10.1364/BOE.3.002784 [DOI] [PMC free article] [PubMed] [Google Scholar]
- 39. Watts B. R., Kowpak T., Zhang Z., Xu C., Zhu S., Cao X., and Lin M., Micromachines , 62 (2012). 10.3390/mi3010062 [DOI] [Google Scholar]
- 40. Rosenauer M., Buchegger W., Finoulst I., Verhaert P., and Vellekoop M., Microfluid. Nanofluid. , 761 (2011). 10.1007/s10404-010-0707-z [DOI] [Google Scholar]
- 41. Xia Y. N. and Whitesides G. M., Angew. Chem., Int. Ed. , 550 (1998). [DOI] [PubMed] [Google Scholar]
- 42. Li Q., Zhao Y., and Hu X., Proc. SPIE , 100240J (2016). 10.1117/12.2245995 [DOI] [Google Scholar]


