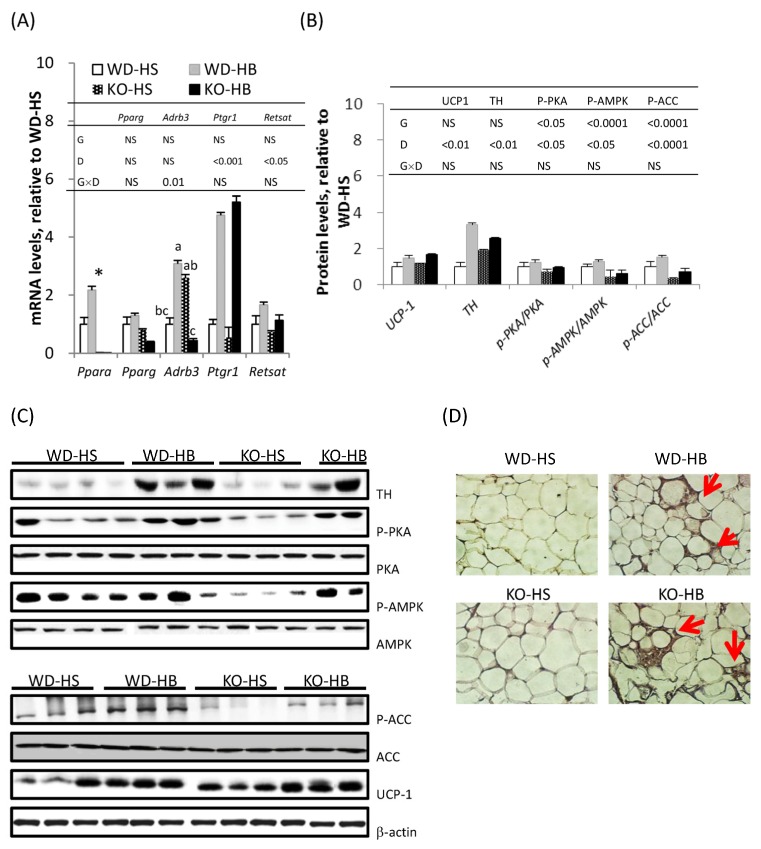
Figure 2.
Levels of mRNA (A) and proteins (B) serve as markers involved in β-adrenergic stimulation and white adipose tissue (WAT) browning in the inguinal fat of WD and KO mice fed HS or HB diet for 5 weeks; (C) representative picture of immunoblot; (D) immunohistochemical staining of uncoupled protein 1 (UCP-1) in inguinal fat. In (A,B), data are mean ± SEM, n = 8. Results of two-way ANOVA are shown in the tables (D, diet; G, genotype; D × G, interaction; NS, not significant). When there was a significant interaction between D and G, the significance of differences among groups was further analyzed by one-way ANOVA and Duncan’s multiple range test. a–c Values without a common superscript differed (p < 0.05). * Different from WD-HS, p < 0.05 (by Student’s t test). In (D), brown fat-like cells are indicated with arrowheads.

