Abstract
Trees present a life form of paramount importance for terrestrial ecosystems and human societies because of their ecological structure and physiological function and provision of energy and industrial materials. The genus Populus is the internationally accepted model for molecular tree biology. We have analyzed 102,019 Populus ESTs that clustered into 11,885 clusters and 12,759 singletons. We also provide >4,000 assembled full clone sequences to serve as a basis for the upcoming annotation of the Populus genome sequence. A public web-based EST database (populusdb) provides digital expression profiles for 18 tissues that comprise the majority of differentiated organs. The coding content of Populus and Arabidopsis genomes shows very high similarity, indicating that differences between these annual and perennial angiosperm life forms result primarily from differences in gene regulation. The high similarity between Populus and Arabidopsis will allow studies of Populus to directly benefit from the detailed functional genomic information generated for Arabidopsis, enabling detailed insights into tree development and adaptation. These data will also valuable for functional genomic efforts in Arabidopsis.
After the completion of the Arabidopsis genome sequence (1) and the publication of near-complete sequences of indica and japonica rice (2, 3), plant researchers have been able to scan these genomes to identify and compare genes of interest. Arabidopsis and rice represent the two major angiosperm phylogenetic groups, dicotyledons and monocotyledons, respectively. They diverged ≈170 million years ago (4) and differ in numerous physiological traits. Within these groups, however, great diversity also exists in life history and plant structure. Some of the most striking differences observed are those between woody (trees and shrubs) and herbaceous species. Trees and shrubs form hard, long-lasting structures that are distinct from the soft stems and branches of herbs, especially annuals. The lignocellulosic cell walls of trees and shrubs are critical for their survival, stature, competitive ability, and provision of habitat, and they have a dramatic influence on ecosystem cycles. Trees and shrubs are found intermixed with herbaceous plants in many phylogenetic groups within the angiosperms, showing that the tree growth habit has been lost or acquired many times during evolution (5). The herbaceous life form is often considered to be the derived state, evolving numerous times from tree-like ancestors (6).
The tree life form imposes several different physiological and morphological constraints compared with those of herbaceous plants. Many of the processes that distinguish trees from herbs take years to fully develop and express themselves (e.g., wood formation, vegetative phenology, maturation, and the juvenility/maturity transition) and are therefore not easily studied in herbs. The need for a tree model system for functional genomics has therefore become evident (7). The genus Populus, consisting of ≈40 species distributed in diverse habitats throughout the northern hemisphere, best fulfills the criteria for a good model tree. It has a small genome (slightly bigger than rice), diploid inheritance, facile clonal propagation, and rapid growth, and it is amenable to transformation by Agrobacterium (8). Its genome has now been shotgun sequenced (to >7 times coverage) by the U.S. Department of Energy (www.jgi.doe.gov), and the assembly and annotation is expected to be ready during 2004. Modeled after similar efforts in Arabidopsis, the International Populus Genome Consortium (www.ornl.gov/ipgc) (9) was established to provide coordination of postsequence research activities and education throughout the world. A critical remaining need for Populus, as a model organism, is high-quality sequence annotation. We describe EST resources that are essential for this goal.
Materials and Methods
EST Sequencing, Clustering, and Annotation. In total, >140,000 sequence reads were retained for clustering and assembly. In addition to sequences presented previously (10, 11), ESTs were generated from 16 new cDNA libraries. Sequences were run on Beckman SEQ2000, MegaBACE, ABI3700, and ABI377. The 5′ and 3′ end sequences from the confirmatory resequencing of the clones selected for microarray production (12, 13) were also included in the assembly. Sequence reads obtained from the ABI3700 and ABI377 sequencers were base-called by using tracetuner (www.paracel.com). Because of incompatibility problems with tracetuner, sequences obtained from the Beckman and Mega-BACE sequencers were base-called with phred v. 000925.c (www.phrap.org). All sequence information has been submitted to Gen-Bank.
Filtering, clustering, and assembly of EST sequences were performed with the paracel transcriptassembler program (www.paracel.com), which integrates quality filtering, clustering, and assembly into one single pipeline. The filtering step includes masking of vector sequence and low-quality regions and annotation of low-complexity regions, repeats, and poly(A) regions. A hash search algorithm was used to remove contaminating sequences. The algorithm initially uses a hash lookup, followed by a gapless hit extension. Several hits to the same subject were tiled to obtain a final raw score. Four reference database collections were searched, with score parameters match = 1, mismatch = –9, to remove unwanted sequences. Arabidopsis mitochondrial and chloroplast sequences (score threshold = 100), Escherichia coli sequences (threshold = 40), and Arabidopsis rRNA sequences (threshold = 35) were removed. Finally, ESTs that passed the filters but had an unmasked sequence <70 bases were discarded. After filtering, assembly, and clustering, the output contained 102,019 ESTs in addition to 10,782 3′ sequences and 8,140 5′ sequences derived from confirmation of microarray clones. In the clustering step, each sequence was initially sorted into a unique cluster. The reads were pairwise compared, and clusters were merged if the sequences showed sufficient similarity (85.7% identity, which corresponds to threshold >50, match = 1, mismatch = –6). A total of 11,891 clusters and 12,767 singletons (clusters with one sequence) were obtained. The assembly step uses CAP4, which is a refinement of the CAP3 algorithm (14). Each cluster was assembled into contigs representing unique transcripts, producing 15,574 contigs and 6,804 singlets (contigs containing only one sequence). The resulting sequences (contigs, singlets, and singletons) were annotated according to our annotation pipeline (11) as noted in populusdb.
Assembled Full Clone (AFC) Sequences. All contigs covered by both the 5′ and the 3′ end of the same clone were extracted. In many cases, the 5′ and 3′ sequences did not overlap, but other ESTs spanned the region between these sequences. The resulting 4,166 sequences were compared against the Arabidopsis proteome by using blastx (15) with default parameters.
Library Comparisons. Dendrograms and clustered correlation maps were prepared following procedures described by Ewing et al. (16). First, an expression profile was constructed by counting the number of ESTs in each cluster. The ESTs were classified according to their libraries, giving 18 counts for each cluster. Clusters containing <10 ESTs were removed from the subsequent analysis, giving a final data matrix with 1,475 rows, corresponding to clusters, and 18 columns.
The similarity between clusters and libraries was estimated by Pearson's correlation coefficient, giving matrices of correlation values. From these matrices, the Euclidean distance between each pair of object was calculated. Dendrograms were constructed from the pairwise distances with the UPGMA algorithm. The original data set was reordered based on the ordering in the dendrograms, so that the most similar objects were adjacent to one another in the correlation map. The entire procedure was performed with the r software package (www.r-project.org).
Calculation of Codon Usage. From the AFC sequences, a high-quality data set suitable for determination of codon usage was derived. A set of 2,000 sequences with a blastx score against the Arabidopsis proteome higher than 450 were chosen, and each alignment was manually inspected. Criteria for inclusion in the high-quality data set were the following: (i) the translated Populus sequence should have high similarity up to the C terminus of an annotated Arabidopsis protein (maximum 10 amino acids of the Arabidopsis protein unaligned by blast); (ii) the Populus sequence should end with an in-frame stop codon at a position similar to the Arabidopsis gene; (iii) a maximum of 50 amino acids should be unaligned at the N terminus of the protein; and (iv) the Populus sequence should start with a start codon at a position similar to the Arabidopsis gene, unless the Populus sequence was clearly not full-length. The reason for allowing more discrepancy at the N terminus was that signal peptides typically have much lower conservation than mature polypeptides. All sequences fulfilling these criteria should lack reading frame errors. They were put in a database and a codon usage table was created by using codonw (www.molbiol.ox.ac.uk/cu).
Results
EST Sequencing and Clustering. When defining gene sequences in a genome, ESTs are important for the training of gene prediction algorithms, for species-specific codon usage, and for the characterization of splice-site preferences. Predicted exons can be linked together into genes, and splice variants can then be detected. In addition, if EST data sets are large and have been derived from multiple nonnormalized libraries, they can be used to obtain digital expression profiles, providing information on the tissues and conditions in which genes are expressed.
We reported 5′ sequences of three cDNA libraries from different tissues of Populus (10, 11) and set up an annotation pipeline for the ESTs (11). Here, we have extended this to reach a total of 18 nonnormalized cDNA libraries, plus one partially subtracted library. These libraries represent either different tissues or different experimental treatments (Table 1). The libraries were derived from several taxa of Populus, aspen (Populus tremula), a hybrid aspen (P. tremula × tremuloides T89), and black cottonwood (Populus trichocarpa). A detailed description of the source material for the libraries can be found in Table 3, which is published as supporting information on the PNAS web site.
Table 1. Overview of the EST data set.
| Tissue | Code | Populus genotype | ESTs, n | Average length,* bp |
|---|---|---|---|---|
| Cambial zone | A + B | tremula × tremuloides | 6,326 | 367 |
| Active cambium | UB | tremula | 4,647 | 366 |
| Dormant cambium | UA | tremula | 3,655 | 403 |
| Tension wood | G | tremula × tremuloides | 5,723 | 408 |
| Wood cell death | X | tremula × tremuloides | 4,867 | 548 |
| Young leaves | C | tremula × tremuloides | 5,013 | 351 |
| Senescing leaves | I | tremula | 5,726 | 366 |
| Cold-stressed leaves | L | tremula × tremuloides | 4,066 | 448 |
| Dormant buds | Q | tremula | 5,815 | 558 |
| Petioles | P | tremula | 6,443 | 559 |
| Virus/fungal-infected leaves | Y | tremula | 1,395 | 438 |
| Floral buds | F | trichocarpa | 6,760 | 351 |
| Female catkins | M | trichocarpa | 6,112 | 553 |
| Male catkins | V | trichocarpa | 4,855 | 485 |
| Apical shoot | K | tremula × tremuloides | 5,380 | 481 |
| Shoot meristem | T | tremula × tremuloides | 8,371 | 535 |
| Bark | N | tremula × tremuloides | 4,891 | 548 |
| Roots | R | tremula × tremuloides | 5,786 | 593 |
| Imbibed seeds | S | tremula | 6,188 | 502 |
The part of the sequences that passed the paracel transcriptassembler filters. The average read length has increased substantally during the course of this work.
A total of 102,019 EST sequences were clustered by using paracel transcriptassembler to generate a nonredundant set of genes that could be used to select clones for microarray construction. To improve the clustering, several sequences were added to the EST data set. First, sequences from confirmatory sequencing of earlier microarrays (12, 13) were added. The clustering output contained 10,782 3′ sequences and 8,140 5′ sequences with that origin. Second, Populus sequences in public databases and several full-length sequences from work in our laboratories were also included. The clustering resulted in 12,759 singletons and 11,885 clusters, further divided into 15,574 contigs and 6,804 singlets. Clustering did not discriminate between P. trichocarpa and P. tremula/tremuloides sequences; of the 4,456 clusters containing P. trichocarpa ESTs, 86% also contained ESTs from aspen/hybrid aspen. Manual inspection of species-specific contigs within the same clusters, presumably originating from orthologous genes from the two species, showed that coding sequences were almost identical (typically >98%), whereas UTRs could show much higher sequence variation. Most of the 11,885 clusters appear to correspond to single genes, whereas the contigs and singlets within clusters appear to largely consist of splice variants, paralogs, alleles, or cloning artifacts. However, very closely related genes also clustered together in several cases. Our experience from the 3′ sequencing of 11,175 ESTs demonstrated that the true number of genes represented is substantially lower than the number of clusters and singletons. The complete unigene set is currently undergoing 3′ sequencing, which in addition to the genome sequence will allow more accurate estimates of the true number of genes covered by our data set.
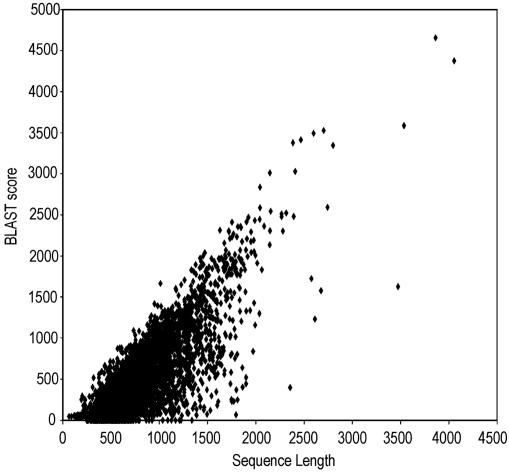
Comparison of Populus and Arabidopsis Gene Content. For a reliable comparison between Populus and Arabidopsis genes, we extracted a set of 4,166 contig sequences where the full insert of one clone was covered by ESTs. Although cDNAs could be incomplete, this set represents a data set with multiple sequence coverage and therefore higher quality than the ESTs alone. These AFC sequences (see Table 4, which is published as supporting information on the PNAS web site) had an average length of 820 bases and were compared with the Arabidopsis proteome by using blastx. Sequences <300 bp (typically representing only the 3′ UTR) showed, as expected, very low similarity to Arabidopsis proteins (Fig. 1). For sequences exceeding 300 bp, a strong correlation occurred between sequence length and blastx score. For example, if only sequences >1,000 bp were considered, 97.9% had a blastx score > 100, and 95.0% were >200 (1,089 and 1,056 of 1,112, respectively). For sequences >1,500 bp, 98.8% (237 of 240) had a blastx score >200. Eight of the 23 AFC sequences >1,000 bp with least similarity to Arabidopsis (blastx score <100) were false positives. Four of them were found in other annotations of the Arabidopsis genome, and four others were in a cluster where another contig had a strong hit to an Arabidopsis protein. In summary, only 15 (1.3%) of the AFC sequences (Table 5, which is published as supporting information on the PNAS web site) lacked an apparent homolog in Arabidopsis. However, all of them were present in the Populus genomic sequence (http://genome.jgi-psf.org/poplar0/poplar0.home.html)
Fig. 1.
Relation between sequence length of Populus contigs and similarity to the best scoring Arabidopsis sequence. AFC Populus sequences (4,166) were compared by using blastx with the Arabidopsis proteome, and the score for each sequence was plotted against sequence length.
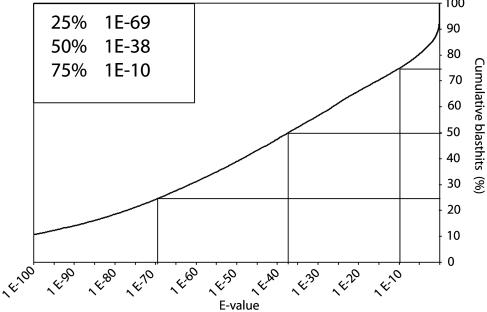
The 2,506 AFC sequences with blast scores <100 toward the Arabidopsis proteome were also compared with the Arabidopsis genomic sequences by using tblastx. Only five sequences scored higher to the translated genome than to the proteome, indicating that the number of novel Arabidopsis genes that could be predicted by using Populus ESTs is low, but we have found cases where Arabidopsis gene models probably could be improved by using the Populus data. We also compared all genes in the Arabidopsis genome with our data set by using tblastn. Nearly 50% of all predicted Arabidopsis proteins had a match with an E value <10–38, and 75% had a match with an E value <10–10 (Fig. 2). No established criterion of similarity (blast scores or E values) can distinguish orthologs within gene families, but these figures show that most Arabidopsis genes or gene families have a homolog represented in our database.
Fig. 2.
Homologs to most Arabidopsis gene families are represented in populusdb. The cumulative curve indicates the percentage of genes in the Arabidopsis genome that has sequence similarity better than the value given to a sequence in populusdb. For example, 50% of the genes have a hit with an E value <10–38 and 75% have a hit with an E value <10–10.
Taken together, a very low percentage of genes in Populus do not have a close homolog in Arabidopsis, and the majority of the Arabidopsis gene families have a counterpart in Populus. The genome size of Populus is ≈500 Mbp, but the gene density is not yet known. Manual inspection of selected gene families that are well represented by ESTs indicates that some, but far from all, Populus gene families are larger than those of Arabidopsis. For example, one of the best characterized gene families in plants, the Lhc genes (including PsbS and ELIP) contain 23 copies in Arabidopsis and at least 27 copies in Populus.
The Coding Content of the Populus Genome. We annotated the ESTs by using a previously developed annotation pipeline (11), where information is retrieved from several databases and integrated into populusdb. From the best Arabidopsis match, a functional classification is retrieved from the Munich Information Center for Protein Sequences (MIPS) database (mips.gsf.de). The list of sequences, with annotations and functional classifications, is found in Table 6, which is published as supporting information on the PNAS web site. Both the annotations and functional classifications will be subjected to manual curation, according to the modified MIPS functional classification scheme Umeå Plant Science Center-MIPS (www.populus.db.umu.se). populusdb should be continuously updated as the curation of annotations and classifications progress.
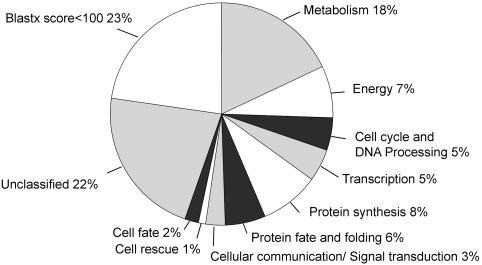
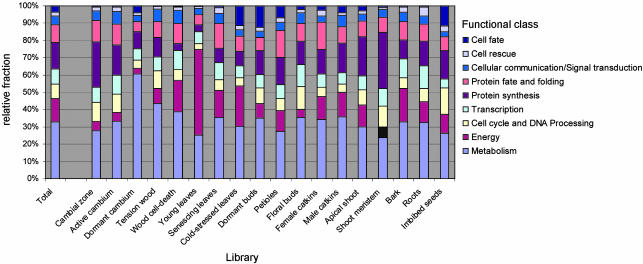
Because of low sequence similarity (blast score <100), 23% of our ESTs were not classified (class 99), and another 22.5% were most similar to an Arabidopsis protein of unknown function (class 98). From the whole data set (Fig. 3), classifications of subsets can be extracted: We previously compared the functional classifications of ESTs from young and senescing leaves (11). In Fig. 4, the frequency of clones (excluding the noninformative classes 98 and 99) in each main Umeå Plant Science Center-MIPS category in the different libraries, are shown. Most libraries had a distinct pattern of gene expression. For example, genes from the class “protein synthesis” were most abundant in the libraries from the shoot meristem, cambial zone, and apical shoot, whereas genes from the class “energy” dominated the young leaf library, and genes from the class “cell cycle and DNA processing” were most frequently detected in the imbibed seeds library.
Fig. 3.
Functional classification of the Populus EST data set according to the Umeå Plant Science Center-MIPS classification schedule
Fig. 4.
Relative abundance of clones in functional classes (excluding clones without significant homology to a protein with a predicted function (classes 98 and 99) in the different libraries.
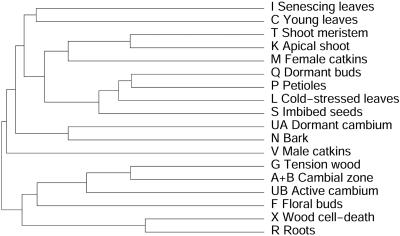
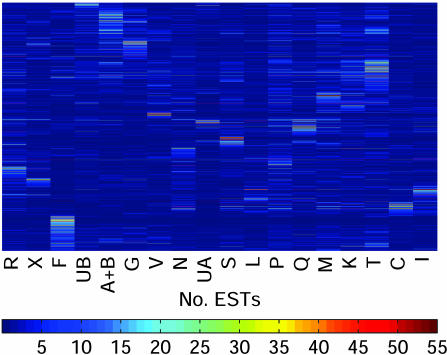
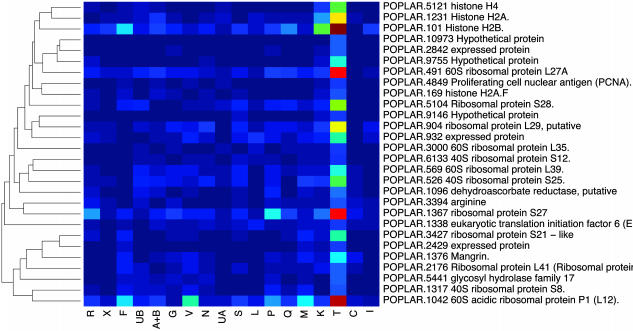
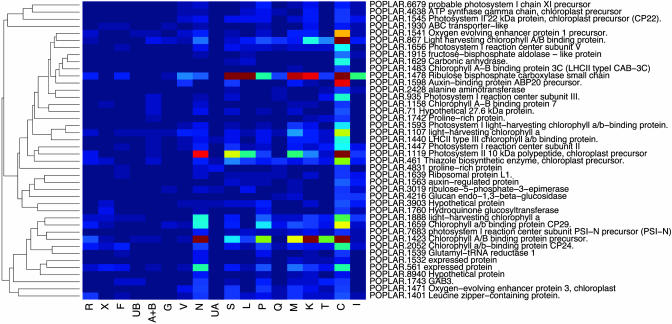
An Expression Catalog of Populus Tissues. EST frequencies approximate message abundance in the mRNA population used to construct a cDNA library (11). Clusters containing >10 ESTs were subjected to a cluster correlation analysis (16) to compare expression profiles in the different libraries. One of the libraries (Y, from virus- and fungus-infected leaves) is a partially normalized library and was excluded from this analysis. When the result was displayed in the form of a dendrogram (Fig. 5), many libraries with similar origins clustered together (e.g., young and senescing leaves, and apical shoot and shoot meristem). Three of the four libraries derived from the wood-forming zone of the stem (cambial zone, active cambium, and tension wood) clustered together, but the fourth (dormant cambium) was most similar to the bark library. Genes that have similar functions were generally clustered together in the cluster correlation map (Fig. 6). One cluster, most enriched in apical meristems, contained genes encoding histone and ribosomal proteins (Fig. 7), whereas another, most enriched in young leaves, contained mainly genes encoding proteins involved in photosynthesis (Fig. 8). Evidently, mining of populusdb gives an estimate of the tissue specificity and expression level for most genes with high or moderate expression. Comparison of the different libraries revealed only 26 genes that were found in all 18 libraries. These “housekeeping genes” (see Table 7, which is published as supporting information on the PNAS web site) included, for example, four ribosomal proteins, polyubiquitin, CuZn-SOD, calmodulin, and one storage protein (annotated as pollen coat protein) and, somewhat surprising, one sequence most similar to an Arabidopsis protein with unknown function related to the systemic acquired resistance-related protein SRE1a from potato.
Fig. 5.
Dendrogram representation of the similarities in expression profiles for the Populus libraries, based on a clustered correlation map calculated according to Ewing et al. (16).
Fig. 6.
The complete clustered correlation map calculated according to Ewing et al. (16). Only clusters with >10 ESTs were included.
Fig. 7.
Subsection of the clustered correlation map, showing a cluster mainly containing genes encoding histone and ribosomal proteins.
Fig. 8.
Subsection of the clustered correlation map, showing a cluster mainly containing genes encoding photosynthetic proteins.
Codon Usage. Accurate gene prediction based on genome sequence requires knowledge of codon usage. To generate a high-quality data set of correct sequences for this purpose, we selected from the AFC sequences a smaller data set containing only sequences highly similar to an Arabidopsis protein throughout its whole length. The criterion was used to ensure that no sequences containing reading frame errors were included in the analysis. From this data set, containing 873 sequences (206,763 codons), ORFs were defined and a codon usage table was created (see Table 8, which is published as supporting information on the PNAS web site).
As expected, the codon usage of Populus shared many similarities with that of Arabidopsis and other dicots. For example, T is the preferred base in the third codon position for all amino acids except glycine, and TGA is the preferred stop codon occurring in 44% of the sequences. However, one difference was evident. Arabidopsis shows a very mild suppression of the CG dinucleotide in the last two codon positions (XCG/XCC = 0.92), whereas the corresponding figure in Populus was 0.38. CG suppression is most likely a consequence of methylation of C in the CG dinucleotide, resulting in an increased mutation rate. CG suppression is very common in dicot genomes; tomato has an XCG/XCC ratio of 0.58, pea 0.51, soybean 0.37, potato 0.48, and spinach 0.42. The GC content in third base position was similar in Populus and Arabidopsis (44 vs. 42%).
Discussion
Large-scale EST sequencing provides a gateway into the genome of an organism. The ESTs give important information about its coding content and expression patterns in different tissues and environments. Our data set comprises >100,000 ESTs and a unigene set with 11,885 clusters and 12,759 singletons. These sequences represent a substantial part of the complete gene content in Populus, although it would be premature to estimate the total number of genes represented. We provide a data set of >4,000 full-clone sequences for training of gene prediction algorithms and a codon usage table based on 873 ORFs. All these data are essential for accurate annotation of the Populus genome sequence.
The EST resource and populusdb will play important roles when the genomic sequence is complete and released. By using a common gene nomenclature and direct links, researchers will be able to rapidly learn about tissue specificity and expression level of a considerable fraction of Populus genes. Mining of populusdb for specific orthologs will also give researchers working with other plant species information about tissue specificity. We have established a platform for transcript analysis with cDNA microarrays that contain >13 000 clones (13); and using the data set presented here, we have increased the number of clones on microarrays to almost 25,000 (the list of selected clones is found in Table 9, which is published as supporting information on the PNAS web site). We have also shown that Populus species are highly conserved in DNA sequence, and in preliminary studies have found that the DNA microarrays can be effectively hybridized with RNA prepared from different Populus species and related genera, including Salix viminalis and Salix caprea (Salicaceae). This finding means that these genomic tools can be used within the entire family Salicaceae and genus Populus, both of which contain extensive genetic and adaptive diversity (7). The Populus genome sequence, populusdb, and the rapid progress in Populus metabolomics, proteomics, and reverse genetics are establishing Populus as one of the most versatile model systems for plant genomics (7, 9).
Populus and its genomic resources will aid in fundamental genomic studies of plants. We demonstrated that gene content is very similar between Populus and Arabidopsis. Nearly all gene families found in one of the species have a homolog in the other. This high degree of similarity means that Arabidopsis may not have lost as many genes during its evolution as had been suggested (5–10%) (17). However, analyses of gene content based on ESTs are inherently difficult because ESTs cover only the nonconserved parts of genes and may include large numbers of contaminant sequences; ≈1% of the Arabidopsis ESTs in public databases do not have a match in the Arabidopsis genome (18). The extensive similarity between the Populus and Arabidopsis genomes will make it possible to use these two plant model systems in parallel when gene function is studied. The rapid life cycle and amendable genetics of Arabidopsis makes it a superior system for the majority of fundamental genomic studies. However, the unique features of a tree system (e.g., the large size that makes tissue separation easier, wood formation, seasonal growth/hardiness patterns, longevity, and phase change) means that studies in Populus could complement, and will, in some cases, replace studies in Arabidopsis where organismal traits are concerned. In gene families with a complicated structure, orthologs may be hard to identify between Populus and Arabidopsis. However, for most genes, we expect that phylogenetic analysis will make relationships clear. Moreover, with the Populus physical map now being generated (7), microsynteny (19) will provide important independent clues to orthology.
Populus genomic resources provide major new opportunities to study adaptive evolution in plants. Because Populus species have extensive natural populations and some of the widest distributions of any plant species (7), they contain enormous natural genetic variation within and between species, populations, and genotypes. Some taxa grow in extremely hot and arid conditions, whereas others survive extreme frost in arctic regions. Populus is an out-crossing (largely dioecious) tree that shows very little population differentiation (20), whereas Arabidopsis is an annual, often inbreeding species that shows fine-scale ecological differentiation. Their comparison should give fresh insights into the diversity of mechanisms for adaptive evolution.
Supplementary Material
Acknowledgments
We thank Thomas Hiltonen, Susanne Larsson, and Carl Zingmark for their essential contributions and Bahram Amini, Alexander Makoveychuk, Roberth Byström, Harry Björkbacka, Pia Harryson, Magnus Hertzberg, Vaughan Hurry, Anneli Johansson, Ewa Mellerovicz, Linda Renberg, Praveen Sirikumara, and Hannele Tuominen for their involvement in different steps of this work. The research was supported by the Knut and Alice Wallenberg Foundation, the Foundation for Strategic Research, the Swedish Research Council, Kempestiftelserna, and the Swedish Research Council for the Environment, Agricultural Sciences, and Spatial Planning.
This paper was submitted directly (Track II) to the PNAS office.
Abbreviations: MIPS, Munich Information Center for Protein Sequences; AFC, assembled full clone.
Data deposition: All EST sequences reported in this paper have been deposited in the GenBank database (accession nos. can be found in Table 2, which is published as supporting information on the PNAS web site).
References
- 1.The Arabidopsis Genome Initiative (2000) Nature 408, 796–815. [DOI] [PubMed] [Google Scholar]
- 2.Yu, J., Hu, S., Wang, J., Wong, G. K.-S., Li, S., Liu, B., Deng, Y., Dai, L., Zhou, Y., Zhang, X., et al. (2002) Science 296, 79–92. [DOI] [PubMed] [Google Scholar]
- 3.Goff, S. A., Ricke, D., Lan, T. H., Presting, G., Wang, R., Dunn, M., Glazebrook, J., Sessions, A., Oeller, P., Varma H., et al. (2002) Science 296, 92–100. [DOI] [PubMed] [Google Scholar]
- 4.Wikström, N., Savolainen, V. & Chase, M. V. (2001) Proc. R. Soc. London Ser. B 268, 2211–2220. [DOI] [PMC free article] [PubMed] [Google Scholar]
- 5.Bohle, U.-R., Hilger, H. & Martin, W. F. (1996) Proc. Natl. Acad. Sci. USA 93, 11740–11745. [DOI] [PMC free article] [PubMed] [Google Scholar]
- 6.Sporne, K. R. (1980) New Phytol. 85, 419–445. [Google Scholar]
- 7.Brunner, A. M., Busov, V. & Strauss, S. H. (2004) Trends Plant Sci. 9, 49–56. [DOI] [PubMed] [Google Scholar]
- 8.Bradshaw, H. D., Ceulemans, R., Davis, J. & Stettler, R. (2000) J. Plant Growth Regul. 19, 306–313. [Google Scholar]
- 9.Wullschleger, S. D., Jansson, S. & Taylor, G. (2002) Plant Cell 14, 2651–2655. [DOI] [PMC free article] [PubMed] [Google Scholar]
- 10.Sterky, F. Regan, S., Karlsson, J., Hertzberg M., Rohde, A., Holmberg, A., Amini, B., Bhalerao, R., Larsson, M., Villarroel, R., et al. (1998) Proc. Natl. Acad. Sci. USA 95, 13330–13335. [DOI] [PMC free article] [PubMed] [Google Scholar]
- 11.Bhalerao, R., Keskitalo, J., Sterky, F., Erlandsson, R., Björkbacka, H., Jonsson Birve, S., Karlsson, J., Gardeström, P., Lundeberg, J., Gustafsson, P., et al. (2003) Plant Physiol. 131, 430–442. [DOI] [PMC free article] [PubMed] [Google Scholar]
- 12.Hertzberg, M., Aspeborg, H., Schrader, J., Blomqvist, K., Andersson, A., Bhalerao, R., Marchant, A., Bennett, M., Uhlen, M., Teeri, T. T., et al. (2001) Proc. Natl. Acad. Sci. USA 98, 14732–14737. [DOI] [PMC free article] [PubMed] [Google Scholar]
- 13.Andersson, A., Keskitalo, J., Sjödin, A., Bhalerao, R., Sterky, F., Wissel, K., Tandre, K., Aspeborg, H., Moyle, R., Ohmiya, Y., et al. (2004) Genome Biol., in press. [DOI] [PMC free article] [PubMed]
- 14.Huang, X. & Madan, A. (1999) Genome Res. 9, 868–877. [DOI] [PMC free article] [PubMed] [Google Scholar]
- 15.Altschul, S. F., Gish, W., Miller W., Myers, E. W. & Lipman, D. J. (1990) J. Mol. Biol. 215, 403–410. [DOI] [PubMed] [Google Scholar]
- 16.Ewing, R. M., Kahla, A. B., Poirot, O., Lopez, F., Audic, S. & Claviere, J.-M. (1999) Genome Res. 9, 950–959. [DOI] [PMC free article] [PubMed] [Google Scholar]
- 17.Allen, K. (2002) Proc. Natl. Acad. Sci. USA. 99, 9568–9572. [DOI] [PMC free article] [PubMed] [Google Scholar]
- 18.Zhu, W., Schlueter, S. D. & Brendel, V. (2003) Plant Physiol. 132, 469–484. [DOI] [PMC free article] [PubMed] [Google Scholar]
- 19.Stirling, B., Yang, Z., Gunter, L., Vrebolav, J., Tuskan, G. & Bradshaw, T. (2003) Can. J. For. Res. 33, 2245–2251. [Google Scholar]
- 20.Petit, R., Aguinagalde, I., de Beaulieu, J.-L., Bittkau, C., Brewer, S., Cheddadi, R., Ennos, R., Fineschi, S., Grivet, D., Lascoux, M., et al. (2003) Science 300, 1563–1565. [DOI] [PubMed] [Google Scholar]
Associated Data
This section collects any data citations, data availability statements, or supplementary materials included in this article.


