

Abstract
Purpose
To improve understanding of dry eye disease and highlight a subgroup of patients who have a component of central sensitization and neuropathic pain contributing to their condition.
Methods
Prospective, cross-sectional, IRB-approved study comparing isolated dry eye disease (n=48) to fibromyalgia (positive control; n=23) and healthy (negative control; n=26) individuals with ocular surface examination, corneal confocal microscopy, quantitative sensory testing, and self-reported ocular symptoms and systemic associations. A subset of patients also underwent skin biopsy and/or brain neuroimaging. Dry eye patients were split into concordant (ie, those with dry eyes on examination) and discordant (ie, those with dry eye symptoms but normal examination) subgroups for further analysis. We hypothesized that on the systemic measures included, concordant patients would resemble healthy controls, whereas discordant patients would show evidence of centralized mechanisms similar to fibromyalgia.
Results
Schirmer test and Ocular Surface Disease Index (OSDI) scores indicated significant decreases in tear production (Schirmer: healthy, 18.5±8.2 mm; dry, 11.2±5.4 mm; fibromyalgia, 14.4±7.5; P<.001) and increases in self-reported dry eye symptoms (OSDI: healthy, 1.9±3.0; dry, 20.3±17.7; fibromyalgia, 20.3±17.1; P<.001) in the dry eye and fibromyalgia patients, compared to controls. The discordant subgroup had decreased corneal nerve density and decreased visual quality-of-life scores, similar to patients with fibromyalgia. Concordant patients were more similar to healthy controls on these measures.
Conclusions
Individuals with discordant dry eye may have a central pathophysiologic mechanism leading to their eye pain symptoms, which could be an important factor to consider in treatment of chronic idiopathic dry eye.
INTRODUCTION
Patients with conditions of uncertain etiology represent challenges to nearly all medical specialties, and the treatment of dry eye disease (DED) has been a prominent subject of ongoing debate in ophthalmology. Strong evidence from other disciplines supports the idea that changes in the central nervous system (CNS) underlie a variety of conditions that entail the experience of pain and other irritative symptoms, sometimes diffusely throughout the body (eg, fibromyalgia [FM]), but in other cases only in fairly distinct body regions (eg, irritable bowel syndrome, temporomandibular disorders, interstitial cystitis/bladder pain syndrome).1–3 Studies have revealed numerous common biological mechanisms that unite these seemingly disparate conditions, most of which involve perturbations in the CNS, leading to the perceptual amplification of pain and other sensory information.1,4–6 We hypothesize that there is a subset of patients with DED who have the ophthalmic equivalent of a regional chronic pain syndrome, complete with this spectrum of systemic pain and sensory amplification mechanisms known to be operative in FM and related centralized conditions.7–10 We therefore expect that the subset of DED patients complaining of ocular surface symptoms in the absence of clinical ocular surface pathology will have evidence of centralized mechanisms contributing to their condition. In order to investigate these associations, we performed a cross-sectional study examining the ophthalmic and systemic findings of a cohort of patients with dry eye complaints, and compared them to both a “positive control” cohort of patients with FM and a “negative control” cohort of healthy individuals.
DRY EYE DISEASE
Dry eyes occur in 5% to 35% of the general population11–16 and are significantly more common in women (as are FM and related conditions).11–13,15 Dry eye disease has a substantial impact on quality of life by affecting visual acuity, social and physical functioning, and workplace productivity.17–22 Utility assessment shows that patients with moderate to severe dry eyes have a quality of life similar to patients with moderate to severe angina or who undergo hospital dialysis.23,24 There is also significant societal economic burden associated with dry eyes, with associated costs estimated at approximately $55.4 billion per year in the United States.25,26
Our current understanding of the pathophysiology of DED is incomplete. Much research has been devoted to improving our understanding of DED,27,28 and there is evidence for the roles of the tear film,29–37 lacrimal gland,38–41 ocular surface epithelium,42–44 meibomian glands,45–48 and inflammation30,40,41,49–52 in the pathophysiology of dry eyes. The current definition of DED from the International Dry Eye Workshop (2007) incorporates these various elements: “Dry eye is a multifactorial disease of the tears and ocular surface that results in symptoms of discomfort, visual disturbance, and tear film instability with potential damage to the ocular surface. It is accompanied by increased osmolarity of the tear film and inflammation of the ocular surface.”53 Although comprehensive, this definition highlights the fact that there are no simple diagnostic criteria for DED, a hindrance for clinicians and researchers who strive to find better treatments for patients with dry eyes. The Dry Eye Workshop’s updated classification scheme for dry eye is quite intricate in combining etiology, mechanisms, and disease stage and further underscores the complexity of the condition.53
Intact corneal sensation is known to be critical in maintaining a healthy ocular surface, since corneal nerves have direct trophic effects that nourish the corneal epithelium and are required for maintaining the normal reflex arc to the lacrimal gland for regulating the amount and quality of tears produced.39,54–57 There is evidence to indicate altered corneal sensation in patients with DED.54–56,58–62 Further, we might expect structural alterations of the corneal nerves in relation to ocular surface disorders. Corneal confocal microscopy (CCM) can be used to directly image the cornea at the cellular level, including the sub-basal nerve layer, in individuals with dry eyes44,63–67 and a variety of systemic conditions.68–76 Studies using CCM have confirmed altered sub-basal nerve density in patients with DED.44,56,63–66,68–70 The sources of these alterations are unclear and could represent either a peripheral nerve response to local ocular surface changes or “top-down” peripheral nerve changes resulting from CNS pathology, as is seen in other chronic pain states.77–79 In this study, we assess corneal sensation and corneal nerve morphology in our three patient cohorts.
Dry eye disease may be induced by a variety of different mechanisms and therefore could be thought of as a collection of diverse pathologies that lead to common symptoms of perceived ocular dryness and irritation. Dry eye disease is characterized by inconsistency of disease findings with variations in symptom intensity over time and under different conditions.80–84 There is also a known lack of concordance between patient-reported symptoms and clinically measurable signs in some cases.80,81,83,85–97 In clinical practice it is common to see patients with no clinical evidence of dry eyes who are highly symptomatic or, conversely, those who have minimal symptoms despite visible damage to the ocular surface. We suspect this discordance might be an important consideration in the evaluation and treatment of patients with DED, but it is still unclear what causes the perception of dry eyes in cases with normal tear production and no damage to the ocular surface.
Prior research in DED pathophysiology has focused primarily on the complexities of the ocular surface and the local interactions that contribute to ocular dryness. This study addresses the possibility that a subset of patients diagnosed with DED actually have what we term irritable eye syndrome, a condition that involves not only peripheral changes but also alterations in the CNS that lead to more systemic symptoms. Many pain conditions that were once thought to be solely peripherally driven, such as osteoarthritis and chronic low back pain, are also now categorized as mixed pain states.10,98 This term is used because the pain and other symptoms seen in these conditions had previously been thought to be exclusively or largely due to local factors in the joints or back, in spite of the fact that clinical findings (ie, radiographs or magnetic resonance images [MRIs]) correlate very poorly with the presence and severity of pain in these conditions. A more contemporary view is that peripheral-nociceptive factors play a prominent role in causing pain and other symptoms in some individuals with these disorders, but that in others neural mechanisms, especially augmented pain processing by the CNS (eg, central sensitization), can also play a major role.6,99–102 In this study, we use techniques commonly utilized by chronic pain researchers to test for evidence of centralized, chronic pain–like changes in individuals with DED, which we expect to observe in the subgroup of patients whom we have identified as discordant (ie, those whose self-reported dry eye symptoms are out of proportion to their clinical signs of ocular surface dryness).
CENTRALIZED PAIN SYNDROMES
Centralized pain and sensory amplification are underlying mechanisms in many chronic pain conditions. We use the term centralized pain to describe CNS dysfunction or pathology that may contribute to the development or maintenance of chronic pain. The symptoms experienced by individuals with central pain syndromes have been well characterized and consist of multifocal pain (with a high current and lifetime history of pain in many bodily regions) and a cluster of co-occurring somatic symptoms (ie, fatigue, sleep disturbances, memory difficulties).1,2,79,103,104 The leading pathogenic theory that couples somatic symptoms and higher-than-expected rates of mood disorders with centralized pain states is that centrally acting neurotransmitters that play a role in modulating pain (eg, low levels of norepinephrine, GABA, and serotonin, high levels of glutamate and substance P) also play prominent roles in controlling sleep, mood, and alertness.1,105 Overwhelming evidence reveals that what is often labeled as a localized chronic regional pain syndrome is upon closer evaluation a chronic multisymptom illness, where the pain occurs at different places in the body at different times and is given different names by different subspecialists who focus on “their region” of the body.1,103,106,107
Recent research has improved the understanding of chronic pain pathogenesis in these pain states. Experimental sensory testing and functional neuroimaging studies suggest that both animals and humans display wide individual variation in pain and perceptive sensitivity that adheres to a bell-shaped distribution. Individuals with a variety of chronic pain states occupy the right side of this distribution, displaying hyperalgesia (increased pain to normally painful stimuli) and/or allodynia (pain in response to normally nonpainful stimuli).1,4,108 Some of the discrete conditions consistently identified as having diffuse allodynia include FM, irritable bowel syndrome, temporomandibular disorders, idiopathic low back pain, tension headache, interstitial cystitis, and vulvodynia.100,101,109–115 There has also been some suggestion that this pathophysiology may contribute to chronic eye pain.116
Fibromyalgia is a common centralized pain disorder (2% to 8% of the population)117,118 that is more prevalent in women and is defined by the presence of chronic widespread pain and increased tenderness to palpation in multiple discrete locations.119 The disorder is characterized by a global, increased pain response to nonpainful stimuli (allodynia) and to minimally painful stimuli (hyperalgesia) that results from dysfunctional pain filtering and subsequent amplification of pain signals within the CNS.120 Patients with FM additionally present with symptoms of fatigue, poor sleep, cognitive impairment, emotional dysregulation, and psychosocial difficulties.79,121–123 Fibromyalgia is an excellent example of a condition where peripheral pathology was initially suspected (ie, the term fibrositis was originally used), but is now known to be primarily due to CNS dysfunction. There are considerable data from a variety of sources that show central amplification of afferent sensory input and neuropathic pain in patients with FM. Studies have shown that patients with FM detect the presence of innocuous pressure, heat, or cold stimuli at similar levels as healthy controls; however, the threshold at which these stimuli are registered as unpleasant or painful is considerably lower in FM patients.124–126 Along with the increased responsiveness to pressure-pain sensation and generalized tenderness that are known hallmarks of FM, studies have shown increased sensitivity to other sensory stimuli, including auditory tones, in these patients.120,127,128
In addition to having widespread pain and other somatic symptoms, individuals with FM and other centralized pain conditions have significant ocular symptoms, often in the absence of clinical signs of ocular surface dryness.129–131 Recent studies that examined this phenomenon found that patients with FM have more dry eye symptoms than healthy controls.131–134 Interestingly, these individuals were found to have reduced corneal sensitivity as compared to controls,132 so we measured both corneal and systemic sensitivity in this study.
Brain neuroimaging studies provide further insight into the underlying CNS changes in FM and demonstrate significant structural and functional alterations in pain-related brain areas. Patients with FM exhibit macroscopic changes in gray matter volume in brain regions known to be involved in pain processing. These central morphological changes suggest that FM is rooted in organic neurobiological pathology.135,136 Patients with FM also have decreased gray matter in the thalamus, amygdala, insula, and cingulofrontal cortex, important regions that regulate descending analgesia pathways and emotional response pathways that are normally triggered in response to pain.137–139 Functional MRI (fMRI) studies have shown that standardized peripheral pain stimuli will increase cerebral blood flow in similar brain regions (including SI and SII cortices, superior temporal gyrus, insula, and putamen) in both FM and healthy control subjects, but that in FM subjects, these same brain regions are activated at much weaker stimulus intensity levels than in controls.121,125,140,141 Finally, increased resting brain network connectivity to pronociceptive brain areas and decreased connectivity to antinociceptive brain areas are also often present in individuals with FM.142–145
In addition to CNS changes and biochemical neuronal alterations, FM patients present with peripheral nerve changes that are measurable by skin biopsy: decreased nerve density, decreased axon diameter, simplified folding of unmyelinated Schwann cells, and increased ballooning of Schwann cells.146–152 Recently, CCM has been performed on patients with FM and has shown decreased nerve fiber density and nerve fiber diameter in patients with FM as compared to healthy controls.153 Although some investigators have suggested that the findings of peripheral nerve abnormalities in chronic pain states mean that these are solely responsible for pain and other symptoms, others have suggested that these peripheral changes might be due to functional reorganization of the peripheral nervous system and play little or no pathogenic role.146,154 Thus it remains unclear whether peripheral nerve changes are primary or secondary to CNS irregularities in this disease state. Fibromyalgia is now considered to be a mixed state disease, in which central brain changes and peripheral nerve morphological changes are present concurrently and are codependent.119,120,125
STUDY RATIONALE
There has been increasing interest in the role of centralized pain and central sensory amplification as a component in a subset of patients with DED. Prior research in dry eye pathophysiology has focused primarily on the complexities of the ocular surface and the local interactions that contribute to ocular dryness. We hypothesize that the inconsistencies seen on examination in a considerable proportion of patients with DED are actually due to CNS processing abnormalities that are responsible for the discordance between the severity of symptoms and the degree of damage seen on the ocular surface. This study aims to identify the subset of patients with DED who have pathology beyond the ocular surface that is similar to what is commonly observed in centralized pain states, such as FM. In this study, we focus on patients with symptoms of dry eye without known systemic conditions or any prior ocular surgery. We perform a cross-sectional clinical study with ophthalmic evaluations of dry eye and tests of centralized pain signs and symptoms in three patient cohorts: those with dry eye complaints, a “positive control” cohort with FM, and a “negative control” cohort of healthy individuals. We further categorize the subset of patients with dry eyes who have symptoms out of proportion to their clinical findings of ocular surface dryness, and identify them as having discordant DED, in order to assess this subgroup more closely.
METHODS
This cross-sectional, comparative case series was approved by the Institutional Review Board of the University of Michigan Health System and was registered with ClinicalTrials.gov (NCT01254201). All patients underwent a complete informed consent process before participating in any research activities. Three cohorts of age-matched patients were evaluated: (1) individuals with isolated DED defined by self-reported irritative ocular symptoms in the absence of systemic cause for dry eyes (n=48); (2) individuals with FM as “positive” controls (n=23); and (3) healthy “negative” controls (n=26). Because of the substantially higher prevalence of both DED and FM in women, only women were included in this study. Patients with isolated DED (cohort 1) were identified through visits to the University of Michigan ophthalmology clinics. Patients with FM and healthy controls (cohorts 2 and 3) were identified through a research patient registry at the University of Michigan Chronic Pain and Fatigue Research Center. For all three cohorts, we included only women over the age of 18.
The dry eye cohort patients were required to have complaints of dry eyes with or without any clinical signs on examination. The FM cohort patients were required to qualify for a diagnosis of FM based on the American College of Rheumatology 2010 diagnostic criteria, which require the following: (1) to have a widespread pain index score (indicative of the number of body regions that test positive for pain; range, 0–19) of ≥7; (2) to have a symptom severity scale score (a systematic measurement of secondary symptoms present in FM; range, 0–12) of ≥5; (3) to have had persistent symptoms for at least 3 months; and (4) to not have an overlapping disorder that might otherwise explain these symptoms.119
A diagnosis of FM was an exclusion criterion for the other two cohorts. Individuals were also excluded from participation in this study for the following reasons: any previous eye surgery, medicated eye drop use within the month prior to the study visit (artificial tear use was permitted), any use of oral antihistamine or anticholinergic medications, pregnancy, breast-feeding, known hearing loss, known diagnosis of autoimmune or rheumatologic disease (eg, rheumatoid arthritis, Crohn’s disease, lupus, multiple sclerosis), insulin-dependent diabetes, heart condition requiring daily medications, chronic obstructive pulmonary disease or asthma requiring daily inhalers, or history of cancer (other than skin cancer) in the past 2 years. Individuals were also excluded from participation if they were currently in the process of filing for disability, on temporary disability, and/or involved in litigation regarding their medical condition.
All patients underwent ocular surface examination, CCM, systemic sensory testing, and questionnaire-based assessment of self-reported ocular and systemic symptoms. Since all three cohorts of patients were recruited in an overlapping manner, the examiners were masked to the cohort designation of individuals as they were being examined.
A subset of patients underwent a high-resolution structural MRI for direct comparison of brain imaging findings to corneal nerve findings on CCM. Another subset of patients underwent skin biopsy for comparison of intraepidermal nerve fiber density to corneal nerve density on CCM.
OCULAR SURFACE EXAMINATION
Ocular surface examination included the following: (1) Schirmer testing. In order to attain a quantitative measure of basal aqueous tear secretion, after administration of topical anesthetic and gentle drying of the inferior lid sulcus, sterile strips of filter paper were placed at the border of the lateral third of both lower eyelids to assess millimeters of tears collected over 5 minutes. This is a quantitative measure of aqueous tear secretion with known, somewhat variable results.155 (2) Meibomian gland dysfunction assessment. The health status of the eyelid margins was assessed on the basis of meibomian gland appearance and secretions, status of the lashes, lid margin hyperemia, and any architectural abnormalities. Meibomian gland dysfunction was rated on a scale from 0 to 4. (3) Tear film breakup time. Tear film stability and tear quality were assessed by measuring the time interval between the last complete blink and the first appearance of a dry spot or discontinuity of the tear film.155–157 Tear film breakup time of less than 10 seconds was considered abnormal. (4) Ocular surface staining. As a measure of the health and integrity of the ocular surface, sodium fluorescein dye was used to stain areas of discontinuity in the corneal epithelial surface and lissamine green dye was used to identify areas of devitalized epithelium on the ocular surface.158,159 Staining was quantified using the Oxford scale standardized version of the National Eye Institute/Industry Workshop grading scheme.28,83,155 (5) Central corneal sensitivity. The Cochet-Bonnet esthesiometer was used to measure mechanical sensitivity of the cornea to light touch with a fine nylon monofilament, and the outcome was reported as the pressure (gm/mm2) required to elicit a reaction. Three measurements of each cornea were taken, and the mean of the measurements was used in the statistical analysis.
CORNEAL CONFOCAL MICROSCOPY
Corneal confocal microscopy was performed on the right eye of each patient to image the entire depth of the central cornea, including the sub-basal corneal nerve layer. The Heidelberg Retinal Tomograph II Rostock Cornea Module (Heidelberg Engineering Inc, Franklin, Massachusetts), a laser scanning confocal biomicroscope, was used to acquire 400×400-μm coronal images of the cornea. After instillation of topical anesthetic eye drops and a moisturizing gel (GenTeal gel, Novartis Pharmaceuticals, East Hanover, New Jersey), a contact examination was performed to image the central cornea. Three full-thickness scans of the central cornea were performed, followed by additional sequence acquisitions focused on the central sub-basal nerve layer. Images were reviewed in a masked manner, and three to five high-quality, nonoverlapping images of the central sub-basal corneal nerve layer were identified for analysis.
Analysis of the nerve plexus images was performed using NeuronJ software (a plug-in of NIH ImageJ analysis software) to determine the nerve density and number of nerve segments per image (Figure 1). Mean measurements for each patient for each metric were used for analysis.
FIGURE 1.

Cornea confocal microscopy of corneal sub-basal nerve layer. Left, Unedited 400×400-μm-area image directly from HRT-Rostock module confocal instrument. Right, Example of semi-automated tracing of nerve image using NeuronJ.
SYSTEMIC SENSORY ANALYSIS
All study volunteers underwent sensory testing for quantification of evoked pressure-pain and auditory sensitivity. Pressure-pain sensitivity was evaluated by subjective scaling of multiple pressure-pain sensations. Discrete 5-second pressure stimuli were applied to the fixated left thumbnail at 20-second intervals with a 1-cm2 hard rubber probe. Previous studies have shown that “neutral” regions, such as the thumb, accurately reflect an individual’s overall pressure-pain sensitivity.160 The rubber probe was attached to a hydraulic piston, which was connected via a combination of valves to a second piston. Application of calibrated weights to the second piston produced controlled, repeatable pressure-pain stimuli of rectangular waveform. Subjects rated the intensity of pressure-pain sensations by using the Gracely Box Scale (GBS) for sensory intensity.161 The GBS is a combined numerical analog descriptor scale, developed from previously quantified verbal descriptors.162 This scale lists the numbers 0 to 20 in descending order next to a set of verbal descriptors ranging from “extremely intense” (between 18 and 19) to “no pain sensation” (0). Subjects were asked to choose the number that best describes their pain. The session began with a series of stimuli presented in a predictable, “ascending” fashion, beginning at 0.25 kg/cm2 and increasing in 0.25 to 0.50 kg/cm2 steps up to tolerance or to a maximum of 10 kg/cm2. After the ascending series, 36 stimuli were delivered at 20-second intervals in random order, using the multiple random staircase (MRS) method.163 The MRS method is response-dependent, that is, it determines the stimulus intensity needed to elicit a specified response. In this implementation, three independent staircases were titrated to produce pain sensations rated between 0 and 1 (faint pain), between 7 and 8 (mild pain), and between 13 and 14 (slightly intense pain) on the 0 to 20 GBS.
Judgments of Loudness Discomfort Levels164 were obtained using methods similar to those using pressure stimulation described above.165,166 All tones were presented at 2000 Hz. Each ear was tested separately. First, a discrete ascending test was performed, and subjects rated the intensity of tones presented for 5 seconds at 40, 50, 60, 70, 80, 90, and 100 dB, using the GBS for affective unpleasantness.161 This scale lists the numbers 0 to 20 in descending order next to a set of verbal descriptors ranging from “very intolerable” (between 17 and 18) to “neutral” (0). Subjects were asked to choose the number that best describes their affective reaction to each tone. Once this was completed, 36 tones were delivered at 20-second intervals in random order, using the MRS method described above. Just as for the pressure stimulation, three independent staircases were conducted to determine the intensity of the auditory tone needed to produce sensations rated between 0 and 1, between 7 and 8 (annoying/unpleasant), and between 13 and 14 (distressing) on the 0 to 20 GBS. The process was then repeated for the other ear. The low-, medium-, and high-intensity levels from each ear were averaged for each subject.
PATIENT-REPORTED SYMPTOMS
During the study visit, study volunteers were given a packet of self-report questionnaires to complete on a spectrum of ocular and systemic symptoms. The following instruments were used:
Ocular Surface Disease Index (OSDI), a validated 12-item survey that evaluates dry eye symptoms with a 1-week recall period. The OSDI has been found to be internally consistent, with good to excellent test-retest reliability and excellent discriminant validity to measure symptoms of dry eyes.167 OSDI is scored on a scale from 0 to 100, with higher scores indicating more dry eye symptoms. OSDI score was used to categorize patient symptoms as none (0–12), mild (13–22), moderate (23–32), or severe (33–100).168
Visual Function Questionnaire (VFQ-25), a validated 25-item survey that includes 9 subscales assessing general health, general vision, ocular pain, near activities, distance activities, vision-specific functioning, driving, color vision, and peripheral vision. The VFQ-25 correlates strongly with DED-specific self-report measures23,82,85,167,169 and also includes measures of other vision-specific quality-of-life aspects.
McGill Pain Questionnaire (MPQ), a self-report questionnaire that assesses qualitative as well as intensity-related aspects of individuals’ experience of pain.170
Multidimensional Fatigue Inventory (MFI), a 20-item survey measuring five different dimensions of fatigue—general fatigue, physical fatigue, reduced activity, reduced motivation, and mental fatigue.171
Mood and Anxiety Symptom Questionnaire (MASQ), a 77-item self-report questionnaire that explores a range of symptoms relevant to anxiety and depression.172
Center for Epidemiologic Studies Depression scale (CES-D), a 20-item survey that measures depressive symptoms.173
Perceived Stress Scale (PSS), a 10-item survey used to measure an individual’s perception of stress.174
Coping Strategies Questionnaire–Catastrophizing scale (CSQ-CAT), a 6-item survey that assess coping mechanisms for dealing with adverse events.175
MRI VOXEL-BASED MORPHOMETRY
Eleven patients underwent MRI testing within 3 months of their study visit for direct comparison of brain imaging to corneal nerve imaging. Testing was performed on a 3.0 Tesla GE Signa scanner (LX [VH3] release, neuro-optimized gradients; GE Healthcare, Fairfield, Connecticut). For each subject, a T1-weighted gradient echo data set (repetition time 1400 ms, time to echo 5.5 ms, flip angle 20°, field of view 256×256, yielding 124 sagittal slices with a defined voxel size of 1×1×1.2 mm) was acquired. An Eclipse 3.0 T 94 quadrature head coil was used. Inspection of individual T1 MRIs revealed no gross morphological abnormality for any participant.
The SPM8 software package (Functional Imaging Laboratories, London, United Kingdom), running under MATLAB 7b, was used to preprocess and analyze structural data.176 Estimation of total gray matter (GM) volume, total white matter (WM) volume, and cerebrospinal fluid (CSF) volume was performed by segmenting the original image into GM, WM, and CSF, using the New Segment function in SPM.
Preprocessing of structural images for voxel-based morphometry analyses was performed using the Diffeomorphic Anatomical Registration Through Exponentiated Lie algebra (DARTEL) toolbox,177 which involved spatial normalization, segmentation, and spatial smoothing (Gaussian kernel of 8-mm full width at half maximum for GM images). Modulated images were used for statistical analyses, meaning we examined correlations with regional GM volume, rather than density.
SKIN BIOPSY
Skin biopsy of the dorsal leg was performed on two patients in the FM cohort and five healthy controls. For each patient, a 3-mm punch biopsy of the skin of the left distal leg, 10 cm above the lateral malleolus, was performed. The procedure was performed under sterile conditions in a procedure room, and no patients developed any complications. Specimens were carefully labelled and placed in fixative solution in a 4°C refrigerator until they could be sectioned and analyzed. Further processing of the skin biopsy and calculation of the intraepidermal nerve fiber density was performed under standardized conditions by the Cutaneous Innervation Center of the University of Michigan.
SYMPTOM-SIGN DISCORDANCE
Clinically, the phenomenon of symptom-sign discordance is evident in a proportion of patients with dry eye complaints but minimal clinical findings of dry eye on examination. For the purposes of further analysis of this subgroup of patients, individuals in the dry eye cohort were separated post hoc into discordant and concordant subgroups. Patients were categorized as discordant if they presented with substantial clinical symptoms of dry eyes (OSDI score >12)168 in the absence of aqueous tear deficiency (Schirmer >5 mm/5 min).155 This definition and distinction of subgroups was performed after patient recruitment into the study but prior to any data analysis. We also performed a secondary classification of discordance on the basis of the presence or absence of ocular surface stain, with discordance defined as substantial clinical symptoms of dry eyes (OSDI score >12) in the absence of ocular surface stain. The results of this analysis are presented in the Appendix.
STATISTICAL ANALYSIS
Statistical analysis was performed with SPSS 22, using analysis of variance and chi-square testing to compare differences across cohorts. An a priori sample size and power calculation were not performed, as this study was designed as a novel, exploratory analysis of the subset of patients with discordant DED. In some cases, Pearson correlations were employed to examine the relationship between two variables in a single cohort or in all subjects combined. Post hoc Tukey’s honest significant difference tests were used where appropriate to determine differences between specific cohorts. No correction was performed for multiple analyses, since this study was intended as an exploratory analysis. A P value of <.05 was considered statistically significant.
RESULTS
The study included a total of 97 study volunteers: 48 patients in the dry eye cohort, 23 patients in the FM cohort, and 26 patients in the healthy cohort. All study participants were women. Mean overall age was 44±15 years (range, 20–73), and there was no statistically significant difference in age between the cohorts (F2,94=.27, P=.77).
OCULAR SURFACE EXAMINATION
Ocular surface examination was performed on all study volunteers. Schirmer testing confirmed significantly higher tear production in the healthy control cohort (18.5 mm), with decreased tear function in both the dry eye (11.2 mm) and the FM (14.4 mm) cohorts (P<.001) (Figure 2, top left). Ocular surface stain was measured with the Oxford score that combines corneal fluorescein and conjunctival lissamine green stain. The overall rate of staining was relatively low (mean, 0.8, range, 0–5), and there was no significant difference in staining between the cohorts (P=.17) (Figure 2, top right). When converted to a dichotomous variable describing the presence of any ocular surface staining, there was still no significant difference between the cohorts (P=.28). Twenty-six percent of the FM cohort had normal tear breakup time, compared to 52% in the dry eye and 54% in the healthy cohorts (P=.081) (Figure 2, bottom left). Corneal sensation, as measured by Cochet-Bonnet esthesiometry, was not significantly different between the cohorts (P=.22) (Figure 2, bottom right), although the dry eye and FM cohorts (1.0 gm/mm2 and 1.1 gm/mm2, respectively) exhibited higher corneal sensitivity than the healthy control cohort (1.9 gm/mm2). Meibomian gland dysfunction also was not significantly different between the cohorts (P=.27) (Figure 3).
FIGURE 2.

Ocular surface examination findings by cohort.
FIGURE 3.

Severity of meibomian gland dysfunction by cohort.
PATIENT-REPORTED DRY EYE SYMPTOMS
Ophthalmic symptoms were measured using the OSDI to investigate ocular surface symptoms. Total OSDI score was significantly lower in the healthy controls (mean OSDI score, 1.9) (P<.001), with similar mean scores in both the dry eye and FM cohorts (mean OSDI scores, 20.3 for both), indicating higher and similar levels of dry eye symptoms in both the dry eye and FM cohorts (Figure 4). Separation of patients into mild, moderate, and severe symptom categories shows almost identical breakdown of dry eye symptom severity in these two cohorts (Table 1). The OSDI score was not significantly correlated with corneal sensation (r=−0.06, P=.57).
FIGURE 4.

Ocular Surface Disease Index symptom score by cohort.
TABLE 1.
DISTRIBUTION OF SEVERITY OF DRY EYE SYMPTOMS BASED ON COHORT AS MEASURED BY OSDI
| OSDI CATEGORY | COHORT | ||
|---|---|---|---|
| HEALTHY | DRY EYE | FIBROMYALGIA | |
| None | 100% | 46% | 48% |
| Mild | 0% | 14% | 13% |
| Moderate | 0% | 21% | 22% |
| Severe | 0% | 19% | 17% |
OSDI, Ocular Surface Disease Index.
DISCORDANT VS CONCORDANT DRY EYE
Based on the relationship of ocular surface clinical examination findings and patient-reported symptoms of dry eyes, the dry eye cohort was separated into patients with discordant dry eyes, ie, those with high symptom scores and no or few ocular surface clinical findings. This distinction was made for the Schirmer-Discordant subgroup (n=23 discordant; n=25 concordant) as a measure of presumed adequate aqueous tear production of Schirmer test result greater than >5 mm/5 min (Figure 5). The concordant counterpart consists of patients with either high symptom score with substantial ocular surface clinical findings or low symptom score with no or few ocular surface findings. This post hoc categorization was used to compare these subgroups with regard to the remaining study evaluations.
FIGURE 5.

Dry eye cohort divided into discordant and concordant subgroups. Discordance is defined as Schirmer testing >5 mm/5 min and an Ocular Surface Disease Index score >12.
CORNEAL CONFOCAL MICROSCOPY
The corneal sub-basal nerve layer was imaged and the nerve morphology analyzed to assess corneal nerve differences in these cohorts. The overall density of nerves (length of nerves per area of cornea) was significantly different across groups (P<.001), with lower density in the FM cohort (11.6 ± 3.0 mm/mm2) compared to both the dry eye (16.7 ± 5.8 mm/mm2; P=.002) and the healthy control (16.7 ± 3.7 mm/mm2; P<.001) cohorts (Figure 6, top). These analyses were also performed with the separation of the discordant and concordant subgroups of the dry eye cohort. The differences in nerve density between these four groups were also significant (P <.001), with the FM group significantly lower than both the healthy controls (P<.001) and the concordant dry eye subgroup (18.4 ± 5.5 mm/mm2; P=.001), but not significantly different from the discordant dry eye subgroup (14.4 ± 5.9 mm/mm2; P=.41). Healthy controls were not significantly different from the concordant or discordant subgroup (P=.74 and P=.60, respectively), and the two dry eye subgroups did not differ significantly from one another (P=.28; Figure 6, bottom).
FIGURE 6.

Central corneal sub-basal nerve density as measured by corneal confocal microscopy, compared by cohort (top) and by discordant and concordant subgroups (bottom).
Corneal nerve density had no correlation with corneal sensation in the same eye (r=0.09, P=.53). Corneal nerve density was negatively correlated with OSDI score, suggesting that those with higher corneal nerve density had fewer dry eye symptoms (r=−.36, P=.005) (Figure 7).
FIGURE 7.

Scatterplot of corneal nerve density (mm/mm2) vs Ocular Surface Disease Index score.
Similar analysis was performed comparing the mean number of nerve segments per image in the central cornea of patients. As expected, the number of corneal nerve segments per confocal image was closely related to corneal nerve density, measured as millimeters of corneal nerves per square millimeters of corneal area, on confocal imaging (r=0.76, P<.001; Figure 8). When comparing the three cohorts, there was no statistically significant difference in the number of corneal nerve segments between the groups (P=.11), although the healthy controls (14.8 nerve segments per image) had the most nerves and the FM cohort (12.5 nerve segments per image) the least. The Schirmer-discordant comparison revealed a significant difference across the four groups (P=.024), wherein the discordant subgroup was similar to the FM cohort, and the concordant more similar to healthy controls. The number of corneal nerve segments was not correlated with corneal sensation (r=−.07, P=.60) or with dry eye symptoms as measured by OSDI (r=−.23, P=.79).
FIGURE 8.

Scatterplot of corneal nerve density (mm/mm2) vs number of corneal nerve segments per image.
PATIENT-REPORTED VISUAL QUALITY OF LIFE
The VFQ-25 was used as a patient-reported measure of visual quality of life. The overall visual acuity of participants in this study was very good, with 85.4% of participants having 20/20 or better visual acuity and 100% having 20/40 or better visual acuity. VFQ-25 scores were significantly different between the three cohorts (P<.001), with the highest scores in the healthy control cohort (total score=95.6±3.3), lowest in the FM cohort (total score=82.5±13.3), and intermediate in the dry eye cohort (total score=88.2±7.7) (Figure 9). Post hoc pairwise comparisons revealed that all three groups differed significantly from one another (P<.05 for all). Many of the VFQ-25 subscales were also significantly different between the cohorts (Table 2A). General health was significantly worse in the FM cohort as compared to the other two cohorts (P<.001). Ocular pain was similar in the dry eye and FM cohorts, but both were significantly worse than the healthy control cohort (P<.001). The mental health and role difficulty subscales were also significantly lower in the dry eye and FM cohorts as compared to the healthy control cohort (P=.001 for both). Social function and dependency subscales were not significantly different between the cohorts (P=.067 and P=.132, respectively).
FIGURE 9.

Visual quality of life as measured by Visual Function Questionnaire-25 scores, compared by cohort (top) and by discordant and concordant subgroups (bottom).
TABLE 2A.
VISUAL FUNCTION QUESTIONNAIRE-25 SCORES AND SUBSCALES BY COHORT
| CATEGORY | MEAN (SD) | P VALUES* | |||||
|---|---|---|---|---|---|---|---|
| HC (n=26) | DE (n=48) | FM (n=23) | ANOVA | HC VS DE | DE VS FM | HC VS FM | |
| Total | 95.6 (3.3) | 88.2 (7.7) | 82.5 (13.3) | <.001 | .002 | .032 | <.001 |
| General health | 80.8 (17.8) | 77.2 (20.3) | 47.8 (21.2) | <.001 | .742 | <.001 | <.001 |
| General vision | 84.6 (16.3) | 86.5 (11.2) | 70.9 (25.7) | .002 | .892 | .002 | .017 |
| Ocular pain | 99.0 (3.4) | 74.7 (15.3) | 75.0 (17.3) | <.001 | <.001 | .997 | <.001 |
| Social function | 100.0 (0.0) | 97.3 (6.9) | 95.1 (11.1) | .067 | .287 | .476 | .055 |
| Mental health | 97.6 (3.5) | 84.9 (13.3) | 87.0 (20.3) | .001 | .001 | .831 | .021 |
| Role difficulty | 100.0 (0.0) | 84.2 (20.0) | 89.7 (16.3) | .001 | <.001 | .386 | .069 |
| Dependency | 100.0 (0.0) | 97.1 (7.7) | 95.3 (12.0) | .132 | .330 | .654 | .117 |
ANOVA, analysis of variance; DE, dry eye; FM, fibromyalgia; HC, healthy control.
Numbers in bold indicate statistical significance.
The overall and subscale VFQ-25 scores were also assessed with the further distinction between the discordant and concordant subgroups of dry eyes (Table 2B). Total VFQ-25 score and the subscales of general health, general vision, ocular pain, mental health, and role difficulty continued to show statistically significant differences (P<.01 for all). The social function and dependency subscales of the VFQ-25 were not statistically significantly different in the comparison of the three cohorts (as mentioned above), but once the dry eye group was separated into discordant and concordant subgroups, there was an overall difference between the groups on these two measures (P=.018 and P=.027, respectively). As can be gleaned from Table 2B, separation of the dry eye group generally brought average VFQ scores of concordant patients higher and closer to those of controls, compared to the dry eye group as a whole, whereas for discordant patients, scores were shifted lower toward those of FM patients. Concordant and discordant dry eye patients differed significantly from one another on four of the eight VFQ measures. Healthy controls were significantly different from concordant patients only in terms of general vision, where the patients actually had significantly higher scores than controls. In contrast, compared to discordant patients, healthy controls scored significantly higher on four of the measures. The FM cohort was significantly different from the concordant group on three measures and the discordant group on only two, and in one of these two latter cases the discordant group scored significantly lower than FMs. To summarize, the discordant patients reported lower visual function than the concordant patients, despite having similar best-corrected visual acuity, and their scores resembled those of the FM group; conversely, the concordant group’s higher scores were more similar to those of healthy controls.
TABLE 2B.
VISUAL FUNCTION QUESTIONNAIRE-25 SCORES AND SUBSCALES BY DISCORDANT AND CONCORDANT SUBGROUPS
| CATEGORY | MEAN (SD) | P VALUES* | |||||||||
|---|---|---|---|---|---|---|---|---|---|---|---|
| HC (n=26) | CON (n=25) | DIS (n=23) | FM (n=23) | ANOVA | HC VS CON | HC VS DIS | HC VS FM | CON VS DIS | CON VS FM | DIS VS FM | |
| Total | 95.6 (3.3) | 91.7 (4.5) | 84.3 (8.7) | 82.5 (13.3) | <.001 | .346 | <.001 | <.001 | .017 | .001 | .884 |
| General health | 80.8 (17.8) | 78.1 (17.4) | 76.1 (23.8) | 47.8 (21.2) | <.001 | .966 | .854 | <.001 | .987 | <.001 | <.001 |
| General vision | 84.6 (16.3) | 89.2 (10.2) | 83.6 (11.8) | 70.9 (25.7) | .003 | .782 | .997 | .030 | .692 | .002 | .065 |
| Ocular pain | 99.0 (3.4) | 81.3 (14.0) | 67.6 (13.7) | 75.0 (17.3) | <.001 | <.001 | <.001 | <.001 | .003 | .352 | .228 |
| Social function | 100.0 (0.0) | 99.5 (2.6) | 94.9 (9.2) | 95.1 (11.1) | .018 | .994 | .072 | .086 | .137 | .162 | 1.00 |
| Mental health | 97.6 (3.5) | 89.8 (9.5) | 79.5 (15.1) | 87.0 (20.3) | <.001 | .172 | <.001 | .031 | .050 | .880 | .251 |
| Role difficulty | 100.0 (0.0) | 91.1 (12.0) | 76.7 (24.2) | 89.7 (16.3) | <.001 | .181 | <.001 | .094 | .010 | .988 | .028 |
| Dependency | 100.0 (0.0) | 99.7 (1.7) | 94.3 (10.4) | 95.3 (12.0) | .027 | .999 | .076 | .177 | .107 | .236 | .976 |
ANOVA, analysis of variance; CON, concordant dry eye; DIS, discordant dry eye; FM, fibromyalgia; HC, healthy control.
Numbers in bold indicate statistical significance.
SYSTEMIC SENSORY EVALUATION
Auditory and pressure sensitivity were measured to assess systemic sensory sensitivity in these cohorts of individuals. The results showed a statistically significant difference between the FM and healthy control cohorts for both pressure-pain (P=.002, t test) (Figure 10, top) and auditory (P=.05, t test) (Figure 11, top) testing. Although not statistically significant, the dry eye cohort had more similar auditory sensitivity to the FM cohort than the healthy controls. In terms of pressure-pain testing, the dry eye cohort was more similar to the healthy controls than the FM cohort. With the further distinction between discordant and concordant dry eye subgroups, the differences were not statistically significant (Figures 10, bottom, and 11, bottom).
FIGURE 10.

Pressure-pain sensitivity measuring the amount of pressure (kg/cm2) at which subjects experienced moderate discomfort using the multiple random staircase method. Comparisons by cohort (top) and by discordant and concordant subgroups (bottom).
FIGURE 11.

Auditory sensitivity measuring the decibel (dB) at which subjects experienced moderate auditory discomfort using the multiple random staircase method. Comparisons by cohort (top) and by discordant and concordant subgroups (bottom).
PATIENT-REPORTED SYSTEMIC SYMPTOMS
Self-reported patient symptom information was collected through questionnaires on pain, fatigue, mood, affect, stress, and coping mechanisms (Tables 3A and 3B). The MPQ visual analog scale and total score were statistically significantly different between the three cohorts (F2,53=33.3, P<.001). The visual analog scale was significantly different for all three cohorts with the FM cohort reporting the highest level of pain, the dry eye cohort intermediate, and the healthy controls with the lowest pain rating (P<.001). The total MPQ score also followed this pattern of pain rating, although the FM cohort had a statistically higher pain rating than either of the other cohorts (P<.001). With the dry eye cohort divided into discordant and concordant subgroups, both the visual analog scale and total MPQ score of the FM cohort remain statistically significantly different from the others (P<.001), with the discordant dry eye subgroup somewhat more similar to the FM cohort.
TABLE 3A.
SELF-REPORTED SYSTEMIC SYMPTOMS COLLECTED THROUGH QUESTIONNAIRES, BY COHORT
| INSTRUMENT | MEAN (SD) | P VALUES* | |||||
|---|---|---|---|---|---|---|---|
| HC (n=26) | DE (n=48) | FM (n=23) | ANOVA | HC VS DE | DE VS FM | HC VS FM | |
| MPQ TOT | 0.6 (0.9) | 5.2 (8.6) | 17.1 (7.9) | <.001 | .093 | <.001 | <.001 |
| MPQ VAS | 0.6 (0.8) | 2.1 (2.5) | 6.0 (1.8) | <.001 | .104 | <.001 | <.001 |
| MFI GF | 8.4 (3.0) | 10.7 (3.9) | 16.3 (2.5) | <.001 | .032 | <.001 | <.001 |
| MFI PF | 6.6 (3.0) | 8.1 (3.8) | 13.7 (2.9) | <.001 | .213 | <.001 | <.001 |
| MFI RA | 6.8 (3.0) | 9.1 (4.4) | 11.4 (3.6) | .001 | .084 | .126 | .001 |
| MFI RM | 6.3 (2.4) | 8.6 (4.0) | 11.5 (3.6) | <.001 | .059 | .016 | <.001 |
| MFI MF | 7.4 (3.4) | 9.4 (3.5) | 14.0 (4.5) | <.001 | .136 | <.001 | <.001 |
| MASQ | 67.1 (14.9) | 70.9 (20.9) | 90.4 (21.9) | .001 | .600 | .010 | .002 |
| CES-D | 6.5 (6.0) | 9.4 (8.2) | 16.9 (8.0) | .001 | .265 | .019 | <.001 |
| PSS | 9.8 (7.8) | 12.1 (8.0) | 19.1 (7.9) | .002 | .478 | .021 | .003 |
| CSQ-Cat | 0.3 (0.4) | 0.5 (0.7) | 2.0 (1.1) | <.001 | .664 | <.001 | <.001 |
ANOVA, analysis of variance; CES-D, Center for Epidemiologic Studies–Depression scale; CSQ-Cat, Coping Strategies Questionnaire–Catastrophizing scale; DE, dry eye; FM, fibromyalgia; HC, healthy control; MASQ, Mood and Anxiety Symptom Questionnaire; MFI GF, Multidimensional Fatigue Inventory–general fatigue; MFI MF, Multidimensional Fatigue Inventory–mental fatigue; MFI PF, Multidimensional Fatigue Inventory–physical fatigue; MFI RA, Multidimensional Fatigue Inventory–reduced activity; MFI RM, Multidimensional Fatigue Inventory–reduced motivation; MPQ TOT, McGill Pain Questionnaire–total score; MPQ VAS, McGill Pain Questionnaire–visual analog scale; PSS, Perceived Stress Scale.
Numbers in bold indicate statistical significance.
TABLE 3B.
SELF-REPORTED SYSTEMIC SYMPTOMS COLLECTED THROUGH QUESTIONNAIRES, BY DISCORDANT AND CONCORDANT SUBGROUPS
| INSTRUMENT | GROUP MEANS (SD) | P VALUES* | |||||||||
|---|---|---|---|---|---|---|---|---|---|---|---|
| HC (n=26) | CON (n=25) | DIS (n=23) | FM (n=23) | ANOVA | HC VS CON | HC VS DIS | HC VS FM | CON VS DIS | CON VS FM | DIS VS FM | |
| MPQ TOT | 0.6 (0.9) | 4.3 (9.3) | 6.9 (7.2) | 17.1 (7.9) | <.001 | .404 | .155 | <.001 | .830 | <.001 | .006 |
| MPQ VAS | 0.6 (0.8) | 1.7 (2.3) | 2.7 (2.8) | 6.0 (1.8) | <.001 | .501 | .101 | <.001 | .686 | <.001 | <.001 |
| MFI GF | 8.4 (3.0) | 10.5 (3.5) | 11.1 (4.6) | 16.3 (2.5) | <.001 | .145 | .144 | <.001 | .994 | <.001 | <.001 |
| MFI PF | 6.6 (3.0) | 7.2 (2.9) | 9.5 (4.7) | 13.7 (2.9) | <.001 | .830 | .116 | <.001 | .451 | <.001 | .006 |
| MFI RA | 6.8 (3.0) | 8.6 (4.6) | 9.7 (4.1) | 11.4 (3.6) | .004 | .343 | .192 | .002 | .952 | .204 | .635 |
| MFI RM | 6.3 (2.4) | 7.4 (2.8) | 10.2 (4.9) | 11.5 (3.6) | <.001 | .611 | .016 | <.001 | .221 | .005 | .732 |
| MFI MF | 7.4 (3.4) | 9.1 (2.5) | 9.8 (4.8) | 14.0 (4.5) | <.001 | .392 | .343 | <.001 | .993 | .003 | .022 |
| MASQ | 67.1 (14.9) | 63.2 (18.4) | 82.4 (19.2) | 90.4 (21.9) | <.001 | .998 | .153 | .002 | .126 | .002 | .678 |
| CES-D | 6.5 (6.0) | 8.0 (6.9) | 11.5 (9.8) | 16.9 (8.0) | .002 | .674 | .392 | .001 | .937 | .040 | .289 |
| PSS | 9.8 (7.8) | 10.9 (7.8) | 13.8 (8.3) | 19.1 (7.9) | .006 | .858 | .583 | .005 | .939 | .045 | .305 |
| CSQ-Cat | 0.3 (0.4) | 0.4 (0.6) | 0.8 (0.8) | 2.0 (1.1) | <.001 | .995 | .521 | <.001 | .677 | <.001 | .001 |
ANOVA, analysis of variance; CES-D, Center for Epidemiologic Studies–Depression scale; CON, concordant dry eye; CSQ-Cat, Coping Strategies Questionnaire–Catastrophizing scale; DIS, discordant dry eye; FM, fibromyalgia; HC, healthy control; MASQ, Mood and Anxiety Symptom Questionnaire; MFI GF, Multidimensional Fatigue Inventory–general fatigue; MFI MF, Multidimensional Fatigue Inventory–mental fatigue; MFI PF, Multidimensional Fatigue Inventory–physical fatigue; MFI RA, Multidimensional Fatigue Inventory–reduced activity; MFI RM, Multidimensional Fatigue Inventory–reduced motivation; MPQ TOT, McGill Pain Questionnaire–total score; MPQ VAS, McGill Pain Questionnaire–visual analog scale; PSS, Perceived Stress Scale.
Numbers in bold indicate statistical significance.
The FM cohort had significantly higher scores on all five dimensions of the MFI as compared to the dry eye and healthy control cohorts (P<.01 for all).
The MASQ and the CES-D showed statistically significant differences between the three cohorts in mood and affect, with the FM cohort having more self-reported symptoms of anxiety and depression than the other two cohorts (P=.001 for both). With the dry eye cohort separated into discordant and concordant subgroups, there were still statistically significant differences (P<.001), with the discordant dry eye subgroup more similar to the FM cohort.
Results of the PSS indicated higher perceived levels of stress in the FM cohort than the other two study cohorts (P=.002). Separation of the dry eye cohort into discordant and concordant subgroups indicated significance, with the FM cohort having higher rates of stress on the PSS (P=.006). The FM cohort had significantly higher scores on the CSQ-CAT (P<.001) than the other cohorts. With the distinction of the dry eye cohort into discordant and concordant subgroups, the FM cohort continues to have the highest CSQ-CAT score (P<.001).
MAGNETIC RESONANCE IMAGING
In the subset of 11 FM subjects for whom there were both high-resolution structural brain images and corneal nerve morphology data, corneal nerve density was used as a covariate of interest in a whole-brain correlation. Although no result was statistically significant in our small sample, gray matter volume in a 230-voxel cluster located in the right middle frontal gyrus [coordinates: 52, 19, 41] was positively correlated with corneal nerve density (P=.013 uncorrected). The peak voxel within this cluster did reach family-wise error (FWE) corrected significance (P=.027 FWE corrected). No other correlations between gray matter volume and corneal nerve density approached significance (Figure 12).
FIGURE 12.
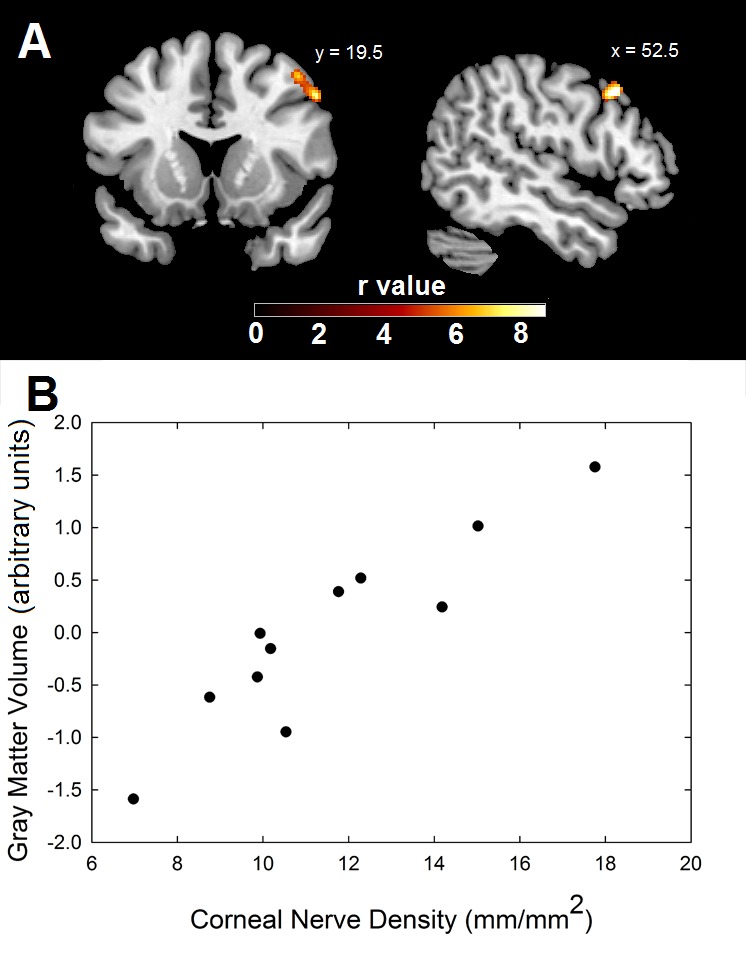
Results of MRI testing to compare brain imaging to corneal nerve imaging. Top, Gray matter volume in the cluster shown was significantly correlated with corneal nerve fiber density. The scale represents the strength of the correlation. Bottom, Scatterplot shows the correlation between corneal nerve fiber density and gray matter volume, which has been corrected for differences in subject age and total intracranial volume.
SKIN BIOPSY
In the subset of seven subjects who underwent skin biopsy of the distal leg for assessment of intraepidermal nerve fiber density (IENFD), skin nerve density was strongly correlated with corneal nerve density (r=0.87, P=.01) (Figure 13). The number of nerve segments per confocal image was also correlated with IENFD (I=.78, P=.04).
FIGURE 13.

Scatterplot of intraepidermal nerve fiber density (mm/mm2) vs corneal nerve density (mm/mm2).
DISCUSSION
Based on our careful examination of patients who self-report dry eye complaints, and comparison of their examination findings with both a “positive” control group of individuals with FM and a “negative” control group of healthy individuals, we find strong similarities between the discordant subset of the dry eye patients and the cohort of patients with FM. Taken as a whole, these results suggest that dry eye patients with discordance between their symptoms and clinical findings have symptoms that could be primarily driven by a CNS mechanism similar to that known to underlie other centralized pain syndromes, rather than a local pathology at the ocular surface, as is the case for those whose reported and observed DED symptoms are in concordance.
OCULAR SURFACE EXAMINATION
Clinical ocular surface examination showed several similarities between the overall dry eye and FM cohorts. Schirmer testing and ocular surface staining were two clinical indicators that were substantially altered in both the dry eye and FM cohorts as compared to the healthy controls, indicating some ocular surface dryness in both of the cohorts. Prior studies have shown that dry eye findings are fairly common in FM.131–134 Dry eye symptom quantification through the use of the OSDI also showed strong similarities with higher symptom scores in both the dry eye and the FM cohorts of patients. The higher prevalence of symptoms and signs of dry eyes in FM could be due to local ocular surface dryness associated with the systemic condition as is seen in other chronic rheumatologic illnesses,68–72,76,178 or it could be due to a local manifestation of similar pathophysiologic changes that are associated with pain sensation throughout the body in FM.
DISCORDANT DRY EYE
To more fully characterize our cohort of dry eye patients, we next introduced a formal definition of discordant dry eyes as a way to identify and quantify the patients with dry eyes whose self-reported symptoms and clinical signs are disproportionate. Our initial classification was based on Schirmer testing, since this would identify patients with seemingly adequate tear production who still complained of dry eye symptoms. Defining discordance provided a way to identify a subgroup of dry eye patients who were consistently found to be more like the FM cohort than the healthy controls across a wide range of outcomes. This result is in line with a previous study of DED patients that showed a higher incidence of comorbid chronic pain syndromes in those whose ocular symptoms were found to have a neuropathic component.179
CORNEAL CONFOCAL MICROSCOPY
Corneal sensation was measured with Cochet-Bonnet esthesiometry, and corneal nerve structures were assessed using CCM. Corneal sensation results were similar in the dry eye and FM cohorts, indicating that corneal sensitivity is somewhat increased in both cohorts as compared to the healthy control cohort, although not to a statistically significant extent. Once the dry eye cohort was separated into the discordant and concordant subgroups, the similarities between the discordant dry eye subgroup and FM cohort and between the concordant dry eye subgroup and healthy cohort became apparent. The discordant dry eye patients had higher corneal sensitivity than the concordant subgroup and healthy cohort.
Corneal confocal microscopy measurements of the number of corneal segments per high-power field and the overall calculated corneal nerve density showed a similar pattern, with the discordant dry eye subgroup and the FM cohort having significantly fewer nerve segments and decreased nerve density as compared to those in the concordant dry eye subgroup and the healthy cohort. The sources of these sub-basal nerve density alterations in both FM and discordant dry eyes are unclear. Studies using CCM provide evidence of altered sub-basal nerve density in patients with DED.44,56,63–66,68–70 Recent research has shown small fiber peripheral nerve changes in the skin of patients with FM.146–153 However, it has yet to be conclusively determined whether this is a cause or a tertiary result of FM. Likewise, the decreased nerve density in the cornea could either represent a peripheral nerve response to local ocular surface damage or be a downstream effect of CNS pathology as seen in other chronic pain states.6,77–79,98
SYSTEMIC SENSORY EVALUATION
Systemic pressure-pain and auditory testing are measures used to quantify sensory sensitivity in FM and related conditions. In this study, pressure-pain sensitivity was increased in patients with FM, as has been previously shown.1,4,108 Prior research has suggested that the increased sensory sensitivity seen in FM can be due to deficient inhibition of pain signals, heightened amplification of them, or some combination of both.
SELF-REPORT QUESTIONNAIRES
Individuals in this study answered a series of self-report questionnaires about their visual quality of life, overall pain, fatigue, mood, affect, and stress. The VFQ-25 was used to measure visual quality of life in these individuals. Those in the dry eye and FM cohorts had much lower scores than the healthy control cohort. In the nine subscales of the VFQ-25, the discordant dry eye subgroup and FM cohort had similar mean scores in almost every subscale. Of note, the general health subscale of the VFQ-25 was one in which the FM cohort scored substantially lower than any of the other cohorts, including the discordant dry eye subgroup. This serves to highlight that although we suspect some similarities in the pathophysiological mechanisms underlying discordant dry eye and FM, FM involves pain that is much more diffuse and more detrimental to patients’ perceived overall health.
Questionnaires on pain, fatigue, mood, affect, and stress are often used to help characterize and identify patients with FM and related conditions and to highlight the widespread systemic effects of these conditions.79,121–123 In the current study, patients in the dry eye cohort routinely scored between the healthy (low) and FM (high) cohorts. Further distinction into discordant and concordant subgroups of dry eyes again showed a pattern of similarities in systemic and emotional findings between the discordant dry eye subgroup and FM cohort vs the concordant dry eye subgroup and healthy controls. Notably, recent research has highlighted the overlap of mood and affective disorders in some patients with DED.180–184 Future studies should attempt to classify individuals with DED as concordant and discordant in order to determine whether the previous results were driven primarily by discordant DED patients.
FUTURE DIRECTIONS
We performed some exploratory evaluations with small subsets of patients within this study. Voxel-based morphometry has identified brain structures involved in pain processing that are altered in FM.137–139 Analysis of our subset of 11 FM patients who had corneal nerve imaging by CCM and brain imaging by MRI revealed correlations between corneal nerve density and gray matter volume in an area in the prefrontal cortex. Correlations between neural features in multiple brain areas and peripheral nerve morphology would provide strong evidence that the peripheral anomalies observed in FM and other chronic pain conditions are the downstream result of central changes. This would be especially true if peripheral nerve morphology was shown to differ in regions that were asymptomatic for the patients being tested (eg, corneal nerves in patients with temporomandibular disorder).
Additionally, in our analysis of another subset of seven patients who had both corneal nerve imaging by CCM and skin biopsy to measure IENFD, our findings suggest lower IENFD in the FM cohort as compared to healthy controls, as has been previously reported.150–152 We also identified a strong correlation between IENFD and CCM in the small sample of individuals for whom the data were available, similar to what has been reported in other conditions with peripheral nerve changes, including diabetes mellitus.185–187 Although the sample sizes of these analyses are too small to draw conclusions, further testing is warranted to identify whether CCM can supplement or replace nerve biopsy as a noninvasive measure of peripheral nerve morphology in patients with FM and related central pain syndrome conditions.
STRENGTHS AND WEAKNESSES
This study was a pilot cross-sectional study performed to compare patients with self-reported dry eye symptoms to patients with FM and healthy controls. The populations were well defined and were successfully age-matched. Only females were included in this study, since both dry eyes and FM are much more common in females. This is both a strength, because gender is not a potential confounding factor in our results, and a weakness, in that the results cannot necessarily be extrapolated to males. The classification of discordant and concordant DED was post hoc, and while we used measures that are consistent with our current understanding of the ocular pathophysiology of DED, further studies would benefit from additional testing and refinement of the best way to correctly identify and categorize patients with discordant DED.
CONCLUSIONS
These findings reveal that discordant dry eye patients share abnormalities, across a variety of outcomes, with patients who have been diagnosed with many other centralized chronic pain syndromes, wherein individual patients will display not only some degree of differential peripheral pathophysiology (in this case due to the local ocular surface) but also CNS changes that are fairly common across conditions and that lead to similar systemic symptoms. This is among the first studies that consider a subset of patients with DED to have a central etiological mechanism. Other conditions, such as osteoarthritis, 102,188–192 chronic low back pain, 100, 101 temporomandibular disorder,193,194 rheumatoid arthritis, 10,195 and cancer pain,196,197 have also been identified as regional symptomatic manifestations of a central pathophysiology that upon closer examination affects a variety of domains in addition to complaints of pain and discomfort in a subset of cases. Ophthalmology can benefit from lessons learned in other medical subspecialties about understanding the biological underpinnings of some of the diseases that are most challenging to treat in practice; often, the answers are found not in the place where the patient experiences the symptoms, but where the experience itself is processed—the CNS and brain.
In summary, individuals with discordant dry eye were shown to have substantial similarities to patients with FM. With the results of this study, we can begin to distinguish, experimentally and clinically, a subgroup of patients with dry eyes who have a different mechanism of disease, one that extends beyond the ocular surface–lacrimal gland complex that is commonly believed to be responsible for the symptoms of dry eyes. We suggest that in many cases where there is a lack of ocular surface pathology noted on examination in a patient who complains of dry eyes, our inability to observe the relevant pathology is due to the fact that we are not looking in the right places to identify it. The results of the present study are consistent with our postulation that in individuals with discordant DED, CNS processes are responsible for much of the discordance between the severity of symptoms and the degree of ocular surface damage. This subset of individuals might respond better to different classes of medications or nonmedication treatments than those whose symptoms have a primary ophthalmic etiology. We hope that this research will move the field forward toward an end goal of being able to correctly diagnose the subtypes of DED and provide the appropriate treatment that is tailored to each individual. This would certainly be a welcome change for the numerous clinicians who have tried and failed to help their most difficult DED patients find adequate relief from their condition.
ACKNOWLEDGMENTS
Funding/Support: This study was funded through a Michigan Institute for Clinical and Health Research Pilot and Collaborative Grant Program Award (UL1RR024986). Dr Harper is supported by NIH grant K12-DE023574.
Financial Disclosures: Dr Shtein has received financial support through grant funding from the National Institutes of Health (U10-EY022881 and DP3-DK104386) and is a consultant for Belmed Professional Resources.
Author Contributions: Design of the study (R.M.S., S.E.H., A.S., D.A.W., D.J.C.); conduct of the study (R.M.S., S.E.H., M.H., A.S., D.A.W., D.J.C.); data collection (R.M.S., D.E.H., V.P., S.E.H., M.H., A.S., D.A.W., D.J.C.); data analysis (R.M.S., D.E.H., S.E.H.), interpretation of the data (R.M.S., D.E.H., S.E.H., A.S., D.A.W., D.J.C.), preparation, review and approval of the manuscript (R.M.S., D.E.H., V.P., S.E.H., M.H., A.S., D.A.W., D.J.C.).
APPENDIX
STAIN DISCORDANCE
A second analysis of the same cohort of patients was performed with a modified definition of dry eye discordance. Stain discordance was defined as substantial clinical symptoms of dry eyes (OSDI score >12) in the absence of ocular surface stain (Figure A1). This subgroup classification of dry eye patients resulted in 11 discordant and 37 concordant patients. The relationship of this definition of discordance with the Schirmer-discordant primary definition is shown in Table A1.
FIGURE A1.

Dry eye cohort divided into discordant and concordant subgroups based on ocular surface stain (Stain-Discordant). Discordance is defined as absence of ocular surface stain and Ocular Surface Disease Index score >12.
TABLE A1.
DRY EYE PARTICIPANT DISTRIBUTION BASED ON SCHIRMER-DISCORDANT AND STAIN-DISCORDANT DEFINITIONS
| ID NO. | SCHIRMER DIS | STAIN DIS | ID NO. | SCHIRMER DIS | STAIN DIS | ID NO. | SCHIRMER DIS | STAIN DIS |
|---|---|---|---|---|---|---|---|---|
| 1 | 17 | 33 | ||||||
| 2 | X | 18 | 34 | X | ||||
| 3 | X | 19 | 35 | |||||
| 4 | 20 | X | X | 36 | X | |||
| 5 | 21 | 37 | X | |||||
| 6 | X | X | 22 | 38 | ||||
| 7 | X | X | 23 | X | 39 | X | X | |
| 8 | X | X | 24 | 40 | ||||
| 9 | X | 25 | 41 | |||||
| 10 | X | X | 26 | 42 | ||||
| 11 | X | 27 | 43 | |||||
| 12 | X | X | 28 | 44 | ||||
| 13 | X | 29 | X | 45 | X | X | ||
| 14 | 30 | 46 | X | X | ||||
| 15 | X | X | 31 | X | X | 47 | X | |
| 16 | X | 32 | 48 |
ID, participant identification; DIS, discordant; X, yes.
CORNEAL CONFOCAL MICROSCOPY
As mentioned in this thesis, the overall density of corneal sub-basal nerves (length of nerves per area of cornea) was significantly different across the three main groups of patients in the study (P<.001), with lower density in the FM cohort (11.6 mm/mm2) compared to both the dry eye (16.7 mm/mm2) and healthy control (16.7 mm/mm2) cohorts. When the dry eye patients were separated into discordant and concordant groups based on ocular surface stain, the difference in nerve density between the four groups was also statistically significantly different (P <.001), with the discordant dry eye subgroup not significantly different from the FM cohort and the concordant subgroup not significantly different from healthy controls (P>.10 for both; Figure A2).
FIGURE A2.

Central corneal sub-basal nerve density as measured by corneal confocal microscopy, compared by cohort (top) and by discordant and concordant (Stain-Discordant) subgroups (bottom).
PATIENT-REPORTED VISUAL QUALITY OF LIFE
We also performed the comparison of patient-reported visual quality of life using VFQ-25 across discordant and concordant dry eye patients based on the stain-discordance definition (Figure A3). VFQ-25 scores were significantly different between the three main patient cohorts (P<.001), with the highest scores in the healthy control cohort (total score = 95.6), lowest in the FM cohort (total score = 82.5), and intermediate in the dry eye cohort (total score = 88.1).
FIGURE A3.

Visual quality of life as measured by Visual Function Questionnaire-25 scores, compared by cohort (top) and by Stain-Discordant subgroups (bottom).
Table A2 provides the data on the overall VFQ-25 scores and the VFQ-25 subscales for the subgroups defined as stain-discordant. Total VFQ-25 score and the subscales of general health, ocular pain, social function, mental health, and role difficulty continued to show statistically significant differences (P<.001 for all) with more similarities of the discordant dry eye subgroup with FM and concordant dry eye subgroup with healthy controls, except for the general health subscale, in which the FM cohort remained substantially lower than any of the other cohorts.
TABLE A2.
VISUAL FUNCTION QUESTIONNAIRE-25 SCORES AND SUBSCALES WITH OCULAR SURFACE STAIN-BASED DISCORDANT AND CONCORDANT SUBGROUPS
| CATEGORY | GROUP MEANS (SD) | P VALUES* | |||||||||
|---|---|---|---|---|---|---|---|---|---|---|---|
| HC (n=26) | CON (n=37) | DIS (n=11) | FM (n=23) | ANOVA | HC VS CON | HC VS DIS | HC VS FM | CON VS DIS | CON VS FM | DIS VS FM | |
| Total | 95.6 (3.3) | 88.2 (8.2) | 88.0 (6.3) | 82.5 (13.3) | <.001 | .008 | .079 | <.001 | 1.00 | .076 | .312 |
| General health | 80.8 (17.8) | 77.1 (19.5) | 77.3 (23.6) | 47.8 (21.2) | <.001 | .896 | .962 | <.001 | 1.00 | <.001 | .001 |
| General vision | 84.6 (16.3) | 86.3 (11.7) | 87.3 (10.1) | 70.9 (25.7) | .006 | .982 | .973 | .032 | .998 | .007 | .052 |
| Ocular pain | 99.0 (3.4) | 76.1 (15.0) | 70.5 (16.1) | 75.0 (17.3) | <.001 | <.001 | <.001 | <.001 | .637 | .991 | .802 |
| Social function | 100.0 (0.0) | 97.1 (6.8) | 97.7 (7.5) | 95.1 (11.1) | .143 | .438 | .824 | .098 | .996 | .730 | .764 |
| Mental health | 97.6 (3.5) | 85.4 (13.0) | 83.5 (14.9) | 87.0 (20.3) | .003 | .005 | .028 | .040 | .981 | .973 | .905 |
| Role difficulty | 100.0 (0.0) | 82.9 (21.7) | 88.6 (13.1) | 89.7 (16.3) | .001 | <.001 | .208 | .119 | .726 | .395 | .998 |
| Dependency | 100.0 (0.0) | 97.1 (8.3) | 97.0 (5.6) | 95.3 (12.0) | .258 | .546 | .734 | .198 | 1.00 | .829 | .942 |
ANOVA, analysis of variance; CON, concordant dry eye; DIS, discordant dry eye; FM, fibromyalgia; HC, healthy control.
Numbers in bold indicate statistical significance.
SYSTEMIC SENSORY EVALUATION
As reported in this thesis, systemic sensory evaluation showed a statistically significant difference between the FM and healthy control cohorts for both pressure-pain (P=.002) and auditory (P=.05) testing. With the further distinction between stain-discordant and stain-concordant dry eye subgroups, the pressure-pain testing showed the FM cohort having higher sensitivity than the other cohorts (P=.07) (Figure A4). Auditory sensitivity measurement also suggested similarity of the stain-discordant dry eye subgroup with the FM cohort and the stain-concordant dry eye subgroup with the healthy control cohort (Figure A5).
FIGURE A4.

Pressure-pain sensitivity measuring the amount of pressure (kg/cm2) at which subjects experienced moderate discomfort using the multiple random staircase method. Comparisons by cohort (top) and by Stain-Discordant subgroups (bottom).
FIGURE A5.

Auditory sensitivity measuring the decibel (dB) at which subjects experienced moderate auditory discomfort using the multiple random staircase method. Comparisons by cohort (top) and by Stain-Discordant subgroups (bottom).
PATIENT-REPORTED SYSTEMIC SYMPTOMS
Self-reported patient symptom information on pain, fatigue, mood, affect, stress, and coping mechanisms was also compared using the stain-discordant classification (Table A3).
TABLE A3.
SELF-REPORTED SYSTEMIC SYMPTOMS COLLECTED THROUGH QUESTIONNAIRES, BY OCULAR SURFACE STAIN–BASED DISCORDANT AND CONCORDANT SUBGROUPS
| INSTRUMENT | GROUP MEANS (SD) | P VALUES* | |||||||||
|---|---|---|---|---|---|---|---|---|---|---|---|
| HC (n=26) | CON (n=37) | DIS (n=11) | FM (n=23) | ANOVA | HC VS CON | HC VS DIS | HC VS FM | CON VS DIS | CON VS FM | DIS VS FM | |
| MPQ TOT | 0.6 (0.9) | 5.0 (9.1) | 6.3 (4.0) | 17.1 (7.9) | <.001 | .209 | .552 | <.001 | .990 | <.001 | .080 |
| MPQ VAS | 0.6 (0.8) | 2.1 (2.6) | 2.3 (1.6) | 6.0 (1.8) | <.001 | .207 | .588 | <.001 | .999 | <.001 | .021 |
| MFI GF | 8.4 (3.0) | 11.2 (3.9) | 7.3 (2.3) | 16.3 (2.5) | <.001 | .019 | .955 | <.001 | .189 | <.001 | <.001 |
| MFI PF | 6.6 (3.0) | 8.3 (4.0) | 7.0 (2.6) | 13.7 (2.9) | <.001 | .281 | .997 | <.001 | .898 | <.001 | .011 |
| MFI RA | 6.8 (3.0) | 9.1 (4.6) | 9.0 (1.0) | 11.4 (3.6) | .004 | .156 | .792 | .002 | .999 | .244 | .737 |
| MFI RM | 6.3 (2.4) | 8.6 (4.0) | 8.0 (4.6) | 11.5 (3.6) | <.001 | .103 | .851 | <.001 | .986 | .045 | .373 |
| MFI MF | 7.4 (3.4) | 9.2 (3.1) | 11.0 (6.6) | 14.0 (4.5) | <.001 | .313 | .430 | <.001 | .904 | .001 | .575 |
| MASQ | 67.1 (14.9) | 71.4 (21.6) | 71.3 (15.0) | 90.4 (21.9) | .004 | .769 | .986 | .003 | .999 | .026 | .431 |
| CES-D | 6.5 (6.0) | 9.2 (8.1) | 11.3 (10.4) | 16.9 (8.0) | .002 | .457 | .782 | .001 | .996 | .038 | .691 |
| PSS | 9.8 (7.8) | 12.3 (8.0) | 11.0 (9.5) | 19.1 (7.9) | .006 | .622 | .995 | .005 | .980 | .059 | .378 |
| CSQ-Cat | 0.3 (0.4) | 0.5 (0.7) | 0.8 (0.8) | 2.0 (1.1) | <.001 | .888 | .954 | <.001 | .954 | <.001 | .094 |
ANOVA, analysis of variance; CES-D, Center for Epidemiologic Studies–Depression scale; CON, concordant dry eye; CSQ-Cat, Coping Strategies Questionnaire–Catastrophizing scale; DIS, discordant dry eye; FM, fibromyalgia; HC, healthy control; MASQ, Mood and Anxiety Symptom Questionnaire; MFI GF, Multidimensional Fatigue Inventory–general fatigue; MFI MF, Multidimensional Fatigue Inventory–mental fatigue; MFI PF, Multidimensional Fatigue Inventory–physical fatigue; MFI RA, Multidimensional Fatigue Inventory–reduced activity; MFI RM, Multidimensional Fatigue Inventory–reduced motivation; MPQ TOT, McGill Pain Questionnaire–total score; MPQ VAS, McGill Pain Questionnaire–visual analog scale; PSS, Perceived Stress Scale.
Numbers in bold indicate statistical significance.
DISCUSSION
Our initial definition of discordant dry eye was based on discordance of tear production (measured by Schirmer score) in relation to severity of dry eye symptoms (measured with OSDI). However, since the tear film is much more complex than simply the presence of aqueous tears, we also defined discordance based on the presence of ocular surface staining as compared to dry eye symptoms (stain discordance). The results presented in this supplemental material provide further evidence that either definition of discordance provided a way to identify a subgroup of dry eye patients that were consistently more like patients with FM than healthy controls across a wide range of outcomes.
REFERENCES
- 1.Williams DA, Clauw DJ. Understanding fibromyalgia: lessons from the broader pain research community. J Pain. 2009;10(8):777–791. doi: 10.1016/j.jpain.2009.06.001. [DOI] [PMC free article] [PubMed] [Google Scholar]
- 2.Rodriguez MA, Afari N, Buchwald DS. Evidence for overlap between urological and nonurological unexplained clinical conditions. J Urol. 2009;182(5):2123–2131. doi: 10.1016/j.juro.2009.07.036. [DOI] [PMC free article] [PubMed] [Google Scholar]
- 3.Aaron LA, Buchwald D. A review of the evidence for overlap among unexplained clinical conditions. Ann Intern Med. 2001;134(9 Pt 2):868–881. doi: 10.7326/0003-4819-134-9_part_2-200105011-00011. [DOI] [PubMed] [Google Scholar]
- 4.Diatchenko L, Nackley AG, Slade GD, Fillingim RB, Maixner W. Idiopathic pain disorders—pathways of vulnerability. Pain. 2006;123(3):226–230. doi: 10.1016/j.pain.2006.04.015. [DOI] [PubMed] [Google Scholar]
- 5.Woolf CJ American College of Physicians, American Physiological Society. Pain: moving from symptom control toward mechanism-specific pharmacologic management. Ann Intern Med. 2004;140(6):441–451. doi: 10.7326/0003-4819-140-8-200404200-00010. [DOI] [PubMed] [Google Scholar]
- 6.Woolf CJ. Central sensitization: implications for the diagnosis and treatment of pain. Pain. 2011;152(3 Suppl):S2–15. doi: 10.1016/j.pain.2010.09.030. [DOI] [PMC free article] [PubMed] [Google Scholar]
- 7.Giamberardino MA, Costantini R, Affaitati G, et al. Viscero-visceral hyperalgesia: characterization in different clinical models. Pain. 2010;151(2):307–322. doi: 10.1016/j.pain.2010.06.023. [DOI] [PubMed] [Google Scholar]
- 8.Ablin K, Clauw DJ. From fibrositis to functional somatic syndromes to a bell-shaped curve of pain and sensory sensitivity: evolution of a clinical construct. Rheum Dis Clin North Am. 2009;35(2):233–251. doi: 10.1016/j.rdc.2009.06.006. [DOI] [PubMed] [Google Scholar]
- 9.Ablin J, Neumann L, Buskila D. Pathogenesis of fibromyalgia—a review. Joint Bone Spine. 2008;75(3):273–279. doi: 10.1016/j.jbspin.2007.09.010. [DOI] [PubMed] [Google Scholar]
- 10.Lee YC, Nassikas NJ, Clauw DJ. The role of the central nervous system in the generation and maintenance of chronic pain in rheumatoid arthritis, osteoarthritis and fibromyalgia. Arthritis Res Ther. 2011;13(2):211. doi: 10.1186/ar3306. [DOI] [PMC free article] [PubMed] [Google Scholar]
- 11.The epidemiology of dry eye disease: report of the Epidemiology Subcommittee of the International Dry Eye WorkShop (2007) Ocul Surf. 2007;5(2):93–107. doi: 10.1016/s1542-0124(12)70082-4. [DOI] [PubMed] [Google Scholar]
- 12.Gayton JL. Etiology, prevalence, and treatment of dry eye disease. Clin Ophthalmol. 2009;3:405–412. doi: 10.2147/opth.s5555. [DOI] [PMC free article] [PubMed] [Google Scholar]
- 13.Moss SE, Klein R, Klein BE. Prevalence of and risk factors for dry eye syndrome. Arch Ophthalmol. 2000;118(9):1264–1268. doi: 10.1001/archopht.118.9.1264. [DOI] [PubMed] [Google Scholar]
- 14.Schaumberg DA, Dana R, Buring JE, Sullivan DA. Prevalence of dry eye disease among US men: estimates from the Physicians’ Health Studies. Arch Ophthalmol. 2009;127(6):763–768. doi: 10.1001/archophthalmol.2009.103. [DOI] [PMC free article] [PubMed] [Google Scholar]
- 15.Schaumberg DA, Sullivan DA, Buring JE, Dana MR. Prevalence of dry eye syndrome among US women. Am J Ophthalmol. 2003;136(2):318–326. doi: 10.1016/s0002-9394(03)00218-6. [DOI] [PubMed] [Google Scholar]
- 16.Schaumberg DA, Sullivan DA, Dana MR. Epidemiology of dry eye syndrome. Adv Exp Med Biol. 2002;506(Pt B):989–998. doi: 10.1007/978-1-4615-0717-8_140. [DOI] [PubMed] [Google Scholar]
- 17.Friedman NJ. Impact of dry eye disease and treatment on quality of life. Curr Opin Ophthalmol. 2010;21(4):310–316. doi: 10.1097/ICU.0b013e32833a8c15. [DOI] [PubMed] [Google Scholar]
- 18.Pflugfelder S. Prevalence, burden, and pharmacoeconomics of dry eye disease. Am J Manag Care. 2008;14(3 Suppl):S102–S106. [PubMed] [Google Scholar]
- 19.Mertzanis P, Abetz L, Rajagopalan K, et al. The relative burden of dry eye in patients’ lives: comparisons to a US normative sample. Invest Ophthalmol Vis Sci. 2005;46(1):46–50. doi: 10.1167/iovs.03-0915. [DOI] [PubMed] [Google Scholar]
- 20.Miljanovic B, Dana R, Sullivan DA, Schaumberg DA. Impact of dry eye syndrome on vision-related quality of life. Am J Ophthalmol. 2007;143(3):409–415. doi: 10.1016/j.ajo.2006.11.060. [DOI] [PMC free article] [PubMed] [Google Scholar]
- 21.Goto E, Yagi Y, Matsumoto Y, Tsubota K. Impaired functional visual acuity of dry eye patients. Am J Ophthalmol. 2002;133(2):181–186. doi: 10.1016/s0002-9394(01)01365-4. [DOI] [PubMed] [Google Scholar]
- 22.Ishida R, Kojima T, Dogru M, et al. The application of a new continuous functional visual acuity measurement system in dry eye syndromes. Am J Ophthalmol. 2005;139(2):253–258. doi: 10.1016/j.ajo.2004.08.075. [DOI] [PubMed] [Google Scholar]
- 23.Schiffman RM, Walt JG, Jacobsen G, Doyle JJ, Lebovics G, Sumner W. Utility assessment among patients with dry eye disease. Ophthalmology. 2003;110(7):1412–1419. doi: 10.1016/S0161-6420(03)00462-7. [DOI] [PubMed] [Google Scholar]
- 24.Buchholz P, Steeds CS, Stern LS, et al. Utility assessment to measure the impact of dry eye disease. Ocul Surf. 2006;4(3):155–161. doi: 10.1016/s1542-0124(12)70043-5. [DOI] [PubMed] [Google Scholar]
- 25.Yu J, Asche CV, Fairchild CJ. The economic burden of dry eye disease in the United States: a decision tree analysis. Cornea. 2011;30(4):379–387. doi: 10.1097/ICO.0b013e3181f7f363. [DOI] [PubMed] [Google Scholar]
- 26.Reddy P, Grad O, Rajagopalan K. The economic burden of dry eye: a conceptual framework and preliminary assessment. Cornea. 2004;23(8):751–761. doi: 10.1097/01.ico.0000134183.47687.75. [DOI] [PubMed] [Google Scholar]
- 27.Research in dry eye: report of the Research Subcommittee of the International Dry Eye WorkShop (2007) Ocul Surf. 2007;5(2):179–193. doi: 10.1016/s1542-0124(12)70086-1. [DOI] [PubMed] [Google Scholar]
- 28.Lemp MA. Report of the National Eye Institute/Industry workshop on Clinical Trials in Dry Eyes. CLAO J. 1995;21(4):221–232. [PubMed] [Google Scholar]
- 29.Foulks GN. The correlation between the tear film lipid layer and dry eye disease. Surv Ophthalmol. 2007;52(4):369–374. doi: 10.1016/j.survophthal.2007.04.009. [DOI] [PubMed] [Google Scholar]
- 30.Liu H, Begley C, Chen M, et al. A link between tear instability and hyperosmolarity in dry eye. Invest Ophthalmol Vis Sci. 2009;50(8):3671–3679. doi: 10.1167/iovs.08-2689. [DOI] [PubMed] [Google Scholar]
- 31.Messmer EM, Bulgen M, Kampik A. Hyperosmolarity of the tear film in dry eye syndrome. Dev Ophthalmol. 2010;45:129–138. doi: 10.1159/000315026. [DOI] [PubMed] [Google Scholar]
- 32.Suzuki M, Massingale ML, Ye F, et al. Tear osmolarity as a biomarker for dry eye disease severity. Invest Ophthalmol Vis Sci. 2010;51(9):4557–4561. doi: 10.1167/iovs.09-4596. [DOI] [PubMed] [Google Scholar]
- 33.Nichols KK, Nichols JJ, Lynn Mitchell G. The relation between tear film tests in patients with dry eye disease. Ophthalmic Physiol Opt. 2003;23(6):553–560. doi: 10.1046/j.1475-1313.2003.00153.x. [DOI] [PubMed] [Google Scholar]
- 34.Tomlinson A, Khanal S, Ramaesh K, Diaper C, McFadyen A. Tear film osmolarity: determination of a referent for dry eye diagnosis. Invest Ophthalmol Vis Sci. 2006;47(10):4309–4315. doi: 10.1167/iovs.05-1504. [DOI] [PubMed] [Google Scholar]
- 35.Enriquez-de-Salamanca A, Castellanos E, Stern ME, et al. Tear cytokine and chemokine analysis and clinical correlations in evaporative-type dry eye disease. Mol Vis. 2010;16:862–873. [PMC free article] [PubMed] [Google Scholar]
- 36.Pflugfelder SC, Jones D, Ji Z, Afonso A, Monroy D. Altered cytokine balance in the tear fluid and conjunctiva of patients with Sjogren’s syndrome keratoconjunctivitis sicca. Curr Eye Res. 1999;19(3):201–211. doi: 10.1076/ceyr.19.3.201.5309. [DOI] [PubMed] [Google Scholar]
- 37.Chotikavanich S, de Paiva C, Li D, et al. Production and activity of matrix metalloproteinase-9 on the ocular surface increase in dysfunctional tear syndrome. Invest Ophthalmol Vis Sci. 2009;50(7):3203–3209. doi: 10.1167/iovs.08-2476. [DOI] [PMC free article] [PubMed] [Google Scholar]
- 38.Stern ME, Gao J, Siemasko KF, Beuerman RW, Pflugfelder SC. The role of the lacrimal functional unit in the pathophysiology of dry eye. Exp Eye Res. 2004;78(3):409–416. doi: 10.1016/j.exer.2003.09.003. [DOI] [PubMed] [Google Scholar]
- 39.Dartt DA. Dysfunctional neural regulation of lacrimal gland secretion and its role in the pathogenesis of dry eye syndromes. Ocul Surf. 2004;2(2):76–91. doi: 10.1016/s1542-0124(12)70146-5. [DOI] [PubMed] [Google Scholar]
- 40.Tsubota K, Fujita H, Tsuzaka K, Takeuchi T. Quantitative analysis of lacrimal gland function, apoptotic figures, Fas and Fas ligand expression of lacrimal glands in dry eye patients. Exp Eye Res. 2003;76(2):233–240. doi: 10.1016/s0014-4835(02)00279-8. [DOI] [PubMed] [Google Scholar]
- 41.Williamson J, Gibson AA, Wilson T, Forrester JV, Whaley K, Dick WC. Histology of the lacrimal gland in keratoconjunctivitis sicca. Br J Ophthalmol. 1973;57(11):852–858. doi: 10.1136/bjo.57.11.852. [DOI] [PMC free article] [PubMed] [Google Scholar]
- 42.Pflugfelder SC, Tseng SC, Yoshino K, Monroy D, Felix C, Reis BL. Correlation of goblet cell density and mucosal epithelial membrane mucin expression with rose bengal staining in patients with ocular irritation. Ophthalmology. 1997;104(2):223–235. doi: 10.1016/s0161-6420(97)30330-3. [DOI] [PubMed] [Google Scholar]
- 43.Ralph RA. Conjunctival goblet cell density in normal subjects and in dry eye syndromes. Invest Ophthalmol. 1975;14(4):299–302. [PubMed] [Google Scholar]
- 44.Benitez del Castillo JM, Wasfy MA, Fernandez C, Garcia-Sanchez J. An in vivo confocal masked study on corneal epithelium and subbasal nerves in patients with dry eye. Invest Ophthalmol Vis Sci. 2004;45(9):3030–3035. doi: 10.1167/iovs.04-0251. [DOI] [PubMed] [Google Scholar]
- 45.Sullivan BD, Evans JE, Dana MR, Sullivan DA. Influence of aging on the polar and neutral lipid profiles in human meibomian gland secretions. Arch Ophthalmol. 2006;124(9):1286–1292. doi: 10.1001/archopht.124.9.1286. [DOI] [PubMed] [Google Scholar]
- 46.Sullivan BD, Evans JE, Dana MR, Sullivan DA. Impact of androgen deficiency on the lipid profiles in human meibomian gland secretions. Adv Exp Med Biol. 2002;506(Pt A):449–458. doi: 10.1007/978-1-4615-0717-8_63. [DOI] [PubMed] [Google Scholar]
- 47.Shimazaki J, Sakata M, Tsubota K. Ocular surface changes and discomfort in patients with meibomian gland dysfunction. Arch Ophthalmol. 1995;113(10):1266–1270. doi: 10.1001/archopht.1995.01100100054027. [DOI] [PubMed] [Google Scholar]
- 48.Hykin PG, Bron AJ. Age-related morphological changes in lid margin and meibomian gland anatomy. Cornea. 1992;11(4):334–342. doi: 10.1097/00003226-199207000-00012. [DOI] [PubMed] [Google Scholar]
- 49.Yoon KC, Park CS, You IC, et al. Expression of CXCL9, -10, -11, and CXCR3 in the tear film and ocular surface of patients with dry eye syndrome. Invest Ophthalmol Vis Sci. 2010;51(2):643–650. doi: 10.1167/iovs.09-3425. [DOI] [PMC free article] [PubMed] [Google Scholar]
- 50.Tsubota K, Fujihara T, Saito K, Takeuchi T. Conjunctival epithelium expression of HLA-DR in dry eye patients. Ophthalmologica. 1999;213(1):16–19. doi: 10.1159/000027387. [DOI] [PubMed] [Google Scholar]
- 51.Brignole F, Pisella PJ, Goldschild M, De Saint Jean M, Goguel A, Baudouin C. Flow cytometric analysis of inflammatory markers in conjunctival epithelial cells of patients with dry eyes. Invest Ophthalmol Vis Sci. 2000;41(6):1356–1363. [PubMed] [Google Scholar]
- 52.Solomon A, Dursun D, Liu Z, Xie Y, Macri A, Pflugfelder SC. Pro- and anti-inflammatory forms of interleukin-1 in the tear fluid and conjunctiva of patients with dry-eye disease. Invest Ophthalmol Vis Sci. 2001;42(10):2283–2292. [PubMed] [Google Scholar]
- 53.The definition and classification of dry eye disease: report of the Definition and Classification Subcommittee of the International Dry Eye WorkShop (2007) Ocul Surf. 2007;5(2):75–92. doi: 10.1016/s1542-0124(12)70081-2. [DOI] [PubMed] [Google Scholar]
- 54.Belmonte C, Acosta MC, Gallar J. Neural basis of sensation in intact and injured corneas. Exp Eye Res. 2004;78(3):513–525. doi: 10.1016/j.exer.2003.09.023. [DOI] [PubMed] [Google Scholar]
- 55.Belmonte C, Aracil A, Acosta MC, Luna C, Gallar J. Nerves and sensations from the eye surface. Ocul Surf. 2004;2(4):248–253. doi: 10.1016/s1542-0124(12)70112-x. [DOI] [PubMed] [Google Scholar]
- 56.Dastjerdi M, Dana R. Corneal nerve alterations in dry eye-associated ocular surface disease. Int Ophthalmol Clin. 2009;49(1):11–20. doi: 10.1097/IIO.0b013e31819242c9. [DOI] [PubMed] [Google Scholar]
- 57.Muller LJ, Marfurt CF, Kruse F, Tervo TM. Corneal nerves: structure, contents and function. Exp Eye Res. 2003;76(5):521–542. doi: 10.1016/s0014-4835(03)00050-2. [DOI] [PubMed] [Google Scholar]
- 58.Ambrosio R, Tervo T, Wilson S. LASIK-associated dry eye and neurotrophic epitheliopathy: pathophysiology and strategies for prevention and treatment. J Rrefract Surg. 2008;24(4):396–407. doi: 10.3928/1081597X-20080401-14. [DOI] [PubMed] [Google Scholar]
- 59.Bourcier T, Acosta MC, Borderie V, et al. Decreased corneal sensitivity in patients with dry eye. Invest Ophthalmol Vis Sci. 2005;46(7):2341–2345. doi: 10.1167/iovs.04-1426. [DOI] [PubMed] [Google Scholar]
- 60.Belmonte C. Eye dryness sensations after refractive surgery: impaired tear secretion or “phantom” cornea? J Refract Surg. 2007;23(6):598–602. doi: 10.3928/1081-597X-20070601-11. [DOI] [PubMed] [Google Scholar]
- 61.Nettune GR, Pflugfelder SC. Post-LASIK tear dysfunction and dysesthesia. Ocul Surf. 2010;8(3):135–145. doi: 10.1016/s1542-0124(12)70224-0. [DOI] [PMC free article] [PubMed] [Google Scholar]
- 62.De Paiva C, Pflugfelder S. Corneal epitheliopathy of dry eye induces hyperesthesia to mechanical air jet stimulation. Am J Ophthalmol. 2004;137(1):109–115. doi: 10.1016/s0002-9394(03)00897-3. [DOI] [PubMed] [Google Scholar]
- 63.Benitez-Del-Castillo JM, Acosta MC, Wassfi MA, et al. Relation between corneal innervation with confocal microscopy and corneal sensitivity with noncontact esthesiometry in patients with dry eye. Invest Ophthalmol Vis Sci. 2007;48(1):173–181. doi: 10.1167/iovs.06-0127. [DOI] [PubMed] [Google Scholar]
- 64.Erdelyi B, Kraak R, Zhivov A, Guthoff R, Nemeth J. In vivo confocal laser scanning microscopy of the cornea in dry eye. Graefes Arch Clin Exp Ophthalmol. 2007;245(1):39–44. doi: 10.1007/s00417-006-0375-6. [DOI] [PubMed] [Google Scholar]
- 65.Hosal BM, Ornek N, Zilelioglu G, Elhan AH. Morphology of corneal nerves and corneal sensation in dry eye: a preliminary study. Eye (Lond) 2005;19(12):1276–1279. doi: 10.1038/sj.eye.6701760. [DOI] [PubMed] [Google Scholar]
- 66.Zhang M, Chen J, Luo L, Xiao Q, Sun M, Liu Z. Altered corneal nerves in aqueous tear deficiency viewed by in vivo confocal microscopy. Cornea. 2005;24(7):818–824. doi: 10.1097/01.ico.0000154402.01710.95. [DOI] [PubMed] [Google Scholar]
- 67.Zhang X, Chen Q, Chen W, Cui L, Ma H, Lu F. Tear dynamics and corneal confocal microscopy of subjects with mild self-reported office dry eye. Ophthalmology. 2011;118(5):902–907. doi: 10.1016/j.ophtha.2010.08.033. [DOI] [PubMed] [Google Scholar]
- 68.Villani E, Galimberti D, Viola F, Mapelli C, Ratiglia R. The cornea in Sjogren’s syndrome: an in vivo confocal study. Invest Ophthalmol Vis Sci. 2007;48(5):2017–2022. doi: 10.1167/iovs.06-1129. [DOI] [PubMed] [Google Scholar]
- 69.Tuominen IS, Konttinen YT, Vesaluoma MH, Moilanen JA, Helinto M, Tervo TM. Corneal innervation and morphology in primary Sjogren’s syndrome. Invest Ophthalmol Vis Sci. 2003;44(6):2545–2549. doi: 10.1167/iovs.02-1260. [DOI] [PubMed] [Google Scholar]
- 70.Tuisku IS, Konttinen YT, Konttinen LM, Tervo TM. Alterations in corneal sensitivity and nerve morphology in patients with primary Sjogren’s syndrome. Exp Eye Res. 2008;86(6):879–885. doi: 10.1016/j.exer.2008.03.002. [DOI] [PubMed] [Google Scholar]
- 71.Ceresara G, Fogagnolo P, De Cilla S, et al. Corneal involvement in Crohn’s disease: an in vivo confocal microscopy study. Cornea. 2011;30(2):136–142. doi: 10.1097/ICO.0b013e3181e9ac98. [DOI] [PubMed] [Google Scholar]
- 72.Villani E, Galimberti D, Viola F, Mapelli C, Del Papa N, Ratiglia R. Corneal involvement in rheumatoid arthritis: an in vivo confocal study. Invest Ophthalmol Vis Sci. 2008;49(2):560–564. doi: 10.1167/iovs.07-0893. [DOI] [PubMed] [Google Scholar]
- 73.Tavakoli M, Kallinikos P, Iqbal A, et al. Corneal confocal microscopy detects improvement in corneal nerve morphology with an improvement in risk factors for diabetic neuropathy. Diabet Med. 2011;28(10):1261–1267. doi: 10.1111/j.1464-5491.2011.03372.x. [DOI] [PMC free article] [PubMed] [Google Scholar]
- 74.Hossain P, Sachdev A, Malik RA. Early detection of diabetic peripheral neuropathy with corneal confocal microscopy. Lancet. 2005;366(9494):1340–1343. doi: 10.1016/S0140-6736(05)67546-0. [DOI] [PubMed] [Google Scholar]
- 75.Gemignani F, Ferrari G, Vitetta F, Giovanelli M, Macaluso C, Marbini A. Non-length-dependent small fibre neuropathy. Confocal microscopy study of the corneal innervation. J Neurol Neurosurg Psychiatry. 2010;81(7):731–733. doi: 10.1136/jnnp.2009.177303. [DOI] [PubMed] [Google Scholar]
- 76.Generali E, Cantarini L, Selmi C. Ocular involvement in systemic autoimmune diseases. Clin Rev Allergy Immunol. 2015;49(3):263–270. doi: 10.1007/s12016-015-8518-3. [DOI] [PubMed] [Google Scholar]
- 77.Oaklander AL, Fields HL. Reply: Is reflex sympathetic dystrophy/complex regional pain syndrome type I a small-fiber neuropathy? Ann Neurol. 2010;68(1):116–117. doi: 10.1002/ana.22084. [DOI] [PubMed] [Google Scholar]
- 78.Oaklander AL. The density of remaining nerve endings in human skin with and without postherpetic neuralgia after shingles. Pain. 2001;92(1–2):139–145. doi: 10.1016/s0304-3959(00)00481-4. [DOI] [PubMed] [Google Scholar]
- 79.Yunus MB. Fibromyalgia and overlapping disorders: the unifying concept of central sensitivity syndromes. Semin Arthritis Rheum. 2007;36(6):339–356. doi: 10.1016/j.semarthrit.2006.12.009. [DOI] [PubMed] [Google Scholar]
- 80.Cardona G, Marcellan C, Fornieles A, Vilaseca M, Quevedo L. Temporal stability in the perception of dry eye ocular discomfort symptoms. Optom Vis Sci. 2010;87(12):1023–1029. doi: 10.1097/OPX.0b013e3181ff99ab. [DOI] [PubMed] [Google Scholar]
- 81.Foulks GN. Challenges and pitfalls in clinical trials of treatments for dry eye. Ocul Surf. 2003;1(1):20–30. doi: 10.1016/s1542-0124(12)70004-6. [DOI] [PubMed] [Google Scholar]
- 82.Nichols KK, Mitchell GL, Zadnik K. Performance and repeatability of the NEI-VFQ-25 in patients with dry eye. Cornea. 2002;21(6):578–583. doi: 10.1097/00003226-200208000-00009. [DOI] [PubMed] [Google Scholar]
- 83.Nichols KK, Mitchell GL, Zadnik K. The repeatability of clinical measurements of dry eye. Cornea. 2004;23(3):272–285. doi: 10.1097/00003226-200404000-00010. [DOI] [PubMed] [Google Scholar]
- 84.Walker PM, Lane KJ, Ousler GW, 3rd, Abelson MB. Diurnal variation of visual function and the signs and symptoms of dry eye. Cornea. 2010;29(6):607–612. doi: 10.1097/ICO.0b013e3181c11e45. [DOI] [PubMed] [Google Scholar]
- 85.Nichols KK, Smith JA. Association of clinical diagnostic tests and dry eye surveys: the NEI-VFQ-25 and the OSDI. Adv Exp Med Biol. 2002;506(Pt B):1177–1181. doi: 10.1007/978-1-4615-0717-8_166. [DOI] [PubMed] [Google Scholar]
- 86.Begley CG, Chalmers RL, Abetz L, et al. The relationship between habitual patient-reported symptoms and clinical signs among patients with dry eye of varying severity. Invest Ophthalmol Vis Sci. 2003;44(11):4753–4761. doi: 10.1167/iovs.03-0270. [DOI] [PubMed] [Google Scholar]
- 87.Mizuno Y, Yamada M, Miyake Y. Association between clinical diagnostic tests and health-related quality of life surveys in patients with dry eye syndrome. Jpn J Ophthalmol. 2010;54(4):259–265. doi: 10.1007/s10384-010-0812-2. [DOI] [PubMed] [Google Scholar]
- 88.Moore JE, Graham JE, Goodall EA, et al. Concordance between common dry eye diagnostic tests. Br J Ophthalmol. 2009;93(1):66–72. doi: 10.1136/bjo.2007.131722. [DOI] [PMC free article] [PubMed] [Google Scholar]
- 89.Macri A, Pflugfelder S. Correlation of the Schirmer 1 and fluorescein clearance tests with the severity of corneal epithelial and eyelid disease. Arch Ophthalmol. 2000;118(12):1632–1638. doi: 10.1001/archopht.118.12.1632. [DOI] [PubMed] [Google Scholar]
- 90.Adatia FA, Michaeli-Cohen A, Naor J, Caffery B, Bookman A, Slomovic A. Correlation between corneal sensitivity, subjective dry eye symptoms and corneal staining in Sjogren’s syndrome. Can J Ophthalmol. 2004;39(7):767–771. doi: 10.1016/s0008-4182(04)80071-1. [DOI] [PubMed] [Google Scholar]
- 91.Afonso AA, Monroy D, Stern ME, Feuer WJ, Tseng SC, Pflugfelder SC. Correlation of tear fluorescein clearance and Schirmer test scores with ocular irritation symptoms. Ophthalmology. 1999;106(4):803–810. doi: 10.1016/S0161-6420(99)90170-7. [DOI] [PubMed] [Google Scholar]
- 92.Goren MB, Goren SB. Diagnostic tests in patients with symptoms of keratoconjunctivitis sicca. Am J Ophthalmol. 1988;106(5):570–574. doi: 10.1016/0002-9394(88)90587-9. [DOI] [PubMed] [Google Scholar]
- 93.Nichols KK, Nichols JJ, Mitchell GL. The lack of association between signs and symptoms in patients with dry eye disease. Cornea. 2004;23(8):762–770. doi: 10.1097/01.ico.0000133997.07144.9e. [DOI] [PubMed] [Google Scholar]
- 94.Rosenthal P, Baran I, Jacobs DS. Corneal pain without stain: is it real? Ocul Surf. 2009;7(1):28–40. doi: 10.1016/s1542-0124(12)70290-2. [DOI] [PubMed] [Google Scholar]
- 95.Pult H, Purslow C, Murphy PJ. The relationship between clinical signs and dry eye symptoms. Eye (Lond) 2011;25(4):502–510. doi: 10.1038/eye.2010.228. [DOI] [PMC free article] [PubMed] [Google Scholar]
- 96.Sullivan BD, Crews LA, Messmer EM, et al. Correlations between commonly used objective signs and symptoms for the diagnosis of dry eye disease: clinical implications. Acta Ophthalmol. 2014;92(2):161–166. doi: 10.1111/aos.12012. [DOI] [PubMed] [Google Scholar]
- 97.Bartlett JD, Keith MS, Sudharshan L, Snedecor SJ. Associations between signs and symptoms of dry eye disease: a systematic review. Clin Ophthalmol. 2015;9:1719–1730. doi: 10.2147/OPTH.S89700. [DOI] [PMC free article] [PubMed] [Google Scholar]
- 98.Clauw DJ, Witter J. Pain and rheumatology: thinking outside the joint. Arthritis Rheum. 2009;60(2):321–324. doi: 10.1002/art.24326. [DOI] [PubMed] [Google Scholar]
- 99.Tracey I, Bushnell MC. How neuroimaging studies have challenged us to rethink: is chronic pain a disease? J Pain. 2009;10(11):1113–1120. doi: 10.1016/j.jpain.2009.09.001. [DOI] [PubMed] [Google Scholar]
- 100.Giesecke T, Gracely RH, Grant MA, et al. Evidence of augmented central pain processing in idiopathic chronic low back pain. Arthritis Rheum. 2004;50(2):613–623. doi: 10.1002/art.20063. [DOI] [PubMed] [Google Scholar]
- 101.Clauw DJ, Williams D, Lauerman W, et al. Pain sensitivity as a correlate of clinical status in individuals with chronic low back pain. Spine. 1999;24(19):2035–2041. doi: 10.1097/00007632-199910010-00013. [DOI] [PubMed] [Google Scholar]
- 102.Murphy SL, Lyden AK, Phillips K, Clauw DJ, Williams DA. Association between pain, radiographic severity, and centrally-mediated symptoms in women with knee osteoarthritis. Arthritis Care Res (Hoboken) 2011;63(11):1543–1549. doi: 10.1002/acr.20583. [DOI] [PMC free article] [PubMed] [Google Scholar]
- 103.Aaron LA, Burke MM, Buchwald D. Overlapping conditions among patients with chronic fatigue syndrome, fibromyalgia, and temporomandibular disorder. Arch Intern Med. 2000;160(2):221–227. doi: 10.1001/archinte.160.2.221. [DOI] [PubMed] [Google Scholar]
- 104.Warren JW, Howard FM, Cross RK, et al. Antecedent nonbladder syndromes in case-control study of interstitial cystitis/painful bladder syndrome. Urology. 2009;73(1):52–57. doi: 10.1016/j.urology.2008.06.031. [DOI] [PubMed] [Google Scholar]
- 105.Bannister K, Bee LA, Dickenson AH. Preclinical and early clinical investigations related to monoaminergic pain modulation. Neurotherapeutics. 2009;6(4):703–712. doi: 10.1016/j.nurt.2009.07.009. [DOI] [PMC free article] [PubMed] [Google Scholar]
- 106.Fukuda K, Nisenbaum R, Stewart G, et al. Chronic multisymptom illness affecting Air Force veterans of the Gulf War. JAMA. 1998;280(11):981–988. doi: 10.1001/jama.280.11.981. [DOI] [PubMed] [Google Scholar]
- 107.Khan AA, Khan A, Harezlak J, Tu W, Kroenke K. Somatic symptoms in primary care: etiology and outcome. Psychosomatics. 2003;44(6):471–478. doi: 10.1176/appi.psy.44.6.471. [DOI] [PubMed] [Google Scholar]
- 108.Petzke F, Clauw DJ, Ambrose K, Khine A, Gracely RH. Increased pain sensitivity in fibromyalgia: effects of stimulus type and mode of presentation. Pain. 2003;105(3):403–413. doi: 10.1016/S0304-3959(03)00204-5. [DOI] [PubMed] [Google Scholar]
- 109.Giesecke J, Reed BD, Haefner HK, Giesecke T, Clauw DJ, Gracely RH. Quantitative sensory testing in vulvodynia patients and increased peripheral pressure pain sensitivity. Obstet Gynecol. 2004;104(1):126–133. doi: 10.1097/01.AOG.0000129238.49397.4e. [DOI] [PubMed] [Google Scholar]
- 110.Whitehead WE, Holtkotter B, Enck P, et al. Tolerance for rectosigmoid distention in irritable bowel syndrome. Gastroenterology. 1990;98(5 Pt 1):1187–1192. doi: 10.1016/0016-5085(90)90332-u. [DOI] [PubMed] [Google Scholar]
- 111.Leffler AS, Hansson P, Kosek E. Somatosensory perception in a remote pain-free area and function of diffuse noxious inhibitory controls (DNIC) in patients suffering from long-term trapezius myalgia. Eur J Pain. 2002;6(2):149–159. doi: 10.1053/eujp.2001.0312. [DOI] [PubMed] [Google Scholar]
- 112.Maixner W, Fillingim R, Booker D, Sigurdsson A. Sensitivity of patients with painful temporomandibular disorders to experimentally evoked pain. Pain. 1995;63(3):341–351. doi: 10.1016/0304-3959(95)00068-2. [DOI] [PubMed] [Google Scholar]
- 113.Kashima K, Rahman OI, Sakoda S, Shiba R. Increased pain sensitivity of the upper extremities of TMD patients with myalgia to experimentally-evoked noxious stimulation: possibility of worsened endogenous opioid systems. Cranio. 1999;17(4):241–246. doi: 10.1080/08869634.1999.11746100. [DOI] [PubMed] [Google Scholar]
- 114.Wilder-Smith OH, Tassonyi E, Arendt-Nielsen L. Preoperative back pain is associated with diverse manifestations of central neuroplasticity. Pain. 2002;97(3):189–194. doi: 10.1016/S0304-3959(01)00430-4. [DOI] [PubMed] [Google Scholar]
- 115.Blanchard EB, Andrasik F, Appelbaum KA, et al. The efficacy and cost-effectiveness of minimal-therapist-contact, non-drug treatments of chronic migraine and tension headache. Headache. 1985;25(4):214–220. doi: 10.1111/j.1526-4610.1985.hed2504214.x. [DOI] [PubMed] [Google Scholar]
- 116.Rosenthal P, Borsook D. Ocular neuropathic pain. Br J Ophthalmol. 2016;100(101):128–134. doi: 10.1136/bjophthalmol-2014-306280. [DOI] [PMC free article] [PubMed] [Google Scholar]
- 117.Wolfe F, Ross K, Anderson J, Russell IJ, Hebert L. The prevalence and characteristics of fibromyalgia in the general population. Arthritis Rheum. 1995;38(1):19–28. doi: 10.1002/art.1780380104. [DOI] [PubMed] [Google Scholar]
- 118.Clauw DJ. Fibromyalgia: a clinical review. JAMA. 2014;311(15):1547–1555. doi: 10.1001/jama.2014.3266. [DOI] [PubMed] [Google Scholar]
- 119.Wolfe F, Clauw DJ, Fitzcharles MA, et al. The American College of Rheumatology preliminary diagnostic criteria for fibromyalgia and measurement of symptom severity. Arthritis Care Res. 2010;62(5):600–610. doi: 10.1002/acr.20140. [DOI] [PubMed] [Google Scholar]
- 120.Geisser ME, Strader DC, Petzke F, Gracely RH, Clauw DJ, Williams DA. Comorbid somatic symptoms and functional status in patients with fibromyalgia and chronic fatigue syndrome: sensory amplification as a common mechanism. Psychosomatics. 2008;49(3):235–242. doi: 10.1176/appi.psy.49.3.235. [DOI] [PubMed] [Google Scholar]
- 121.English B. Neural and psychosocial mechanisms of pain sensitivity in fibromyalgia. Pain Manag Nurs. 2014;15(2):530–538. doi: 10.1016/j.pmn.2012.07.009. [DOI] [PubMed] [Google Scholar]
- 122.Williams DA, Arnold LM. Measures of fibromyalgia: Fibromyalgia Impact Questionnaire (FIQ), Brief Pain Inventory (BPI), Multidimensional Fatigue Inventory (MFI-20), Medical Outcomes Study (MOS) Sleep Scale, and Multiple Ability Self-Report Questionnaire (MASQ) Arthritis Care Res (Hoboken) 2011;63( Suppl 11):S86–97. doi: 10.1002/acr.20531. [DOI] [PMC free article] [PubMed] [Google Scholar]
- 123.Malin K, Littlejohn GO. Stress modulates key psychological processes and characteristic symptoms in females with fibromyalgia. Clin Exp Rheumatol. 2013;31(6 Suppl 79):S64–71. [PubMed] [Google Scholar]
- 124.McLean SA, Clauw DJ. Biomedical models of fibromyalgia. Disabil Rehabil. 2005;27(12):659–665. doi: 10.1080/09638280400009048. [DOI] [PubMed] [Google Scholar]
- 125.Gracely RH, Petzke F, Wolf JM, Clauw DJ. Functional magnetic resonance imaging evidence of augmented pain processing in fibromyalgia. Arthritis Rheum. 2002;46(5):1333–1343. doi: 10.1002/art.10225. [DOI] [PubMed] [Google Scholar]
- 126.Arroyo JF, Cohen ML. Abnormal responses to electrocutaneous stimulation in fibromyalgia. J Rheumatol. 1993;20(11):1925–1931. [PubMed] [Google Scholar]
- 127.Geisser ME, Glass JM, Rajcevska LD, et al. A psychophysical study of auditory and pressure sensitivity in patients with fibromyalgia and healthy controls. J Pain. 2008;9(5):417–422. doi: 10.1016/j.jpain.2007.12.006. [DOI] [PubMed] [Google Scholar]
- 128.McDermid AJ, Rollman GB, McCain GA. Generalized hypervigilance in fibromyalgia: evidence of perceptual amplification. Pain. 1996;66(2–3):133–144. doi: 10.1016/0304-3959(96)03059-x. [DOI] [PubMed] [Google Scholar]
- 129.Dinerman H, Goldenberg DL, Felson DT. A prospective evaluation of 118 patients with the fibromyalgia syndrome: prevalence of Raynaud’s phenomenon, sicca symptoms, ANA, low complement, and Ig deposition at the dermal-epidermal junction. J Rheumatol. 1986;13(2):368–373. [PubMed] [Google Scholar]
- 130.Barton A, Pal B, Whorwell PJ, Marshall D. Increased prevalence of sicca complex and fibromyalgia in patients with irritable bowel syndrome. Am J Gastroenterol. 1999;94(7):1898–1901. doi: 10.1111/j.1572-0241.1999.01146.x. [DOI] [PubMed] [Google Scholar]
- 131.Gunaydin I, Terhorst T, Eckstein A, Daikeler T, Kanz L, Kotter I. Assessment of keratoconjunctivitis sicca in patients with fibromyalgia: results of a prospective study. Rheumatol Int. 1999;19(1–2):7–9. doi: 10.1007/s002960050090. [DOI] [PubMed] [Google Scholar]
- 132.Gallar J, Morales C, Freire V, Acosta MC, Belmonte C, Duran JA. Decreased corneal sensitivity and tear production in fibromyalgia. Invest Ophthalmol Vis Sci. 2009;50(9):4129–4134. doi: 10.1167/iovs.08-3083. [DOI] [PubMed] [Google Scholar]
- 133.Turkyilmaz K, Turkyilmaz AK, Kurt EE, Kurt A, Oner V. Dry eye in patients with fibromyalgia and its relevance to functional and emotional status. Cornea. 2013;32(6):862–866. doi: 10.1097/ICO.0b013e318285c912. [DOI] [PubMed] [Google Scholar]
- 134.Vehof J, Smitt-Kamminga NS, Kozareva D, Nibourg SA, Hammond CJ. Clinical characteristics of dry eye patients with chronic pain syndromes. Am J Ophthalmol. 2016 Feb;162:59–65. doi: 10.1016/j.ajo.2015.11.017. [DOI] [PubMed] [Google Scholar]
- 135.Cagnie B, Coppieters I, Denecker S, Six J, Danneels L, Meeus M. Central sensitization in fibromyalgia? A systematic review on structural and functional brain MRI. Semin Arthritis Rheum. 2014;44(1):68–75. doi: 10.1016/j.semarthrit.2014.01.001. [DOI] [PubMed] [Google Scholar]
- 136.Davis KD, Moayedi M. Central mechanisms of pain revealed through functional and structural MRI. J Neuroimmune Pharmacol. 2013;8(3):518–534. doi: 10.1007/s11481-012-9386-8. [DOI] [PubMed] [Google Scholar]
- 137.Valet M, Gundel H, Sprenger T, et al. Patients with pain disorder show gray-matter loss in pain-processing structures: a voxelbased morphometric study. Psychosom Med. 2009;71(1):49–56. doi: 10.1097/PSY.0b013e31818d1e02. [DOI] [PubMed] [Google Scholar]
- 138.Burgmer M, Gaubitz M, Konrad C, et al. Decreased gray matter volumes in the cingulo-frontal cortex and the amygdala in patients with fibromyalgia. Psychosom Med. 2009;71(5):566–573. doi: 10.1097/PSY.0b013e3181a32da0. [DOI] [PubMed] [Google Scholar]
- 139.Apkarian AV, Sosa Y, Sonty S, et al. Chronic back pain is associated with decreased prefrontal and thalamic gray matter density. J Neurosci. 2004;24(46):10410–10415. doi: 10.1523/JNEUROSCI.2541-04.2004. [DOI] [PMC free article] [PubMed] [Google Scholar]
- 140.Pujol J, Lopez-Sola M, Ortiz H, et al. Mapping brain response to pain in fibromyalgia patients using temporal analysis of FMRI. PLoS One. 2009;4(4):e5224. doi: 10.1371/journal.pone.0005224. [DOI] [PMC free article] [PubMed] [Google Scholar]
- 141.Cook DB, Lange G, Ciccone DS, Liu WC, Steffener J, Natelson BH. Functional imaging of pain in patients with primary fibromyalgia. J Rheumatol. 2004;31(2):364–378. [PubMed] [Google Scholar]
- 142.Ichesco E, Schmidt-Wilcke T, Bhavsar R, et al. Altered resting state connectivity of the insular cortex in individuals with fibromyalgia. J Pain. 2014;15(8):815–826 e811. doi: 10.1016/j.jpain.2014.04.007. [DOI] [PMC free article] [PubMed] [Google Scholar]
- 143.Loggia ML, Kim J, Gollub RL, et al. Default mode network connectivity encodes clinical pain: an arterial spin labeling study. Pain. 2013;154(1):24–33. doi: 10.1016/j.pain.2012.07.029. [DOI] [PMC free article] [PubMed] [Google Scholar]
- 144.Napadow V, Kim J, Clauw DJ, Harris RE. Decreased intrinsic brain connectivity is associated with reduced clinical pain in fibromyalgia. Arthritis Rheum. 2012;64(7):2398–2403. doi: 10.1002/art.34412. [DOI] [PMC free article] [PubMed] [Google Scholar]
- 145.Jensen KB, Kosek E, Petzke F, et al. Evidence of dysfunctional pain inhibition in fibromyalgia reflected in rACC during provoked pain. Pain. 2009;144(1–2):95–100. doi: 10.1016/j.pain.2009.03.018. [DOI] [PubMed] [Google Scholar]
- 146.Kim SH. Skin biopsy findings: implications for the pathophysiology of fibromyalgia. Med Hypotheses. 2007;69(1):141–144. doi: 10.1016/j.mehy.2006.10.057. [DOI] [PubMed] [Google Scholar]
- 147.Kim SH, Kim DH, Oh DH, Clauw DJ. Characteristic electron microscopic findings in the skin of patients with fibromyalgia—preliminary study. Clinical Rheumatol. 2008;27(3):407–411. doi: 10.1007/s10067-007-0807-7. [DOI] [PubMed] [Google Scholar]
- 148.Salemi S, Aeschlimann A, Wollina U, et al. Up-regulation of delta-opioid receptors and kappa-opioid receptors in the skin of fibromyalgia patients. Arthritis Rheum. 2007;56(7):2464–2466. doi: 10.1002/art.22735. [DOI] [PubMed] [Google Scholar]
- 149.Schuning J, Scherens A, Haussleiter IS, et al. Sensory changes and loss of intraepidermal nerve fibers in painful unilateral nerve injury. Clin J Pain. 2009;25(8):683–690. doi: 10.1097/AJP.0b013e3181a1260e. [DOI] [PubMed] [Google Scholar]
- 150.Giannoccaro MP, Donadio V, Incensi A, Avoni P, Liguori R. Small nerve fiber involvement in patients referred for fibromyalgia. Muscle Nerve. 2014;49(5):757–759. doi: 10.1002/mus.24156. [DOI] [PubMed] [Google Scholar]
- 151.Uceyler N, Zeller D, Kahn AK, et al. Small fibre pathology in patients with fibromyalgia syndrome. Brain. 2013;136(Pt 6):1857–1867. doi: 10.1093/brain/awt053. [DOI] [PubMed] [Google Scholar]
- 152.Kosmidis ML, Koutsogeorgopoulou L, Alexopoulos H, et al. Reduction of intraepidermal nerve fiber density (IENFD) in the skin biopsies of patients with fibromyalgia: a controlled study. J Neurol Sci. 2014;347(1–2):143–147. doi: 10.1016/j.jns.2014.09.035. [DOI] [PubMed] [Google Scholar]
- 153.Ramirez M, Martinez-Martinez LA, Hernandez-Quintela E, Velazco-Casapia J, Vargas A, Martinez-Lavin M. Small fiber neuropathy in women with fibromyalgia. An in vivo assessment using corneal confocal bio-microscopy. Semin Arthritis Rheum. 2015;45(2):214–219. doi: 10.1016/j.semarthrit.2015.03.003. [DOI] [PubMed] [Google Scholar]
- 154.Clauw DJ. What is the meaning of “small fiber neuropathy” in fibromyalgia? Pain. 2015;156(11):2115–2116. doi: 10.1097/j.pain.0000000000000311. [DOI] [PubMed] [Google Scholar]
- 155.Methodologies to diagnose and monitor dry eye disease: report of the Diagnostic Methodology Subcommittee of the International Dry Eye WorkShop (2007) Ocul Surf. 2007;5(2):108–152. doi: 10.1016/s1542-0124(12)70083-6. [DOI] [PubMed] [Google Scholar]
- 156.Lemp MA, Hamill JR., Jr Factors affecting tear film breakup in normal eyes. Arch Ophthalmol. 1973;89(2):103–105. doi: 10.1001/archopht.1973.01000040105007. [DOI] [PubMed] [Google Scholar]
- 157.Abelson MB, Ousler GW, 3rd, Nally LA, Welch D, Krenzer K. Alternative reference values for tear film break up time in normal and dry eye populations. Adv Exp Med Biol. 2002;506(Pt B):1121–1125. doi: 10.1007/978-1-4615-0717-8_157. [DOI] [PubMed] [Google Scholar]
- 158.Bron AJ, Evans VE, Smith JA. Grading of corneal and conjunctival staining in the context of other dry eye tests. Cornea. 2003;22(7):640–650. doi: 10.1097/00003226-200310000-00008. [DOI] [PubMed] [Google Scholar]
- 159.Yoon KC, Im SK, Kim HG, You IC. Usefulness of double vital staining with 1% fluorescein and 1% lissamine green in patients with dry eye syndrome. Cornea. 2011;30(9):972–976. doi: 10.1097/ICO.0b013e31820687dd. [DOI] [PubMed] [Google Scholar]
- 160.Petzke F, Gracely RH, Park KM, Ambrose K, Clauw DJ. What do tender points measure? Influence of distress on 4 measures of tenderness. J Rheumatol. 2003;30(3):567–574. [PubMed] [Google Scholar]
- 161.Petzke F, Harris RE, Williams DA, Clauw DJ, Gracely RH. Differences in unpleasantness induced by experimental pressure pain between patients with fibromyalgia and healthy controls. Eur J Pain. 2005;9(3):325–335. doi: 10.1016/j.ejpain.2004.09.001. [DOI] [PubMed] [Google Scholar]
- 162.Gracely RH, Dubner R, McGrath PA. Narcotic analgesia: fentanyl reduces the intensity but not the unpleasantness of painful tooth pulp sensations. Science. 1979;203(4386):1261–1263. doi: 10.1126/science.424753. 23. [DOI] [PubMed] [Google Scholar]
- 163.Gracely RH, Lota L, Walter DJ, Dubner R. A multiple random staircase method of psychophysical pain assessment. Pain. 1988;32(1):55–63. doi: 10.1016/0304-3959(88)90023-1. [DOI] [PubMed] [Google Scholar]
- 164.Keidser G, Seymour J, Dillon H, Grant F, Byrne D. An efficient, adaptive method of measuring loudness growth functions. Scand Aaudiol. 1999;28(1):3–14. doi: 10.1080/010503999424860. [DOI] [PubMed] [Google Scholar]
- 165.Geisser ME, Glass JM, Rajcevska LD, et al. A psychophysical study of auditory and pressure sensitivity in patients with fibromyalgia and healthy controls. J Pain. 2008;9(5):417–422. doi: 10.1016/j.jpain.2007.12.006. [DOI] [PubMed] [Google Scholar]
- 166.Geisser ME, Strader Donnell C, Petzke F, Gracely RH, Clauw DJ, Williams DA. Comorbid somatic symptoms and functional status in patients with fibromyalgia and chronic fatigue syndrome: sensory amplification as a common mechanism. Psychosomatics. 2008;49(3):235–242. doi: 10.1176/appi.psy.49.3.235. [DOI] [PubMed] [Google Scholar]
- 167.Schiffman RM, Christianson MD, Jacobsen G, Hirsch JD, Reis BL. Reliability and validity of the Ocular Surface Disease Index. Arch Ophthalmol. 2000;118(5):615–621. doi: 10.1001/archopht.118.5.615. [DOI] [PubMed] [Google Scholar]
- 168.Miller KL, Walt JG, Mink DR, et al. Minimal clinically important difference for the ocular surface disease index. Arch Ophthalmol. 2010;128(1):94–101. doi: 10.1001/archophthalmol.2009.356. [DOI] [PubMed] [Google Scholar]
- 169.Vitale S, Goodman LA, Reed GF, Smith JA. Comparison of the NEI-VFQ and OSDI questionnaires in patients with Sjogren’s syndrome-related dry eye. Health Qual Life Outcomes. 2004;2:44. doi: 10.1186/1477-7525-2-44. [DOI] [PMC free article] [PubMed] [Google Scholar]
- 170.Melzack R. The McGill Pain Questionnaire: major properties and scoring methods. Pain. 1975;1(3):277–299. doi: 10.1016/0304-3959(75)90044-5. [DOI] [PubMed] [Google Scholar]
- 171.Smets EM, Garssen B, Bonke B, De Haes JC. The Multidimensional Fatigue Inventory (MFI) psychometric qualities of an instrument to assess fatigue. J Psychosom Res. 1995;39(3):315–325. doi: 10.1016/0022-3999(94)00125-o. [DOI] [PubMed] [Google Scholar]
- 172.Keogh E, Reidy J. Exploring the factor structure of the Mood and Anxiety Symptom Questionnaire (MASQ) J Pers Assess. 2000;74(1):106–125. doi: 10.1207/S15327752JPA740108. [DOI] [PubMed] [Google Scholar]
- 173.Weissman MM, Sholomskas D, Pottenger M, Prusoff BA, Locke BZ. Assessing depressive symptoms in five psychiatric populations: a validation study. Am J Epidemiol. 1977;106(3):203–214. doi: 10.1093/oxfordjournals.aje.a112455. [DOI] [PubMed] [Google Scholar]
- 174.Cohen S, Kamarck T, Mermelstein R. A global measure of perceived stress. J Health Soc Behav. 1983;24(4):385–396. [PubMed] [Google Scholar]
- 175.Rosenstiel AK, Keefe FJ. The use of coping strategies in chronic low back pain patients: relationship to patient characteristics and current adjustment. Pain. 1983;17(1):33–44. doi: 10.1016/0304-3959(83)90125-2. [DOI] [PubMed] [Google Scholar]
- 176.Ashburner J, Friston KJ. Unified segmentation. NeuroImage. 2005;26(3):839–851. doi: 10.1016/j.neuroimage.2005.02.018. [DOI] [PubMed] [Google Scholar]
- 177.Ashburner J, Friston KJ. Computing average shaped tissue probability templates. NeuroImage. 2009;45(2):333–341. doi: 10.1016/j.neuroimage.2008.12.008. [DOI] [PubMed] [Google Scholar]
- 178.Henrich CF, Ramulu PY, Akpek EK. Association of dry eye and inflammatory systemic diseases in a tertiary care-based sample. Cornea. 2014;33(8):819–825. doi: 10.1097/ICO.0000000000000173. [DOI] [PubMed] [Google Scholar]
- 179.Galor A, Covington D, Levitt AE, et al. Neuropathic ocular pain due to dry eye is associated with multiple comorbid chronic pain syndromes. J Pain. 2016;17(3):310–318. doi: 10.1016/j.jpain.2015.10.019. [DOI] [PMC free article] [PubMed] [Google Scholar]
- 180.Li M, Gong L, Sun X, Chapin WJ. Anxiety and depression in patients with dry eye syndrome. Curr Eye Res. 2011;36(1):1–7. doi: 10.3109/02713683.2010.519850. [DOI] [PubMed] [Google Scholar]
- 181.Hallak JA, Tibrewal S, Jain S. Depressive symptoms in patients with dry eye disease: a case-control study using the Beck Depression Inventory. Cornea. 2015;34(12):1545–1550. doi: 10.1097/ICO.0000000000000641. [DOI] [PMC free article] [PubMed] [Google Scholar]
- 182.Na KS, Han K, Park YG, Na C, Joo CK. Depression, stress, quality of life, and dry eye disease in Korean women: a population-based study. Cornea. 2015;34(7):733–738. doi: 10.1097/ICO.0000000000000464. [DOI] [PubMed] [Google Scholar]
- 183.Galor A, Felix ER, Feuer W, et al. Dry eye symptoms align more closely to non-ocular conditions than to tear film parameters. Br J Ophthalmol. 2015;99(8):1126–1129. doi: 10.1136/bjophthalmol-2014-306481. [DOI] [PubMed] [Google Scholar]
- 184.van der Vaart R, Weaver MA, Lefebvre C, Davis RM. The association between dry eye disease and depression and anxiety in a large population-based study. Am J Ophthalmol. 2015;159(3):470–474. doi: 10.1016/j.ajo.2014.11.028. [DOI] [PMC free article] [PubMed] [Google Scholar]
- 185.Asghar O, Petropoulos IN, Alam U, et al. Corneal confocal microscopy detects neuropathy in subjects with impaired glucose tolerance. Diabetes Care. 2014;37(9):2643–2646. doi: 10.2337/dc14-0279. [DOI] [PMC free article] [PubMed] [Google Scholar]
- 186.Ziegler D, Papanas N, Zhivov A, et al. Early detection of nerve fiber loss by corneal confocal microscopy and skin biopsy in recently diagnosed type 2 diabetes. Diabetes. 2014;63(7):2454–2463. doi: 10.2337/db13-1819. [DOI] [PubMed] [Google Scholar]
- 187.Kass-Iliyya L, Javed S, Gosal D, et al. Small fiber neuropathy in Parkinson’s disease: a clinical, pathological and corneal confocal microscopy study. Parkinsonism Relat Disord. 2015;21(12):1454–1460. doi: 10.1016/j.parkreldis.2015.10.019. [DOI] [PMC free article] [PubMed] [Google Scholar]
- 188.Lee YC, Nassikas NJ, Clauw DJ. The role of the central nervous system in the generation and maintenance of chronic pain in rheumatoid arthritis, osteoarthritis and fibromyalgia. Arthritis Res Ther. 2011;13(2):211. doi: 10.1186/ar3306. [DOI] [PMC free article] [PubMed] [Google Scholar]
- 189.Murphy SL, Lyden AK, Phillips K, Clauw DJ, Williams DA. Subgroups of older adults with osteoarthritis based upon differing comorbid symptom presentations and potential underlying pain mechanisms. Arthritis Res Ther. 2011;13(4):R135. doi: 10.1186/ar3449. [DOI] [PMC free article] [PubMed] [Google Scholar]
- 190.Murphy SL, Lyden AK, Clary M, et al. Activity pacing for osteoarthritis symptom management: study design and methodology of a randomized trial testing a tailored clinical approach using accelerometers for veterans and non-veterans. BMC Musculoskel Disord. 2011;12:177. doi: 10.1186/1471-2474-12-177. [DOI] [PMC free article] [PubMed] [Google Scholar]
- 191.Williams DA, Farrell MJ, Cunningham J, et al. Knee pain and radiographic osteoarthritis interact in the prediction of levels of self-reported disability. Arthritis Rheum. 2004;51(4):558–561. doi: 10.1002/art.20537. [DOI] [PubMed] [Google Scholar]
- 192.Goldenberg DL, Clauw DJ, Fitzcharles MA. New concepts in pain research and pain management of the rheumatic diseases. Semin Arthritis Rheum. 2011;41(3):319–334. doi: 10.1016/j.semarthrit.2011.04.005. [DOI] [PubMed] [Google Scholar]
- 193.Lorduy KM, Liegey-Dougall A, Haggard R, Sanders CN, Gatchel RJ. The prevalence of comorbid symptoms of central sensitization syndrome among three different groups of temporomandibular disorder patients. Pain Pract. 2013;13(8):604–613. doi: 10.1111/papr.12029. [DOI] [PMC free article] [PubMed] [Google Scholar]
- 194.Furquim BD, Flamengui LM, Conti PC. TMD and chronic pain: a current view. Dental Press J Orthod. 2015;20(1):127–133. doi: 10.1590/2176-9451.20.1.127-133.sar. [DOI] [PMC free article] [PubMed] [Google Scholar]
- 195.Lee YC, Chibnik LB, Lu B, et al. The relationship between disease activity, sleep, psychiatric distress and pain sensitivity in rheumatoid arthritis: a cross-sectional study. Arthritis Res Ther. 2009;11(5):R160. doi: 10.1186/ar2842. [DOI] [PMC free article] [PubMed] [Google Scholar]
- 196.Henry NL, Clauw DJ. Thinking beyond the tumor to better understand chronic symptoms in breast cancer survivors. Breast Cancer Res Treat. 2012;133(2):413–416. doi: 10.1007/s10549-011-1804-8. [DOI] [PubMed] [Google Scholar]
- 197.Henry NL, Giles JT, Ang D, et al. Prospective characterization of musculoskeletal symptoms in early stage breast cancer patients treated with aromatase inhibitors. Breast Cancer Res Treat. 2008;111(2):365–372. doi: 10.1007/s10549-007-9774-6. [DOI] [PMC free article] [PubMed] [Google Scholar]