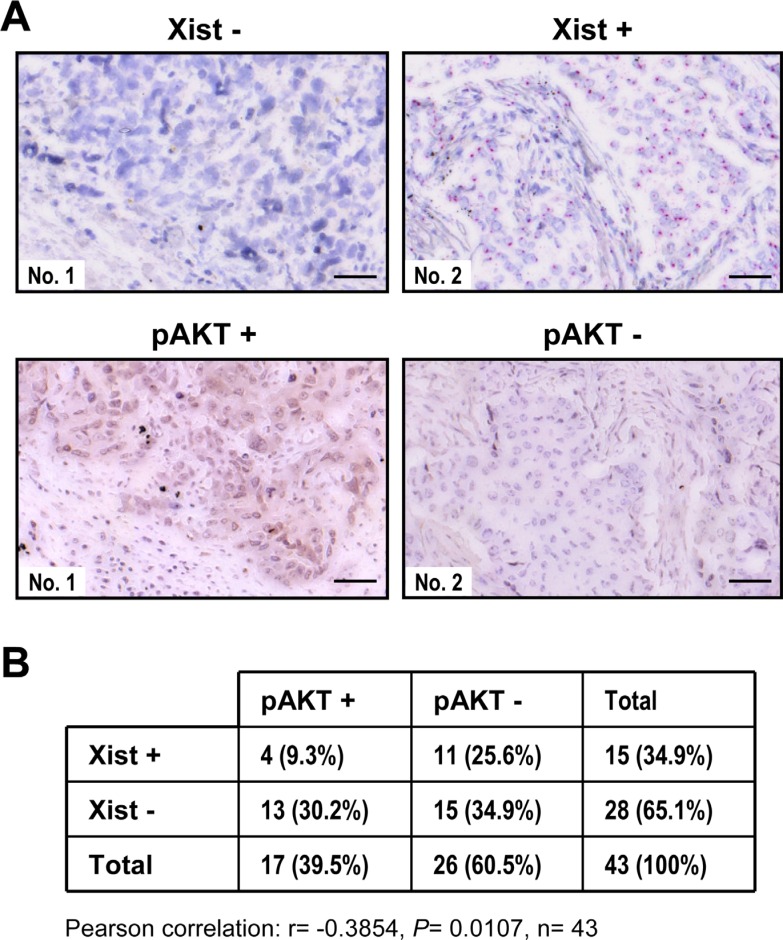
Figure 3. Inverse correlation between Xist and phospho-AKT in clinical breast samples.
(A) Immunohistochemistry to detect phospho-AKT (pAKT) (brown) and RNA in situ hybridization to visualize Xist (red) in serial sections of each breast cancer sample. Scale bar = 50 um. (B) Regression analysis of the correlation of Xist and pAKT levels.

