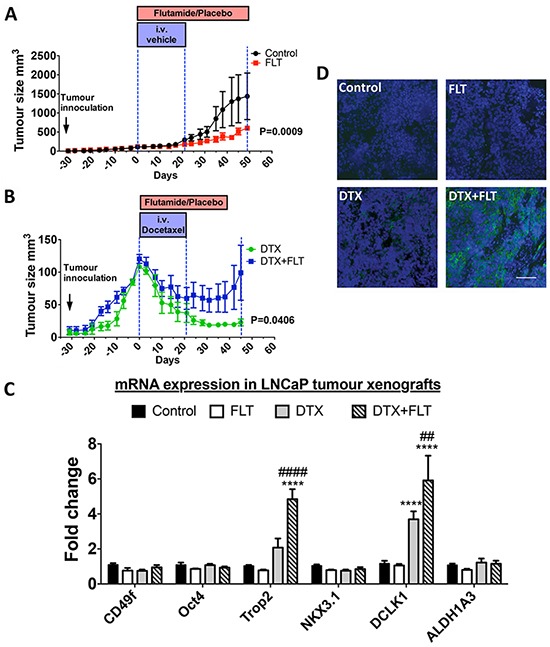
Figure 2.
A–B. Tumor growth in NOD/SCID mice treated with vehicle (control), 33mg/kg/day flutamide (FLT), 10mg/kg/week docetaxel (DTX) or a combination of docetaxel and flutamide (DTX + FLT), as indicated. Data was analyzed by two-way repeated measures ANOVA and a P value < 0.05 for the interaction between treatments and time was considered to be statistically significant (n = 5 mice/group). C. mRNA expression levels in prostate tumors derived from LNCaP cell xenografts treated as above. *, P<0.05 and ****, P<0.0001, significantly different from control and flutamide treatment groups. ##, P<0.01 and ####, P<0.0001, significantly different from docetaxel treatment group. D. Immunohistochemical staining of TROP2 on tumors derived from xenografts treated as indicated in (A) and (B). Scale bar=100μm.

