Abstract
Robust methods to detect DNA-binding proteins from structures of unknown function are important for structural biology. This paper describes a method for identifying such proteins that (i) have a solvent accessible structural motif necessary for DNA-binding and (ii) a positive electrostatic potential in the region of the binding region. We focus on three structural motifs: helix–turn-helix (HTH), helix–hairpin–helix (HhH) and helix–loop–helix (HLH). We find that the combination of these variables detect 78% of proteins with an HTH motif, which is a substantial improvement over previous work based purely on structural templates and is comparable to more complex methods of identifying DNA-binding proteins. Similar true positive fractions are achieved for the HhH and HLH motifs. We see evidence of wide evolutionary diversity for DNA-binding proteins with an HTH motif, and much smaller diversity for those with an HhH or HLH motif.
INTRODUCTION
One of the challenges of structural genomics is to elucidate the function of proteins of known sequence and unknown function. In this paper, we shall focus on the methods for identifying the fraction of proteins that bind to DNA. This is a non-trivial task as it has been estimated that 6–7% of all eukaryotic proteins bind DNA (1). Although there are a number of possible parameters that can be used to identify a DNA-binding protein, in this paper, we combine searches for a set of structural motifs and a positive electrostatic potential on the surface of a putative DNA-binding protein. This approach is only relevant if a three-dimensional (3D) structure is available.
It has been observed that many known DNA-binding proteins have one of a small number of distinct structural motifs that play a key role in binding DNA (2). We focus on three motifs: the helix–turn–helix (HTH) motif, the helix–hairpin–helix (HhH) motif and the helix–loop–helix (HLH) motif. The HTH motif has previously been considered in a preliminary analysis by Jones et al. (3) with some success, and these methods are extended here.
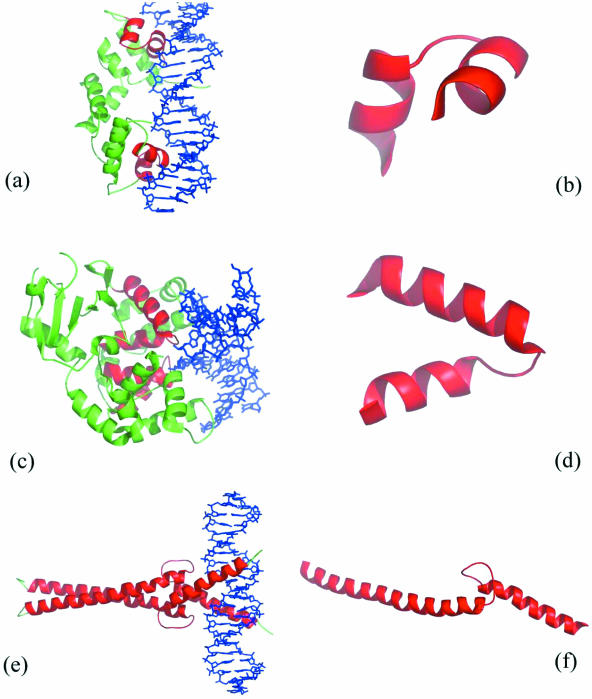
As suggested by their names, all three motifs start and terminate with helices (denoted as H1 and H2), connected by a short linking region of varying geometry (which does not form a helix or part of a sheet). Examples of each motif used to derive structural templates are shown in Figure 1.
Figure 1.
PyMol (4) images of the motifs that are employed in this paper. In (a, c and e), the complexed protein representing the HTH, HhH and HLH motifs respectively is depicted with the secondary structure as cartoons, and the double-stranded DNA is shown in stick representation. The relevant motif is highlighted in red. In (b, d and f), the relevant motif is isolated. In (a), the dimeric λ repressor/operator complex (PDB code 1lmb) (5) with the HTH motif in each protein subunit highlighted in red is shown. In (b), the HTH motif extracted from chain 3 of λ repressor/operator complex that spans residues 33–51 is shown. In (c), the borohydride-trapped hogg1 intermediate structure (PDB code 1lwv) (6) with HhH motifs is shown while one of the motifs, spanning residues 232–257 of chain A is shown in (d). Finally, the transcription factor Max (PDB code 1an2) (7) with an HLH motif and the HLH motif spanning residues 26–102 of chain A is shown in (e and f).
DNA-binding proteins with an HhH structural motif are involved in non-sequence-specific DNA binding that occurs via the formation of hydrogen bonds between protein backbone nitrogens and DNA phosphate groups. These HhH motifs are observed in DNA repair enzymes and in DNA polymerases. Structurally, the motif forms a pair of anti-parallel α-helices connected by a hairpin-like loop. This loop is involved in interactions with the DNA (8–10) and usually contains a consensus GXG sequence pattern, where X is a hydrophobic residue. The two α-helices are packed at an acute angle of ∼25–50° that dictates the characteristic pattern of hydrophobicity in the sequences (11).
DNA-binding proteins with the HLH structural motif are transcriptional regulatory proteins and are principally related to a wide array of developmental processes. In 1997, Atchley and Fitch (12) identified 242 HLH DNA-binding proteins in organisms ranging from Saccharomyces cerevisiae to Homo sapiens. These proteins have in common a highly conserved region that allows them to bind to DNA and to interact with each other (13). The motif is longer, in terms of residues, than the other two motifs. Many of these proteins interact to form homo- and hetero-dimers. The structural motif is composed of two long helix regions, with the N-terminal helix binding to the DNA, while the loop region allows the protein to dimerize.
Given the negative electrostatic potential that envelopes the DNA, it has been noted that a DNA-binding protein will have a complementary positive electrostatic potential in its binding region. This was used initially to identify the DNA-binding nature of the Tubby protein (14). The calculation of an electrostatic potential and its use in the prediction of DNA-binding sites has previously been presented (15). Each accessible atom is assigned a score, which is proportional to the surface integral of the potential over a region projected from the accessible surface, which is 7 Å from each atom.
Given that the geometry and electrostatic potential are essentially independent variables, it is plausible that a combination of the two should provide an improved method for identifying DNA-binding proteins, which is the focus for the current work. Initially, a set of structural templates is constructed for each of the two new motifs, based on the methods of Jones et al. (3). These structural templates are employed as the ‘first pass’ to scan all structures in the Protein Data Bank (PDB) (16) to identify the DNA-binding proteins, by calculating an optimal superposition of a template on a complete structure. This gave an initial set of hits, including correct matches and false positive and also false negative proteins. An accessible surface area (ASA) threshold and an electrostatic motif score (EMS) threshold is then employed on this initial set of true and false positives to improve the accuracy of the predictions. The success of these structural templates is then compared to the sequence homology methods. It has been shown that the HTH templates were generic (identifying DNA-binding motifs across different homologous families). The generic nature of the HhH motif is investigated. Finally, the current template method is compared with another more complex approach for detecting DNA-binding proteins.
METHODS
Definitions: hierarchies of families
In this paper, the term ‘family’ is employed to describe the clusters of protein chains that exhibit evidence, from a particular observable, of a common evolutionary ancestor. The term ‘set’ is used more generally for clusters of protein chains that exhibit a similarity under some measure, which may, or may not, be evidence for a common evolutionary ancestor. In particular, in this paper, we assume that the similarity to a particular structural template does not necessarily imply a common evolutionary ancestor. On the other hand, all other criteria (sequence, global structure comparison) used in this paper to cluster proteins is assumed to imply a common evolutionary ancestor. Typically, families defined using one method may be subfamilies of a larger family defined using another method. In addition, sets defined using similarity to a particular structural template will have the largest number of elements and all the other families will lie within them.
Furthermore, individual protein chains are often used to represent families or sets of structures. In order to avoid confusion, each family and set definition is described and if necessary, a label to a representative structure derived from a family using this definition is assigned. We can then employ them consistently through the rest of the paper.
Sequence definitions
In the first instance, an ‘S sequence family’ is defined as a set of proteins that have a domain with a sequence identity that is >35%. In the CATH hierarchy of protein structures (17), this corresponds to the ‘S-level’ (the fifth integer in the CATH number). The families constructed using this definition will have the smallest number of members. A representative sequence of such a family is referred to as an SREP, while a representative of a structure from this family would be a T_SREP.
A ‘D-HMM sequence family’ is defined as a set of protein sequences whose E-values from a specific hidden Markov sequence model (HMM) (18), defined from Pfam (19) or SMART (20), are <10−2. The ‘D’ indicates a defined HMM from Pfam or SMART, which are somewhat conservative in their range in comparison to other possible HMMs. S sequence families form subfamilies of D-HMM sequence families, as shown schematically in Figure 2a.
Figure 2.
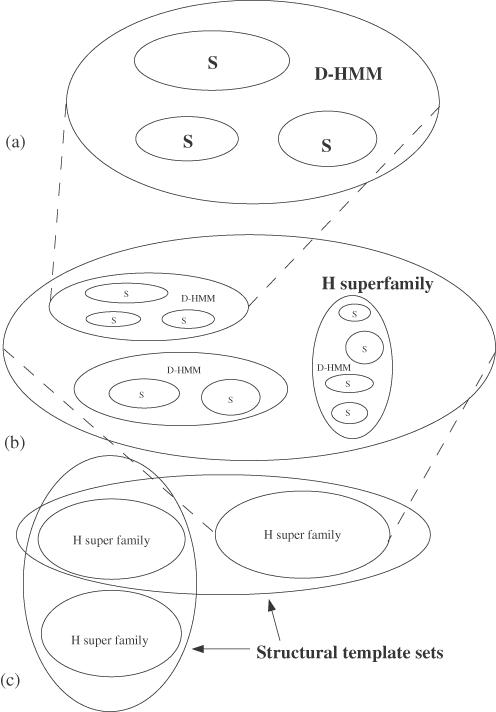
A schematic diagram to show the hierarchy of families that occur in this paper. In (a), we show the hierarchy for the sequence families. S sequence families (where each sequence has a 35% sequence identity with any other sequences) form subfamilies of D-HMM families (where each sequence can be identified by a previously defined HMM in Pfam or SMART). Likewise in (b) D-HMM sequence families themselves form subfamilies of H superfamilies (although it is possible that this may not always be the case, particularly in the case of the HhH motif). Finally, in (c) the H superfamilies are themselves subsets of the structural template sets. It is possible that these sets will intersect with each other.
Structure definitions
An ‘H superfamily’ is defined from structural data as a set of protein chains with a structural domain which are in the same non-homologous structural family, defined from the CATH database. This corresponds to the ‘H-level’ in the CATH hierarchy (the fourth integer in the CATH number). Typically, as shown in Figure 2b, D-HMM sequence families are subsets of H superfamilies, though this is not necessarily true (in particular, in the case of the HhH motif). Nonetheless, all S families form subsets of H superfamilies. A representative from this family used to form a structural template is referred to as T_HREP.
Finally, a ‘structural template set’ is a set of protein chains that have a sequentially continuous structural fragment that is similar to a particular structural template. As shown in Figure 2c, such sets can intersect with each other. Furthermore, all the previously mentioned families are subsets of these structural template sets.
Derivation of structural templates
The structural templates were derived as described previously (3). From a set of structures derived from the literature, HMMs from Pfam (19) and SMART (20) were obtained. These were then used to identify the equivalent D-HMM sequence families. If additional proteins, which have structures in the PDB, were identified and validated as true DNA-binding proteins with these motifs from the literature, they were added to the relevant motif set and the process repeated until no new structures were added.
Using the CATH database (17), the set of proteins for each motif were clustered into H superfamilies. As discussed previously, representative structures from each H superfamily were selected and denoted as T_HREPs. For each T_HREP, a 3D motif template was derived. The templates are a set of Cα positions for protein structure fragments (taken from the co-ordinates of a PDB file). The templates are sequentially continuous in terms of residue number and comprise all the residues from the start of H1 to the end of H2. The start and end points of each motif are identified from the literature and by visualizing the proteins using Rasmol (21). These templates were scanned against whole protein structures using the algorithm scan-rmsd, based on the Kabsch method (3).
By creating a histogram of the root-mean-square distance (rmsd) of the optimal superposition of template on complete protein over the set of DNA-binding proteins with the relevant motif (TRUE) and all other entries in the PDB (FALSE), we obtain a cut-off for the rmsd to discriminate between the sets. The cut-off for the rmsd can be determined by using the value where Matthew's Φ coefficient takes its maximum value (22).
A summary of the number of S sequence families, D-HMM sequence families, H superfamilies and structural template sets are listed in Table 1.
Table 1. A summary of sequence and structural similarity for DNA-binding proteins with one of the above structural motifs.
| Motif | HTH | HhH | HLH |
|---|---|---|---|
| Number of S sequence families | 29 | 10 | 4 |
| Number of HMMs | 28 | 4 | 1 |
| Number of HMM cross hits | 31/406 | 36/45 | — |
| Number of H superfamilies | 7 | 6 | 1 |
| Final number of structural templates | 7 | 1 | 1 |
| Number of rmsd cross hits | 217/406 | 34/45 | — |
A HMM cross hit between two S-families implies that that there exists an HMM where the E-value of the SREP's of each S sequence family is <0.01. An rmsd cross hit between two S-families indicates a successful hit of the structural template of one T_SREP against the T_SREP of the other S-family. The cut-off for the rmsd varies slightly from motif to motif. As all the proteins with the HLH motif lie in the same D-HMM family, this test is not carried out.
HTH motif
Starting with a set of 120 HTH proteins from the literature, this procedure resulted in 86 non-identical HTH proteins clustered into seven H-super structural families.
HhH motif
The starting point for this motif was a list of 146 proteins from the PDB known to contain at least one HhH motif, which had been identified from the literature (9,23–28). The above procedure resulted in 23 non-identical HhH proteins that were initially clustered into six H-super structural families.
HLH motif
The starting point for this motif was a list of 9 proteins from the PDB known to contain at least one HLH motif, which had been identified from the literature (29–31). The above methods resulted in 15 non-identical HLH protein chains that clustered into a single H-super structural family.
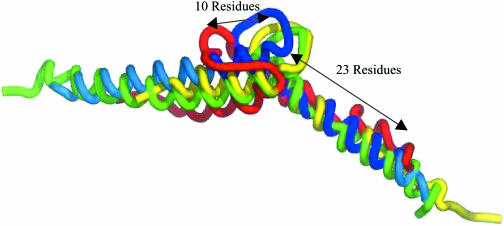
The length of the HLH motif is variable (lengths vary from 43 to 85 residues), as can be seen in Figure 3. As these proteins cluster into a single H-super structural family, the resulting T_HREP template must be as short as the shortest motif. As the structure with the best resolution (PDB code 1hlo, chain B) (32) is not the shortest motif (PDB code 1an4, chain A) (36), then a choice must be made in truncating this motif. The length of the helix regions, starting from the loops, was the same as the length of the helices for the shortest motif. As can be seen in Figure 3, in the case of the N-terminal edge of the loop, 23 residues of the helix H1 were included and from the C-terminal edge of the loop, 10 residues of the helix H2 were included. This template shall be referred to as the reduced template.
Figure 3.
A PyMol image of the overlap of the set of four T_SREPs (structural representatives from each HLH S sequence family). Each structure is in a cartoon representation. The blue structure is the PDB structure 1hlo, chain B (32). The green is PDB code 1am9 chain D (33). The red is 1a0a (34), chain B and the yellow is 1mdy (35), chain A. The region of 1hlo in dark blue, with different lengths of helix regions labelled, represents the region picked for the reduced T_HREP template.
Calculation of motif accessibility
To help in the discrimination of motifs that bind DNA and those that do not, the ASAs of the matched motifs were calculated using the program NACCESS (37). From the analysis of HTH motifs, it was known that DNA-binding motifs had to have a minimal accessibility in order for them to interact with the DNA (3).
Calculation of EMS
The automatic identification of DNA-binding proteins using a positive electrostatic potential on the surface of the binding region has been employed previously (38,15). However, none of the methods combined a measure of electrostatic potential with a structural template. The electrostatic potential is computed for those proteins satisfying the criteria of a sufficiently small rmsd from one of the structural templates and a sufficiently large accessibility. As outlined in Jones et al. (15) the electrostatic score ΔQi, is defined from the potential for each surface accessible atom (labelled i) of the protein. The EMS is defined as
![]()
where M is the set of surface accessible atoms that have been identified as being part of the motif and NM are the number of atoms in M.
Matthew's Φ coefficient was used to find the best EMS threshold for each relevant motif.
RESULTS
HTH motif
Data set of HTH structures derived from the PDB
A structural template library of HTH motifs from seven T_HREPs has previously been defined in (3) (forming seven structural template families). These seven structural templates (each extended by two residues at the start and the end of the motif) were used to scan a non-redundant data set of proteins in the PDB and a set of 86 non-redundant HTH structures known to bind DNA. From the resulting rmsd distribution, a threshold value of 1.6 Å was selected that resulted in 61 false positives. An ASA threshold was selected at 990 Å2, which reduced the false positive set of proteins to 38. Using these cut-offs, there were 10 false negatives. In this work, an analysis of the false positive structures resulted in the identification of three ‘new’ DNA-binding HTH motifs in DNA polymerase I structures (PDB code 1taq0) (39), methyltransferase (PDB code 1mgtA) (40) and histone acetyltransferase (PDB code 1fy7A) (41). Since this analysis, a further two false positive structures were identified as known HTH motifs, namely histone-like protein HU (PDB code 1b8z) (42) and sporulation response regulator Spo0A (PDB code 1fc3) (43). This gives a total of 91 non-identical proteins with a DNA-binding HTH motif. The application of an rmsd threshold of 1.6 Å and an ASA threshold of 990 Å2 identified then 81 non-identical proteins with a DNA-binding HTH motif (TRUE_HTH) and left a false positive set of 33 protein structures (FALSE_HTH).
The EMS threshold
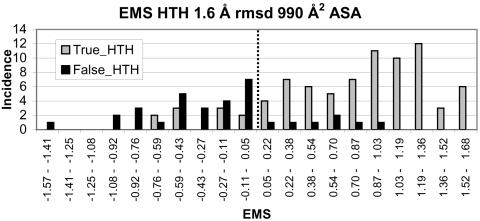
The EMS was calculated for proteins in the TRUE_HTH and FALSE_HTH data sets and a histogram of these values are shown in Figure 4. From this figure, it can be seen that the true and false sets can be resolved reasonably well. If the threshold is taken to be 0.05, the number of false negatives increases to 20 and the number of false positives decreases to 7. The true positive fraction is 78%.
Figure 4.
A histogram of the EMS for the putative HTH binding proteins, all identified by searching non-identical entries in the PDB for a HTH motif using an rmsd cut-off and further filtering to remove all hits <990 Å2 ASA. Hits are identified as either true or false (i.e. those that bind to DNA or not) based on the literature. An EMS cut-off was taken to be 0.05.
The HhH motif
Data set of HhH structures derived from the PDB
A structural library of HhH motifs from six T_HREPs were identified from the PDB. The six structural templates were used to scan 23 non-identical HhH proteins (TRUE_HhH) and a non-redundant data set of the remaining proteins in the PDB (FALSE_HhH). From this initial scan, the results of the templates scanned against the TRUE_HhH set revealed that one template (PDB code 1ci4, chain A, residues 20-36) (27) had an rmsd that is <1.4 Å with all other known HhH proteins (primarily because it is the shortest template, being 17 residues long). As a result, the DNA-binding proteins with an HhH motif form a single structural template family, and this template was used as the single representative template to scan all other proteins for HhH motifs.
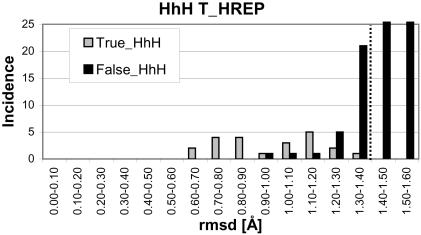
The single template was used to scan the TRUE_HhH (1ci4 was eliminated from the set for consistency) and FALSE_HhH sets. A histogram for the rmsd values calculated using the template for the non-identical chains of these data sets are shown in Figure 5. The optimum threshold would be 1.2 Å, however, this would require the introduction of an additional structural template (i.e. two structural template families would be required to cover the TRUE_HhH set). Given the small size of TRUE_HhH set, it is pointless to arbitrarily increase the number of possible templates. A cut-off of 1.4 Å was used instead. Hence, there are no false negatives but there are 29 false positives.
Figure 5.
Final scan of HhH HREP structural templates against non-identical protein chains (DNA binding with a HhH motif or not). The protein structure containing the template is excluded. In order to have only one structural family, an rmsd cut-off of 1.4 Å was chosen.
The ASA threshold
The ASA was computed for the non-identical HhH chains using an rmsd threshold of 1.4 Å. The range for the remaining true positives was from 404 to 1390 Å2 (with a mean of 875 Å2) and from 541 to 1374 Å2 (with a mean of 926 Å2) for the false positives. The distributions showed that these data sets could not be distinguished in any meaningful way and the use of an ASA threshold for this motif was excluded.
The EMS threshold
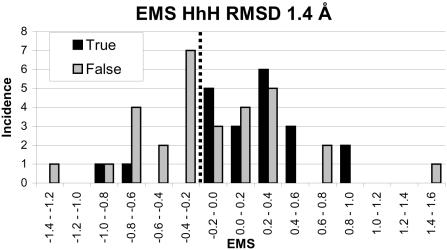
The EMS was calculated for those proteins in the TRUE_HhH and FALSE_HhH data sets that satisfied the rmsd threshold. A histogram of these values is shown in Figure 6. By employing a threshold of −0.2, 15 of the false positives can be eliminated. Two false negatives are also introduced. Hence, the total number of true positives is 19 (86% of the total number of non-identical chains) and there are 14 false positives.
Figure 6.
Histogram of the EMS for the true and false sets with HhH motifs sets after the rmsd cut-off to the HhH T_HREP structural template. A cut-off of −0.2 for the EMS was chosen.
The HLH motif
Data set of DNA-binding HLH proteins
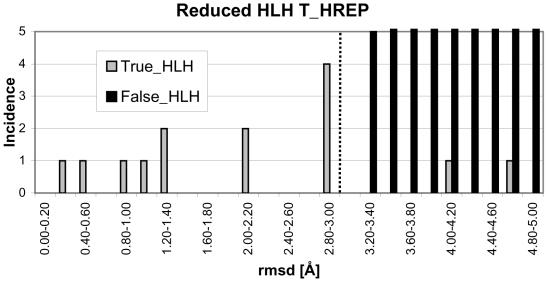
The limited number of HLH proteins in the PDB meant that there was a single T_HREP identified for this motif (PDB code 1hlo, chain B, residues 17–59) (32). A reduced structural template was constructed for this single representative as described previously and was used to scan the remaining 14 HLH non-identical protein chains (TRUE_HLH) and 11 121 non-identical remaining proteins in the PDB (FALSE_HLH), excluding the known DNA-binding HLH proteins. The histogram for the non-identical protein chains of both sets for the scan is shown in Figure 7. For a threshold rmsd of 3.0 Å, there are no false positives but there are 2 false negatives. The very large rmsd for the 2 false negatives is due to a high variability in the loop region, and increasing the cut-off would introduce an unacceptable number of false positives. As a result, 12 of the 14 HLH DNA-binding proteins are identified with a true positive fraction of 86%.
Figure 7.
Histogram of the rmsd for the HLH motif employing the reduced T_HREP structural template. The protein structure with the template is excluded. In order to discriminate the true and false sets, a cut-off of 3.0 Å is used.
The ASA and EMS threshold
Computing the ASA and EMS on such a reduced template do not have a physical meaning as long as motifs have residues which contact the DNA that would not be included in such a calculation. As a result, the ASA and EMS were not computed.
Comparison of structural template methods with HMMs
It is important to compare these structurally based methods with the sequence-based approach using HMMs. We previously found that the HTH structural templates were generic across homologous families when compared to the sequence-based HMMs that in general only identified members of their own sequence families. This comparative analysis between structure and sequence-based methods is conducted here for the HhH motif.
Our analysis, combined with CATH, suggest that all the HhH motifs occur in a single structural family. In Pfam and SMART, there are four HMMs and hence four D-HMM sequence families. In CATH, there are 10 S sequence families (comprising of clusters with <35% sequence identity between any pair of sequences in different clusters). Each of these 10 S sequence families is represented by an SREP sequence.
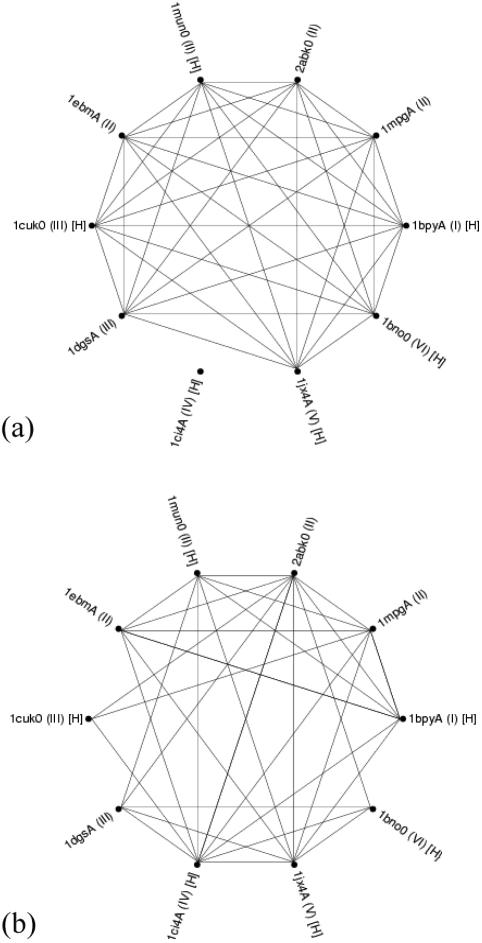
The E-value for each SREP sequence of all the S sequence families with an HhH motif was computed, using SAM-T99, for all the HMMs used to identify the HhH structural templates. A successful HMM hit was taken when an HMM for a particular SREP gave an E-value < 0.01. Pairs of SREP sequences were identified when the same HMM hit (a HMM cross hit) both of them, as shown in Figure 8a. Likewise, the rmsd for all of the T_SREPS was computed using the structural templates derived from each T_SREP. Pairs of T_SREPs were identified (an rmsd cross hit) when there was a successful rmsd hit of one of the structural templates on the other (a cut-off rmsd of 1.4 Å was employed), as shown in Figure 8b. The final numbers of such cross hits are summarized in Table 1.
Figure 8.
A representation of the coverage of 10 S sequence families of proteins that bind to DNA with a HhH motif, using the detection of T_SREP's for each S sequence family by HMMs (a) or structural templates (b). Roman numerals in parentheses indicate those proteins that lie in the same H superfamily. Those PDB codes that are marked with ‘[H]’ indicate proteins that also form T_HREPs. In (a), two protein chains are connected by a line if there exists an HMM where both SREPs have a E-value < 0.01. In (b), two protein chains are connected by a line if there is a successful match of one structure's template against the other (using a cut-off rmsd of 1.4 Å).
As can be seen, almost all the templates can be identified with one HMM, namely the ‘HHH’ HMM from Pfam. However, one protein chain, PDB code 1ci4 chain A, is not identified by any of the other HMMs not in its own S sequence family (the protein chain 1jx4, chain A is also quite marginal, as the E-value is in fact slightly >0.01, but we assume it is a cross hit nonetheless). On the other hand, in Figure 8b, it is observed that all the protein chains can be identified by the structural template approach, including the above structures. Two of the structural templates can identify all the other structural templates.
DISCUSSION
In the current work, it has been demonstrated that how a number of structural features can be employed to determine whether a protein of known structure, and unknown function, is a DNA-binding protein. These structural features are similar to a small number of DNA-binding motifs (HTH, HhH or HLH), the solvent accessibility of the motif and the electrostatic potential in the region of the motif. The relative importance of the similarity, the accessibility and the electrostatic potential vary depending on the motif. It is also important to note that the level of sequence similarity varies enormously between the different types of motif and the optimal type of search (structural or sequence) employed to find such proteins might also vary.
A concern of using structural templates is that it has become clear that many DNA-binding proteins exhibit intrinsically disordered regions, which only became ordered upon binding to DNA (44). One well-known example of this is the leucine zipper protein GCN4 (45). In the case of the three motifs used here, there exist examples of the motifs in complexed and uncomplexed form, and both have been used here, indicating that this is unlikely to occur for these motifs. Furthermore, Stawiski et al. (38) have also demonstrated that a structural approach can distinguish complexed and uncomplexed DNA-binding proteins.
The final results are summarized in Table 2. In the case of the HTH motif, with 133 examples in the PDB (equivalent to 91 non-identical proteins), the cut-offs for the superposition rmsd and ASA of the motif are complemented by the electrostatic potential, reducing the number of false positives from 33 to 7, and identifying 71 non-identical true proteins.
Table 2. Summary of the results obtained for each structural motif.
| Motif | HTH | HhH | HLH |
|---|---|---|---|
| Total number of non-identical proteins | 91 | 23 | 15 |
| rmsd threshold (Å) | 1.6 | 1.4 | 3.0 |
| ASA threshold (Å2) | 990 | — | — |
| EMS | 0.05 | −0.2 | — |
| #False positives | 7 | 14 | 0 |
| #False negatives | 20 | 2 | 2 |
| Sensitivity | 0.78 | 0.91 | 0.86 |
A dash indicates that the relevant observable was not used in identifying the DNA-binding proteins for that motif. The sensitivity is defined as TP/(TP + FN), where TP and FN are the number of true positives and false negatives, respectively. Given the large number of negative structures examined (∼8000), the accuracy (TP + TN/N, where N is the total number of structures examined and TN are the true negatives) and the specificity [TN/(TN + FP), where FP are the number of false positives] is ∼1. The total number of non-identical proteins includes those proteins that contained a structural template.
In the case of HhH motif, with 161 examples in the PDB (23 non-identical proteins), the combination of rmsd and the electrostatic potential resulted in 14 false positives and identified 21 of the non-identical true proteins. The ASA did not resolve the true and false data sets reliably, and were discarded. This is not surprising, given that only a small fraction of the motif makes contact with the DNA. The EMS removes approximately half of the false positives.
The analysis of the HLH motif was of limited value as all the known structures are part of the same D-HMM family. Nonetheless, the use of the rmsd from a single structural template, of reduced length gives a quite good resolution, eliminating all false positives and identifying 13 out of a possible 15 true non-identical DNA-binding proteins with an HLH motif.
The true positive rates we have obtained are slightly smaller than those obtained by Stawiski et al. (38), using a neural network based on 12 different parameters (including electrostatics, but not using structural templates), trained on a somewhat smaller data set. In particular, their true positive rate (sensitivity) for DNA-binding proteins with a HTH motif is ∼0.81, compared to our true positive rate of 0.78. However, our results have been achieved using only 3 types of parameter as opposed to 12. Indeed, as we have scanned as many possible non-DNA-binding proteins as possible, the accuracy and specificity of our method for any of the motifs is ∼1, compared to the total accuracy and specificity of 0.92 and 0.94 respectively using the neural network approach.
It is a concern that when a large number of parameters are used in a machine learning context on a comparatively small data set, the resulting discriminator will be over-constrained, even if cross-validation has been employed. We have demonstrated that in the case of the HTH motif, three carefully chosen parameters can give similar results as 12 parameters, and as a result the former approach is likely to be more robust than the latter. It also presents us with a clear physical picture of the nature of DNA–protein binding, namely an appropriate spatial configuration for the protein and a positive electrostatic potential in the binding region. This is much harder to elucidate from a neural network approach based on such a large number of parameters.
The structural approach also gives us an insight into the evolutionary diversity of these motifs. In the case of the HTH motif, there are a large number of sequence families defined using HMMs or a 35% sequence identity criterion. This may indicate examples of converging evolution. As a result, structural approaches (in conjunction with the electrostatic potential), such as the one outlined here, are the optimal method for detecting new DNA-binding proteins with such a motif.
On the other hand, despite the fact that there are more examples of DNA-binding proteins with an HhH motif in the PDB than those with a HTH motif, there are a considerably smaller number of sequence families. This set of proteins can be identified using a single structural template from an initial set of six H superfamilies. Furthermore, the ‘HHH’ HMM of Pfam can identify proteins from five of the H superfamilies. This is not due to any misclassification of the domains as this also occurs for version 2.5.1 of CATH and we see a similar diversity at the fold and superfamily level of the SCOP database (46). This implies a much smaller amount of evolutionary diversity. Finally, DNA-binding proteins with a HLH motif exhibit very little evolutionary diversity, as one HMM can identify all such proteins.
By approaching the detection of DNA-binding proteins in terms of different structural motifs, we can tease out the relative importance of the observables employed here, which may not be detected from studying all possible DNA-binding protein structures using one model. The above results suggest that future studies should integrate structural and sequence methods to identify future DNA-binding proteins. In the case of proteins with a HTH motif, the methods we have described above will be most useful. On the other hand, those with an HLH, and probably an HhH, motif will be best identified using HMMs.
Acknowledgments
ACKNOWLEDGEMENTS
M.G. was supported by Fundacion Universitaria San Pablo CEU (Spain) fellowship. S.J. was initially supported by a US department of energy grant (DE-FG02-96ER62166) and H.S. was supported by a UK MRC/PPARC training fellowship.
REFERENCES
- 1.Luscombe N.M., Austin,S.E., Berman,H.M. and Thornton,J.M. (2001) An overview of the structures of protein–DNA complexes. Genet. Biol., 1, 1. [DOI] [PMC free article] [PubMed] [Google Scholar]
- 2.Harrison S.C. (1991) A structural taxonomy of DNA-binding domains. Nature, 353, 715–719. [DOI] [PubMed] [Google Scholar]
- 3.Jones S., Barker,J.A., Nobeli,I. and Thornton,J.M. (2003) Using structural motif templates to identify proteins with DNA binding function. Nucleic Acids Res., 35, 2811–2823. [DOI] [PMC free article] [PubMed] [Google Scholar]
- 4.DeLano W.L. (2002) The PyMOL Molecular Graphics System. DeLano Scientific, San Carlos, CA. [Google Scholar]
- 5.Beamer L.J. and Pabo,C.O. (1992) Refined 1.8 Å crystal-structure of the lambda-repressor operator complex. J. Mol. Biol., 227, 177. [DOI] [PubMed] [Google Scholar]
- 6.Fromme J.C., Bruner,S.D., Yang,W., Karplus,M. and Verdine,G.L. (2003) Product-assisted catalysis in base excision DNA repair. Nature Struct. Biol., 10, 204–211. [DOI] [PubMed] [Google Scholar]
- 7.Ferre-D'Amare A.R., Prendergast,G.C., Ziff,E.B. and Burley,S.K. (1997) Recognition by MAX of its cognate DNA through a dimeric B/HLH/Z domain. Nature, 363, 38. [DOI] [PubMed] [Google Scholar]
- 8.Sawaya M.R., Prasad,R., Wilson,S.H., Kraut,J. and Pelletier,H. (1997) Crystal structures of human DNA polymerase beta complexed with gapped and nicked DNA: evidence for an induced fit mechanism. Biochemistry, 36, 11205–11215. [DOI] [PubMed] [Google Scholar]
- 9.Rafferty J.B., Ingleston,S.M., Hargreaves,D., Artymiuk,P.J., Sharples,G.J., Lloyd,R.G. and Rice,D.W. (1998) Structural similarities between Escherichia coli RuvA protein and other DNA-binding proteins and a mutational analysis of its binding to the Holliday junction. J. Mol. Biol., 278, 105–116. [DOI] [PubMed] [Google Scholar]
- 10.Bruner S.D., Norman,D.P.G. and Verdine,G.L. (2000) Structural basis for recognition and repair of the endogenous mutagen 8-oxoguanine in DNA. Nature, 403, 859–866. [DOI] [PubMed] [Google Scholar]
- 11.Doherty A.J., Serpell,L.C. and Ponting,C.P. (1996) The helix–hairpin–helix DNA-binding motif: a structural basis for non-sequence-specific recognition of DNA. Nucleic Acids Res., 24, 2488–2497. [DOI] [PMC free article] [PubMed] [Google Scholar]
- 12.Atchey W. and Fitch,W. (1997) A natural classification of the basic helix–loop–helix class of transcription factors. Proc. Natl Acad. Sci. USA, 94, 5172–5176. [DOI] [PMC free article] [PubMed] [Google Scholar]
- 13.Murre C., McCaw,P. and Baltimore,D. (1989) A new DNA-binding and dimerization motif in immunoglobulin enhancer binding, daughterless, MYOD, and MYC proteins. Cell, 56, 777–783. [DOI] [PubMed] [Google Scholar]
- 14.Boggon T.J., Shan,W.S., Santagata,S., Myers,S.C. and Shapiro,L. (1999) Implication of Tubby proteins as transcription factors by structure-based functional analysis. Science, 286, 2119–2125. [DOI] [PubMed] [Google Scholar]
- 15.Jones S., Shanahan,H.P., Berman,H.M. and Thornton,J.M. (2003) Using electrostatic potentials to predict DNA-binding sites on DNA-binding proteins. Nucleic Acids Res., 31, 7189–7198. [DOI] [PMC free article] [PubMed] [Google Scholar]
- 16.Berman H.M., Westbrook,J., Feng,Z., Gilliland,G., Bhat,T.N., Weissig,H., Shindyalov,I.N. and Bourne,P.E. (2000) The Protein Data Bank. Nucleic Acids Res., 28, 235–242. [DOI] [PMC free article] [PubMed] [Google Scholar]
- 17.Orengo C.A., Michie,A.D., Jones,S., Jones,D.T., Swindells,M.B. and Thornton,J.M. (1997) CATH—a hierarchic classification of protein domain structures. Structure, 5, 1093–1108. [DOI] [PubMed] [Google Scholar]
- 18.Hughey R. and Krogh,A. (1996) Hidden Markov models for sequence analysis: extension and analysis of the basic method. Comput. Appl. Biosci., 12, 95–107. [DOI] [PubMed] [Google Scholar]
- 19.Bateman A., Birney,E., Cerruti,L., Durbin,R., Etwiller,L., Eddy,S.R., Griffiths-Jones,S., Howe,K.L., Marshall,M. and Sonnhammer,E.L. (2002) The Pfam protein families database. Nucleic Acids Res., 30, 276–280. [DOI] [PMC free article] [PubMed] [Google Scholar]
- 20.Letunic I., Goodstadt,L., Dickens,N.J., Doerks,T., Schultz,J., Mott,R., Ciccarelli,F., Copley,R.R., Ponting,C.P. and Bork,P. (2002) Recent improvements to the SMART domain-based sequence annotation resource. Nucleic Acids Res., 30, 242–244. [DOI] [PMC free article] [PubMed] [Google Scholar]
- 21.Sayle R.A. and Milnerwhite,E.J. (1995) RASMOL: biomolecular graphics for all. Trend. Biochem. Sci., 20, 374–376. [DOI] [PubMed] [Google Scholar]
- 22.Matthews B.W. (1975) Comparison of the predicted and observed secondary structure of T4 phage lysozyme. Biochim. Biophys. Acta, 405, 442–451. [DOI] [PubMed] [Google Scholar]
- 23.Guan Y., Manuel,R.C., Arvai,A.S., Parikh,S.S., Mol,C.D., Miller,J.H., Lloid,R.S. and Tainer,J.A. (1998) MutY catalytic core, mutant and bound adenine structures define specificity for DNA repair enzyme superfamily. Nature Struct. Biol., 5, 1058–1064. [DOI] [PubMed] [Google Scholar]
- 24.Shao X. and Grishin,N.V. (2000) Common fold in helix–hairpin–helix proteins. Nucleic Acids Res., 28, 2643–2650. [DOI] [PMC free article] [PubMed] [Google Scholar]
- 25.Pelletier H., Sawaya,M.R., Wolfle,W., Wilson,S.H. and Krant,J. (1996) Crystal structures of human DNA Polymerase B complexed with DNA: implications for catalytic mechanism, processivity and fidelity. Biochemistry, 35, 12742–12761. [DOI] [PubMed] [Google Scholar]
- 26.Aravind T.C., Walker,D.R. and Koonin,E.V. (1999) Conserved domains in DNA repair proteins and evolution of repair systems. Nucleic Acids Res., 27, 1223–1242. [DOI] [PMC free article] [PubMed] [Google Scholar]
- 27.Umland T.C., Wei,S.Q., Craigie,R. and Davies,D.R. (2000) Structural basis of DNA bridging by barrier-to-autointegration factor. Biochemistry, 39, 9130–9138. [DOI] [PubMed] [Google Scholar]
- 28.Shin D.S., Pellegrini,L., Daniels,D.S., Yelent,B., Craig,L., Bates,D., Yu,D.S., Shivji,M.K., Hitomi,C., Arvai,A.S., Volkmann,N., Tsurunta,H., Blundell,T.L., Venkitaraman,A.R. and Tainer,J.A. (2003) Full-length archaeal Rad51 structure and mutants: mechanisms for RAD51 assembly and control by BRCA2. EMBO J., 22, 4566–4576. [DOI] [PMC free article] [PubMed] [Google Scholar]
- 29.Massari M.E. and Murre,C. (2000) Helix–loop–helix proteins: regulators of transcription in eucaryotic organisms. Mol. Cell. Biol., 20, 429–440. [DOI] [PMC free article] [PubMed] [Google Scholar]
- 30.Murre C., Bain,G., van Dijk,M.A., Engel,I., Furnari,B.A., Massari,M.E., Matthews,J.R., Quong,M.W., Rivera,R.R. and Stuiver,M.H. (1994) Structure and function of helix–loop–helix proteins. Biochim. Biophys. Acta, 1218, 129–135. [DOI] [PubMed] [Google Scholar]
- 31.Littlewood T.D. and Evan,G. (2001) Helix–loop–helix transcription factors. Protein Profile, 1–223. [PubMed] [Google Scholar]
- 32.Brownlie P., Ceska,T.A., Lamers,M., Romier,C., Theo,H. and Suck,D. (1997) The crystal structure of an intact human max–DNA complex: new insights into mechanisms of transcriptional control. Structure, 5, 509. [DOI] [PubMed] [Google Scholar]
- 33.Parraga A., Bellsolell,L., Ferre-D'Amare,A.R. and Burley,S.K. (1998) Co-crystal structure of sterol regulatory element binding protein 1 Å at 2.3 Å resolution. Structure, 6, 661. [DOI] [PubMed] [Google Scholar]
- 34.Shimizu T., Toumoto,A., Ihara,K., Shimizu,M., Kyogoku,Y. and Ogawa,N. (1997) Crystal structure of PHO4 bhlh domain–DNA complex: flanking base recognition. EMBO J., 16, 4689. [DOI] [PMC free article] [PubMed] [Google Scholar]
- 35.Ma P.C.M., Rould,M.A., Weintraub,H. and Pabo,C.O. (1994) Crystal structure of MYOD BHLH domain bound to DNA: perspectives on DNA recognition and implications for transcriptional activation. Cell, 77, 451. [DOI] [PubMed] [Google Scholar]
- 36.Ferre-D'Amare A.R., Pognonec,P., Roeder,R.G. and Burley,S.K. (1994) Structure and function of the b/HLH/Z domain of USF. EMBO J., 13, 180. [DOI] [PMC free article] [PubMed] [Google Scholar]
- 37.Hubbard S.J. (1993) NACCESS. Department of Biochemistry and Molecular Biology. University College London, London, UK.
- 38.Stawiski E.W., Gregoret,L.M. and Mandel-Gutfreund,Y. (2003) Annotating nucleic acid-binding function based on protein structure. J. Mol. Biol., 326, 1065–1079. [DOI] [PubMed] [Google Scholar]
- 39.Kim Y., Eom,S.H., Wang,J., Lee,D.S., Suh,S.W. and Steitz,T.A. (1995) Crystal structure of Thermus aquaticus DNA polymerase. Nature, 376, 612. [DOI] [PubMed] [Google Scholar]
- 40.Hashimoto H., Inoue,T., Nishioka,M., Fujiwara,S., Takagi,M., Imanaka,T. and Kai,Y. (1999) Hyperthermostable protein structure maintained by intra and inter-helix ion-pairs in archaeal O6-methylguanine-DNA methyltransferase. J. Mol. Biol., 292, 707–716. [DOI] [PubMed] [Google Scholar]
- 41.Yan Y., Barlev,N.A., Haley,R.H., Berger,S.L. and Marmorstein,R. (2000) Crystal structure of yeast Esa1 suggests a unified mechanism for catalysis and substrate binding by histone acetyltransferases. Mol. Cell., 6, 1195. [DOI] [PubMed] [Google Scholar]
- 42.Christodoulou E. and Vorgias,C.E. (1998) Cloning, overproduction, purification and crystallization of the DNA binding protein HU from the hyperthermophilic eubacterium Thermotoga maritima. Acta Crystallogr., D54, 1043. [DOI] [PubMed] [Google Scholar]
- 43.Lewis R.J., Krzywda,S., Brannigan,J.A., Turkenburg,J.P., Muchová,K., Dodson,E.J., Barák,I. and Wilkinson,A.J. (2000) The trans-activation domain of the sporulation response regulator Spo0A revealed by X-ray crystallography. Mol. Microbiol., 38, 198. [DOI] [PubMed] [Google Scholar]
- 44.Wright P.E. and Dyson,H.J. (1999) Intrinsically unstructured proteins: re-assessing the protein structure–function paradigm. J. Mol. Biol., 293, 321–331. [DOI] [PubMed] [Google Scholar]
- 45.Weiss M.A., Ellenberger,T., Wobbe,C.R., Lee,J.P., Harrison,S.C. and Struhl,K. (1990) Folding transition in the DNA-binding domain of GCN4 on specific binding to DNA. Nature, 347, 575–578. [DOI] [PubMed] [Google Scholar]
- 46.Murzin A.G., Brenner,S.E., Hubbard,T. and Chothia,C. (1995) SCOP: a structural classification of proteins database for the investigation of sequences and structures. J. Mol. Biol., 247, 536–540. [DOI] [PubMed] [Google Scholar]


