


Abstract
Chromatin modulation at various cis-acting elements is critical for V(D)J recombination during T and B cell development. MARβ, a matrix-associated region (MAR) located upstream of the T cell receptor β (TCRβ) enhancer (Eβ), serves a crucial role in silencing Eβ-mediated TCR activation. By DNaseI hypersensitivity assays, we show here that overexpression of the MAR binding proteins SMAR1 and Cux/CDP modulate the chromatin structure at MARβ. We further demonstrate that the silencer function of MARβ is mediated independently by SMAR1 and Cux/CDP as judged by their ability to repress Eβ-dependent reporter gene expression. Moreover, the repressor activity of SMAR1 is strongly enhanced in the presence of Cux/CDP. These two proteins physically interact with each other and colocalize within the perinuclear region through a SMAR1 domain required for repression. The repression domain of SMAR1 is separate from the MARβ binding domain and contains a nuclear localization signal and an arginine–serine (RS)-rich domain, characteristic of pre-mRNA splicing regulators. Our data suggest that at the double positive stage of T cell development, cis-acting MARβ elements recruit the strong negative regulators Cux and SMAR1 to control Eβ-mediated recombination and transcription.
INTRODUCTION
The T cell receptor β gene locus (TCRβ) has been well studied with respect to V(D)J recombination and transcription. Besides, trans-acting regulators such as the recombination-activating genes (RAG1 and RAG2), cis-elements such as enhancers and promoters also play a critical role in the recombination process (1,2). Transcriptional enhancers and promoters are known to provide tissue-, lineage- and developmental stage-specific accessibility to the V(D)J recombination machinery (2–4). The TCRβ gene enhancer (Eβ), an indispensable cis-element within the TCRβ locus, has been shown to regulate germline transcription as well as recombination of Dβ and Jβ gene segments. Deletion of Eβ from the endogenous locus results in impaired transcription and rearrangement of Dβ to Jβ as well as Vβ to DβJβ gene segments (5–7). Similarly, in transgenic mice, insertion of Eβ into recombination-competent substrates leads to germline transcription and recombination of not only Dβ to Jβ but also of Vβ to DβJβ gene segments (8,9).
V(D)J recombination is a tightly regulated complex process that occurs during transition from double negative (DN) to double positive (DP) stage of T cell development. Once the process is complete, the DP cells differentiate into single positive stage expressing either CD4 or CD8 markers and the cells are finally exported to the periphery. To regulate chromatin accessibility for V(D)J recombination, various cis-elements are involved that include S/MARs (scaffold/matrix attachment regions), LCRs (locus control regions), silencers and insulators (10). MARs are the cis-elements that are closely associated with promoters and enhancers (11–13) and are often found to flank antigen receptor genes, including the Igκ light chain (14), IgH heavy chain (15–17), the TCR α/δ18, TCRβ (19) and the TCR co-receptor CD8α gene loci (20). Depending on the context, MARs have been shown to exhibit widespread transcriptional regulatory functions whereby they may either promote (21,22) or inhibit transcription (19,16,23–26).
MARs are known to provide binding sites for specific proteins (MAR-binding proteins or MARBPs) that can influence the transcription of associated gene loci. Several MARBPs have been identified, some of which include Cux/CDP (25,22), SATB1 (special AT-rich DNA-binding protein 1) (27,28) and Bright (29,30). Another MARBP that has been recently added to this list is SMAR1 (scaffold/matrix associated region 1) (31). SMAR1 binds to MARβ, an ATC-rich sequence located ∼400 bp upstream of Eβ. Its high sequence conservation in human and mouse suggested that MARβ might play an important functional role during T cell development. This idea was further strengthened by the observation that MARβ (HS1) is the major DNaseI hypersensitive site induced during the TCR co-receptor CD4CD8 DN to DP stage of thymocyte development, whose induction is concomitant with the halt of TCRβ V(D)J recombination in DP thymocytes (32). By electrophoretic mobility shift assays (EMSAs), three MARBPs—SMAR1, Cux/CDP and SATB1—have been shown to bind to MARβ (19,31).
The smar1 gene is expressed in three alternatively spliced forms, one having a deletion of 117 bp in the N-terminus (31). Each SMAR1 protein isoform shares a significant homology with MARBPs-SATB1, Cux and with the tetramerization domain of Bright (31). SMAR1, recently, has been shown to function as a candidate tumor suppressor protein that regulates the cell cycle through direct interaction with p53 (33). The MARBP SATB1 is expressed preferentially and abundantly in the thymus. It was first reported to bind to a region of high unwinding potential within the 3′ MAR of the IgH enhancer (27). SATB1 has been demonstrated to repress the transcription of a stably integrated reporter gene appended to a MAR associated with the human interferon-β gene (28). CDP/Cux (CCAAT-displacement protein/Cut homeobox) is a component of NF-μNR (nuclear factor μ negative regulator), a candidate repressor first identified as a nuclear factor that binds to both flanking regions of the IgH intronic enhancer (Eμ) (25). In vitro studies demonstrated that NF-μNR can inhibit nuclear matrix attachment of Eμ (34). The Cux/CDP homeoprotein represses the Eμ enhancer by antagonizing the transcription activator Bright via preferential competition for shared binding sites within the Eμ flanking MARs (22). Cux/CDP is ubiquitously expressed and has been shown to exhibit wide transcriptional repressor activities of many genes (20,35,36).
Here, we show that chromatin modulation at MARβ occurs only at the DP stage of thymocyte development. Interestingly, upon overexpression of the MARBPs, SMAR1 and Cux, MARβ gets modulated even in non-T-cells. On the other hand, chromatin at the Eβ enhancer is accessible uniformly during all stages of T cell development but is not detected in B cells. We show that the silencer function of MARβ is mediated by MARβ-associated proteins, SMAR1 and Cux/CDP, both of which either independently or synergistically function as strong transcriptional repressors for the Eβ enhancer. The repressor activity of SMAR1 lies within a short region (residues 160–350) rich in arginine–serine (RS) that contains a nuclear localization signal (NLS). SMAR1 and Cux physically associate, and the RS-rich region is sufficient for maximum interaction. SMAR1 and Cux, presumably as a complex, colocalize primarily within the perinuclear envelope, a site consistent with a model of cooperative interaction of the two MARBPs within the nuclear matrix.
MATERIALS AND METHODS
Plasmid DNAs and probes used
The generation of pBK-CMV-SMAR1S and 3×FLAG–SMAR1S expression constructs was described previously (32,33). The luciferase reporter constructs pGL2-HS1-Eβ and pGL2-Eβ have been described previously (19), where the SV40 promoter in pGL2 promoter vector (Promega, Madison, WI) was deleted by BglII–HindIII digestion and replaced by a 424 bp EcoRI–NcoI fragment containing the Vβ13 promoter (19). In the pGL2-Eβ construct, an 830 bp BglII–NcoI fragment containing Eβ was cloned into the BamHI site located downstream of the poly(A) site of luciferase gene (19). A 1 kb BsgI–NcoI fragment containing HS1 (MARβ) and Eβ in their natural configuration has been inserted into the same position of pGL2-Eβ to generate pGL2-HS1-Eβ (Figure 1B). The Renilla luciferase reporter vector, pRL-CMV (Promega), was used as an internal control in the luciferase assays. SMAR1 truncations were generated as follows: full-length pBK-CMV-SMAR1 construct was digested with AflIII, followed by klenowing and digestion with EcoRI to generate an 850 bp fragment. This fragment was cloned into the EcoRI–SmaI site of pEGFP-C1 (Clontech), resulting in a SMAR1 (1–245 amino acids) N-terminal construct. The truncation SMAR1 (160–350), and SMAR1 (350–548) were made by generating forward and reverse primers (using pBK-CMV-SMAR1 as template) having EcoRI and BamHI sites at 5′ and 3′ ends, respectively. The products generated by PCR were directly cloned into the EcoRI–BamHI site of the pEGFP-C1 vector. The truncations SMAR1 (160–350), SMAR1 (1–245) and SMAR1 (350–548) were FLAG-tagged by cloning them as EcoRI–HindIII products into 3× FLAG (Sigma). For EMSAs, 128 bp AccI–BsgI DNA fragment upstream of 170mer MARβ was isolated from p780 plasmid (19). For isolation of 170 bp MARβ fragment, SW14 (31) plasmid was digested by XhoI and EcoRI and the DNA fragment was labeled and used in the EMSAs. The 37 bp core MARβ was generated by annealing oligos that were commercially synthesized (Genomechanix, USA). The core 37mer probe was prepared by annealing 47 bp sense (5′-TCGAGAGGTAATATAAATAGGGAGATAGGAGTGTGAGAGAGTGAGCT) and 39 bp anti-sense oligos (5′-TCTCTCACACTCCTATCTCCCTATTTATATTACCTCTCGA) in the presence of 1× SSC. The mixture was incubated at 95°C for 2 min followed by annealing till the temperature comes down to room temperature. The annealed product was gel-purified and labeled using [α-32P]dCTP, dNTPs and Klenow fragment of DNA polymerase I. The labeled double-stranded DNA was further purified using probequant G-50 columns (Amersham, Pharmacia) following the manufacturer's instructions.
Figure 1.
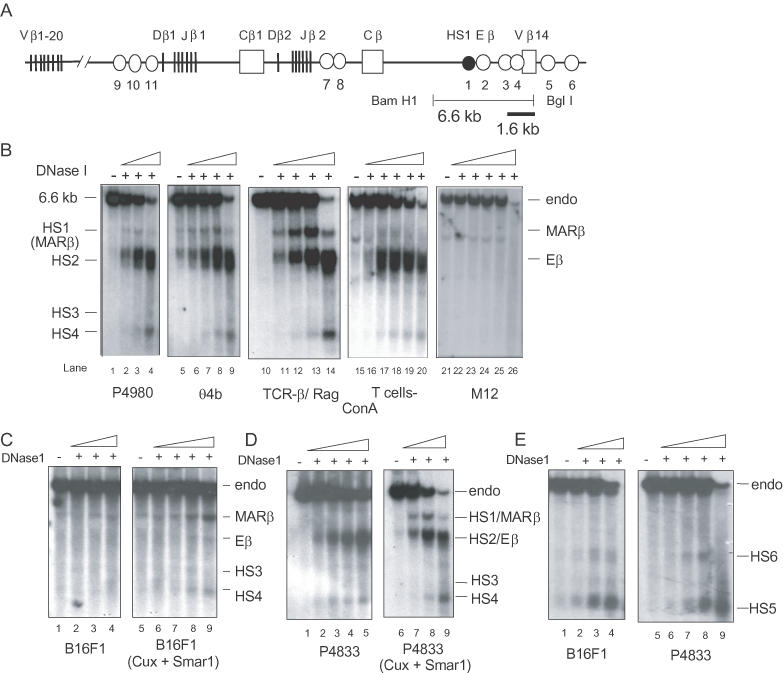
Analysis of DNaseI hypersensitive sites at the TCRβ locus in T- and non-T cells. (A) Schematic representation of DNaseI hypersensitive sites (HS) identified within the 40 kb TCRβ locus spanning Dβ1 to Vβ14 (not drawn to scale). There are 11 HS sites (represented by circles) in this region. HS1/MARβ, upstream of the Eβ enhancer (HS2), is represented by solid circle. The position of a 1.6 kb probe (bold line) used to analyze DNAseI sensitivity within the region spanning the enhancer and MARβ (6.6 kb BamHI–BglI fragment, thin line) is indicated. (B) HS1 is induced in DP T cells. Autoradiograms of Southern hybridization experiments showing the generation of HS1 through HS4 cleavages within the 6.6 kb BamHI–BglI fragment (endo). Description and isolation of DN (P4980) and DP (θ4b) T cell lines, primary DP thymocytes from TCRβ-RAG (TCRβ transgene in RAG−/− mice) transgenic mice, ConA-activated SP peripheral normal T cells and the B cell line M12 are described in Materials and Methods. For SP T cells, lymph node T cells from normal mice was isolated and treated with ConA for two days. The DNA was isolated from DNaseI-treated nuclei of all the cells or cell lines mentioned above, digested with BamHI and BglI and hybridized with a 1.6 kb probe as described in Materials and Methods. The nuclei were digested with increasing concentrations (0.125–1 μg/ml as indicated by triangles of DNaseI. (C) Overexpression of Cux/CDP and SMAR1 in non-T-cell lines (B16F1) modulates accessibility within the MARβ region. Autoradiograms of Southern hybridization experiments indicating HS1/MARβ through HS4 are shown. Cells were stably transfected with both Cux and SMAR1 in either B16F1 cells (lanes 5–9). (D) Isolated nuclei from a DN Rag−/− mutant cell line (P4833) were processed for DNaseI hypersensitivity assays as mentioned above. Upon transfection with SMAR1 and Cux, the four hypersensitive sites generated are shown. Lanes 1–4 denote the control P4833 cells that are mock transfected. (E) The DNaseI blot was reprobed with the control probe (0.8 kb probe that scans Vβ14 region and hybridizes with the 9 kb fragment).
Cell lines used and FACS analysis
The thymoma line P4980 and P4833 were derived from CD4−CD8− DN thymocytes of mouse deficient in both p53 and RAG1, and the thymoma line θ4b was derived from DP thymocytes of a mouse deficient in both p53 and TCRα (19,32). B16-F1 (mouse melanoma) cells obtained from our in-house repository (NCCS, Pune, India) were used as a source of single positive mature T cells. The cells isolated from the lymph node were incubated with concavalin A (ConA) for 72 h and analyzed by fluorescence-activated cell sorting (FACS) using anti-CD4 and anti-CD8. M12, a murine B cell lymphoma was used as a representative of mature B lineage cells. The thymoma and M12 lines were grown in RPMI medium, whereas B16F1 cells were grown in DMEM. Both media were supplemented with 10% fetal bovine serum (FBS) in the presence of 5% CO2 at 37°C.
Transfection, analysis of gene expression and luciferase assays
The T cell line 4980 and mouse melanoma B16F1 cells were grown in DMEM supplemented with 10% FBS in the presence of 5% CO2 at 37°C. A total number of 1 × 10⁶ cells were plated on a 6-well plate. After 24 h, cells were then transiently transfected using lipofectamine-2000 with varying amounts of pBK-CMV-SMAR1S expression plasmid (2.5–10 μg); 2.5–10 μg of pCEP4-Cux or of various truncated versions of SMAR1 (1–245), (160–350) and SMAR1 (350–548); 5 μg of either pGL2-promoter, pGL2-HS1/MARβ, pGL2-Eβ or pGL2-HS1-Eβ expression plasmids having luciferase reporter gene (19). Two micrograms of pRL-CMV (Renilla luciferase reporter DNA) was included in all transfections and used to normalize the transfection efficiency. The cells were harvested 48 h post-transfection, washed with 1× phosphate-buffered saline (PBS) and lysed in 1× Passive lysis buffer (Promega). After three freeze–thaw cycles, cells were spun at 10 000 r.p.m. at 4°C for 20 min. The supernatants were collected and protein concentrations were estimated spectrophotometrically using the Bradford reagent as recommended by the manufacturer's instructions (BioRad, CA). Luciferase activity was assessed using the dual luciferase assay reporter kit (Promega), according to the manufacturer's instructions and the luciferase activity was measured by using Fluoroskan Ascent Luminometer (Labsystems). For all the luciferase assays, the data shown are the mean ± SD of four independent experiments. For DNaseI hypersensitivity assays, T cell line P4833 and non-T cell line B16F1 were electroporated with 15 μg of either Cux or SMAR1 or both plasmids. The cells were selected with G418 for 5 days and nuclei were prepared as mentioned below.
DNaseI hypersensitivity assays
Nuclei from various primary cells and cell lines were isolated as reported in (32). For DNaseI hypersensitivity assays from either cell lines or primary cells, 1 × 10⁷ cells were washed in cold 1× PBS, centrifuged at 1000 rpm and resuspended in 10 ml reticulocyte standard buffer (RSB) containing 10 mM Tris–HCl, pH 8, 10 mM MgCl2, 50 mM NaCl. The cells were slowly mixed in swirling condition with cold RSB buffer containing 0.2% Nonidet P-40, kept on ice for 10 min, and then centrifuged at 1200 r.p.m. for 5 min. The detergent-treated nuclei were resuspended in 2 ml RSB buffer and were divided into 200 μl aliquots in 10 different tubes followed by incubation for 2 min in the presence of increasing concentrations of DNaseI (0.1–10 μg/ml). The digestions were stopped using an equal volume (200 μl) of lysis buffer containing 1.2 M NaCl, 20 mM Tris–HCl, pH 8, 10 mM EDTA and 1% SDS. The lysates were then processed for DNA isolation by phenol–chloroform extraction.
Southern hybridization
For Southern analysis, 15–20 μg of each of the DNaseI-treated chromosomal DNA samples were digested with 40 U of BamHI and BglI overnight and then electrophoresed on a 0.9% agarose gel in 1× TBE. After denaturation and neutralization, DNA was transferred to Zeta-probe filters and hybridized to a 1.6 kb HindIII–BglI fragment isolated from the Vβ14 upstream region (32) and end-labeled with [α-32P]dCTP. After 18 h of incubation at 42°C, filters were washed for 30 min in 2× SSC and 0.1% SDS at 65°C. The hybridization signals were detected by phosphorimaging and autoradiography.
Immunofluorescence microscopy
Mouse Melanoma (B16F1) cells were plated at a seeding density of 2 × 10⁵ cells/ml on coverslips in a 35 mm culture dish. For nuclear localization studies, the cells were transfected with 1.0 μg of GFP–SMAR1 fusion constructs—full-length GFP–SMAR1, GFP–SMAR1 (160–350), GFP–SMAR1 (1–245) and GFP–SMAR1 (350–548). Cells were counterstained with DAPI for nuclear localization. For colocalization studies, cells were cotransfected with 1.0 μg of either pCEP4-Cux or 3×FLAG–SMAR1S or with pCEP4-Cux and 3×FLAG-160-350 amino acid constructs using lipofectamine-2000 (Life Technologies). Forty-eight hours post-transfection, the cells were washed with 1× PBS and fixed with 2% paraformaldehyde made in 200 mM HEPES buffer for 15 min at room temperature. Cells were washed for 5 min in PBS, permeabilized with 0.1% Triton X-100 in PBS for 5 min, and blocked in 10% FBS in PBS for 1 h. For co-staining with anti-Cux and anti-FLAG (Sigma), the primary antibodies were diluted in blocking buffer at 1:100 and 1:50 dilutions, respectively. The secondary antibodies for Cux and FLAG–SMAR1S used were fluorescein isothiocyanate (FITC)-conjugated anti-rabbit immunoglobulin (Bangalore Genei, India) and indocarbocyanin (CY3)-conjugated anti-mouse immunoglobulin (Amersham Biosciences, UK) at 1:100 dilutions. After processing the cells on the coverslips, the latter were mounted in antifade on the slide and the samples were analyzed with a confocal laser microscope (Zeiss LSN 510, version 2.01) equipped with filters for fluorescein and Cy3 epifluorescence. For excitation, 488 and 543 nm laser lines and for emission, 505 to 530 nm band-pass and 560 nm long-pass filters were used, respectively.
Electrophoretic mobility shift assays
DNA probes for EMSAs were end-labeled with [α-32P]dCTP using the Klenow fragment of DNA polymerase I. For each EMSA, ∼10 ng (∼20 000 c.p.m.) of labeled DNA fragment was incubated with variable amounts of either GST–Cux/CDP (0.25–1.0 μg) or GST–SMAR1 (0.5–1.0 μg) proteins at room temperature for 30 min. The reaction was performed in a total volume of 10 μl containing 10 mM Tris–HCl, pH 8.0, 100 mM NaCl, 20 ng BSA, 10 mM MgCl2, 5% glycerol, 2 mM DTT and 1 μg (100 μg/ml) poly(dI–dC) (Sigma). For EMSAs in the presence of antiserum, probes (170 or 37mer) were incubated with either GST–Cux or GST–SMAR1 proteins followed by incubation at room temperature for an additional 10 min in the presence of respective antibodies. For competition assays either 170mer MARβ or 128 bp upstream MARβ fragments were used. The competitor DNAs used varied from 50 ng to 1μg, which were 5- to 100-fold excess than that of probe DNA. The incubated mixture was eletrophoresed on a 5% polyacrylamide gel (acrylamide: bisacrylamide, 29:1) in 0.5× TBE buffer at 10 V/cm for 3 h in the cold room. Gels were finally dried and autoradiographed.
Western blotting
For protein expression analysis, B16F1 cells were seeded at 3 × 10⁵/ml and were transfected with either GFP- or FLAG-tagged full-length SMAR1 and its truncated domains (1–245, 160–350 and 350–548). Cells were collected after 48 h, washed in 1× PBS and then lysed in 1% Triton X-100 buffer [100 mM NaCl, 10 mM EDTA, 20 mM Tris, pH 7.5, 1% Triton-X-100, 0.01% SDS, 5 mM phenyl methyl sulfonyl fluoride (PMSF), 5% glycerol and complete protease inhibitor cocktail (Bohreinger Mannheim)]. Proteins were separated on a 10% SDS–polyacrylamide gel and transferred electrophoretically to a Sequi-Blot polyvinylidene fluoride (PVDF) membrane (Amersham Pharmacia) in 20 mM sodium phosphate buffer (pH 6.8) as described in (33). The membrane was then immunoblotted, according to standard procedures, with anti-GFP (Santacruz) or anti-FLAG (Sigma) antibodies. Bands were detected with the ECL™ plus chemoluminescence reagent (Amersham).
In vitro interaction assay
B16F1 cells were seeded at a density of 5 × 10⁵ cells/ml in a 60 mm culture dish. After 24 h, the cells were transfected with 3× FLAG-tagged full-length SMAR1 (Flag–SMAR1) and truncation constructs Flag–SMAR1 (1–245), Flag–SMAR1 (160–350) and Flag–SMAR1 (350–548). Forty-eight hours post transfection; the cells were harvested and washed twice with 1× PBS. The cell pellets were resuspended in lysis buffer (50 mM HEPES, pH 7.4, 1.5 mM MgCl2, 150 mM NaCl, 10% glycerol, 1% Triton X-100, 1 mM EDTA, 10 mM NaF, 1 mM Na3VO3, 1 mM PMSF and protease inhibitor cocktail), incubated for 30 min on ice and spun at 10 000 r.p.m. for 30 min at 4°C. The supernatants were collected and the protein concentrations were estimated using Bradford Reagent (Bio-Rad). Each sample (200 μg) was incubated with 10 μl of FLAG tagged beads at 4°C overnight on a rocker platform. The beads were then washed three times with 200 μl 1× PBS containing 0.1% NP40 and collected by centrifugation at 12 000 r.p.m. for 3 min at 4°C. The immunoprecipitates were boiled in 6× SDS gel loading dye (reducing) for 3 min at 95°C, run on an 8% SDS–polyacrylamide gel and transferred to a PVDF membrane (HyBond, Amersham). The membrane was then immunoblotted with anti-Cux antibody and detected with ECL plus reagent (Amersham).
RESULTS
T cell-specific chromatin modulation at MARβ
We showed in (32) that, within a 100 kb region spanning the mouse TCRβ locus, 11 DNaseI hypersensitive sites are accessible during the DN to DP transition stage of thymocyte differentiation (Figure 1A). Among these sites, HS1, located 400 bp upstream of the TCRβ enhancer (Eβ) (Figure 1A), was most prominently induced at the DP stage (32). Later studies (19) confirmed HS1 as an ATC-rich nuclear matrix-associated region (referred to as MARβ) whose induction is accompanied with increased binding of two known MARBPs, CDP/Cux and SATB1. EMSA further demonstrated that a novel MARBP, SMAR1, binds specifically to this MARβ region (31).
To study the chromatin modulation at MARβ, DNaseI hypersensitivity assays were performed on DNA isolated from nuclei of primary thymocytes and peripheral (lymph node) T cells purified from wild-type mice, from T cell lines derived from DN (P4980 and P4833) or DP (θ4b) thymomas and from M12 lymphoma mature B cells. Using a 1.6 kb Vβ14 upstream probe, within a 6.6 kb BamHI–BglI fragment, four hypersensitive sites (HS1, HS2, HS3 and HS4) were identified (32) (Figure 1B). Among these, HS2, corresponding to the Eβ enhancer, was equally accessible in all T cells (Figure 1B, lanes 1–20). However, in the M12 B cell line, cleavage products corresponding to HS1–HS4 were not detected (Figure 1B, lanes 21–26), indicating the absence of chromatin modulation within this region. In P4980 DN T cells, HS1/MARβ-associated cleavage was only faintly detected, as compared to nuclei from either θ4b (DP cell line) or TCRβ transgenic RAG−/− thymocytes (Figure 1B, lanes 1–14). In TCRβ transgenic RAG−/− mice, 98% of the thymocytes are arrested at the DP stage (32). Interestingly, no MARβ signal was observed in nuclei isolated from mature Con A-stimulated lymph node T cells, a population representative of SP T cells (1B, lanes 15–20). This suggests that in DN T cells and peripheral mature T cells, the MARβ region is not accessible, indicating stage-specific modulation of MARβ. Thus, MARβ, the binding site for SMAR1, is accessible primarily at the DP stage of thymocyte development where SMAR1 was found to be abundantly expressed (31), suggesting that SMAR1 may be involved in the modulation of MARβ.
SMAR1 and Cux together modulate MARβ region
MARβ was previously shown to be bound by both SMAR1 and Cux (31). To determine their effect upon binding to MARβ in vivo, SMAR1 and Cux were stably expressed in either a RAG−/− DN T cell line (P4833) or a non-T-cell line (B16 F1). DNaseI hypersensitivity assays were performed as described above. Untransfected B16F1 nuclei showed a faint band corresponding to HS1/MARβ but did not show prominent bands for the other three hypersensitive sites (Figure 1C, lanes 1–4). Upon overexpression of SMAR1 and Cux, the MARβ site was more prominently induced (Figure 1C, lanes 6–9), indicating enhanced chromatin alteration in the presence of these two proteins. Densitometry analysis of HS1/MARβ band shows a 1.8- to 2-fold increase in B16F1 cells overexpressing Cux and SMAR1 compared to the control B16F1 cells (Figure 1C, lane 9 versus 4, respectively). On the other hand, by performing DNaseI hypersensitivity assays in a DN T cell line, all other HS sites except HS1/MARβ were present (Figure 1D, lanes 1–5). Interestingly, upon co-expression of SMAR1 and Cux, HS1/MARβ was significantly induced and accessible to DNaseI (Figure 1D, lanes 6–9). However, chromatin alteration at the MARβ site was not as prominent when either SMAR1 or Cux were independently expressed in either T- or non-T-cell lines (data not shown). These results suggest that accessibility to MARβ region requires the coexistence of two MARBPs, SMAR1 and Cux. To compare the DNaseI digestion in the four panels, the blots were reprobed with 0.8 kb probe that scans Vβ14 region (19). These two cell lines showed two DNase1 hypersensitive sites that correspond to HS5 and HS6 (Figure 1E, lanes 1–4 and 5–9) showing that the DNase digestion series in the B16F1 cells is similar to the P4833 cells.
SMAR1 negatively regulates enhancer (Eβ) function
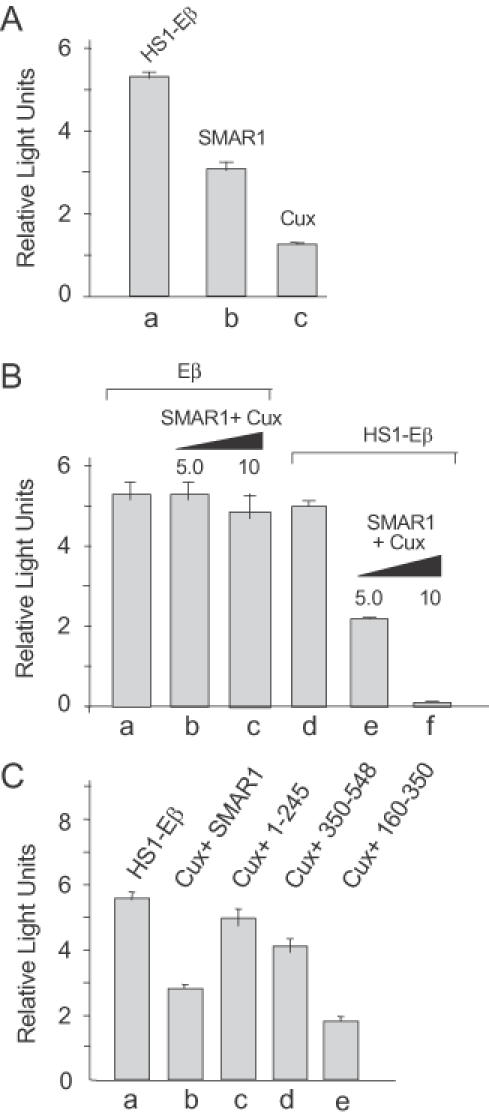
MARβ is highly accessible at the DP stage of thymocyte development and is known to function as a silencer of Eβ transcription (19). Since SMAR1 is abundantly expressed at the DP stage and binds to MARβ (31) (Figure 2A), we were interested in deciphering the role of SMAR1 in the context of Eβ. To analyze the effect of SMAR1 on Eβ transcription, transient transfections were performed using luciferase reporter constructs driven by the Vβ13 promoter that contain the enhancer alone (pGL2-Eβ), the MARβ alone (pGL2-MARβ) or the enhancer-MARβ silencer (pGL2-HS1-Eβ) regions as described in Figure 2B and in Materials and Methods. Within the 1 kb HS1-Eβ fragment, MARβ/HS1 spans ∼170 bp, whereas the Eβ constitutes the core enhancer of ∼550 bp in length (Figure 2A). We showed previously that compared with pGL2-Eβ, the transcriptional activity of pGL2-HS1-Eβ was reduced in various thymoma lines (19). To confirmatively establish that the effect of SMAR1 is specific for HS1-Eβ, both MARβ and Eβ constructs were checked for their activity upon overexpression of SMAR1. MARβ alone shows a basal activity while a 4- to 6-fold higher activity was observed for Eβ (Figure 2C, lanes b and e, respectively). However, there was no significant decrease in the activity of MARβ and Eβ with increasing concentrations of SMAR1 (Figure 2C, lanes c and d, f and g, respectively) as seen with HS1-Eβ (Figure 2D, lanes d–f). This suggested that MARβ, presumably through its binding factors (SMAR1, Cux and SATB1) (31), was interacting with the Eβ enhancer to mediate transcriptional repression. To test this further, initial transfections were performed in a DN (P4980) T cell line that expresses low levels of SMAR1 (31). Upon transfection with the control pGL2 vector, no appreciable transcriptional activity was observed (Figure 2D, lane a). When the cells were transfected with pGL2-HS1-Eβ, there was a 1.4-fold decrease in transcription as compared to pGL2-Eβ (Figure 2D, lanes c and b, respectively). However, cotransfection and overexpression of SMAR1 resulted in a significant (∼3- to 30-fold) dose-dependent repression of pGL2-HS1-Eβ transcription in 4980 cells relative to control (Figure 2D, lanes d–f). Thus, SMAR1 upon binding to MARβ/HS1 strongly represses TCRβ enhancer function.
Figure 2.
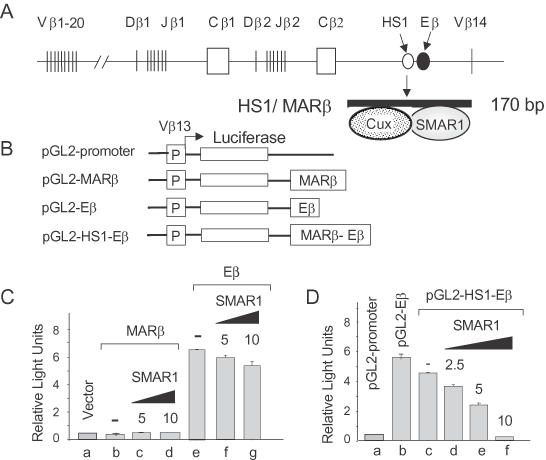
SMAR1 represses Eβ-dependent reporter gene expression. (A) Schematic representation of the TCRβ locus depicting various V, D and J gene segments (not drawn to scale). The open circle denotes HS1/MARβ, which is just upstream of the TCRβ enhancer (Eβ) (solid circle). Within the 170 bp MARβ region, two proteins SMAR1 and Cux bind as depicted. (B) Schematic diagrams of the luciferase reporter constructs (not drawn to scale) used, the details of which are mentioned in Materials and Methods. All the constructs contain a common Vb13 promoter. The pGL2-Eβ contains Eβ inserted downstream of the poly(A) site of luciferase, pGL2-MARβ contains 170 bp MARβ/HS1 but no enhancer, and pGL2-HS1-Eβ includes MARβ/HS1 and Eβ (in their native configuration). (C) P4980 DN cells were transfected either with pGL2-MARβ or pGL2-Eβ alone (lanes b and e) or cotransfected with increasing concentrations of SMAR1 (5–10 μg) (lanes c and d, f and g). (D) Cells were transfected with 5 μg of pGL2 promoter (lane a), pGL2-Eβ (lane b), pGL2-HS1-Eβ (lane c) and cotransfected with 5 μg of pGL2-HS1-Eβ along with varying amounts (2.5–10 μg) of SMAR1 plasmid DNA (lanes d–f). Luciferase activity was monitored in the transfected cell lysates 48 h post-transfection. pRL-CMV Renilla luciferase reporter DNA (3 μg) was included in all transfections and used to normalize the transfection efficiency. The data shown are the mean ± SD of four independent experiments.
Repressor activity of SMAR1 resides within 160–350 amino acids
SMAR1 shares sequence similarity with various MARBPs. For example, residues 328–394 of SMAR1 share sequence similarity with the Cut repeat domains of Cux/CDP and SATB1 (31). To delineate the specific region involved in inducing transcriptional repression of Eβ, various truncation products of SMAR1 fused to either GFP or FLAG were generated as described in Materials and Methods. Prior to transcriptional analysis, the expression of the full-length GFP–SMAR1 and GFP-fused truncated domains of SMAR1 (1–245, 160–350 and 350–548) were confirmed by western blot analysis (Figure 3B). Localization studies of GFP–SMAR1 and GFP–SMAR1-truncations were performed to determine the region(s) required for nuclear localization. We observed that compared with other truncations (A. Jalota et al., unpublished data), SMAR1 (160–350) localized within the nucleus in a pattern similar to that of full-length GFP–SMAR1 (Figure 3D and C, respectively), whereas the cells transfected with the SMAR1 truncations, 1–245 and 350–548 showed a diffused expression (both cytoplasmic and nuclear) (Figure 3E and F, respectively). SMAR1 (160–350) contains an arginine-rich (RTAWRRKQR) domain (residues 324–332) as well as a serine-rich (SFSRRTPSSSSYSAS) domain (residues 342–356) (Figure 10). Similar arginine-rich motifs have been found to mediate translocation of test proteins into the nucleus (37), consistent with our conclusion that the 160–350 region harbors the NLS of SMAR1.
Figure 3.
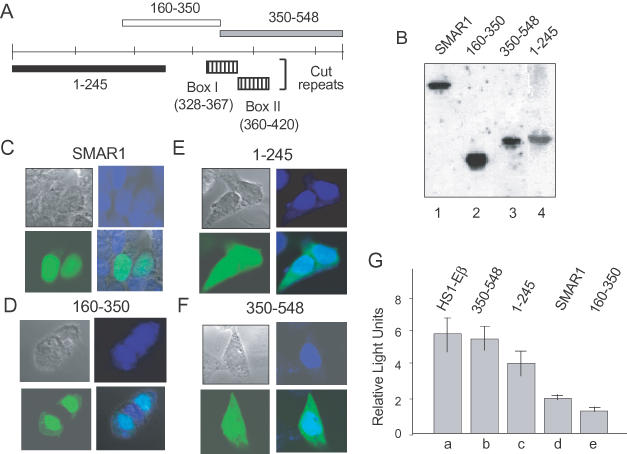
SMAR1 (160–350) contains the NLS and the repression domain. (A) Schematic representation of full-length SMAR1 and SMAR1 truncations (not drawn to scale). The hatched boxes represent the similarity of SMAR1 with the Cut repeat domains of mouse Cux (box I) and human SATB1 (box II). (B) B16F1 cells (2 × 10⁵) were transfected with 1 μg of full-length GFP–SMAR1 and 1 μg of different GFP–SMAR1 truncations. The expression of the transfected constructs was determined by western blot analysis by using anti-GFP antibody as indicated. (C–E) B16F1 cells were transiently transfected with 1 μg of DNAs encoding full-length GFP–SMAR1 (C), GFP–SMAR1 (160–350) (D), GFP–SMAR1 (1–245) (E) or GFP–SMAR1 (350–548) (F). Forty-eight hours post-transfection, localization of the proteins was monitored by direct visualization with an immunofluorescence microscope. GFP–SMAR1 and GFP–SMAR1 (160–350) localizes in the nucleus (C and D) whereas a region from 1–245 and 350–548 show a diffused localization (E and F). Cells were counterstained with DAPI to show nuclear localization. (D) The repressor domain of SMAR1 lies within residues 160–350. (G) The 4980 cells (2 × 10⁶) were transfected with 5 μg of either HS1-Eβ (lane a) or cotransfected with HS1-Eβ in combination with 10 μg of either SMAR1 (350–548) (lane b), SMAR1 (1–245) (lane c), full-length SMAR1 (lane d) or SMAR1 (160–350) (lane e). Forty-eight hours post-transfection, the cells were lysed and processed for dual luciferase assays as described under Materials and Methods. The data shown are the mean ± SD of four independent experiments.
Figure 10.
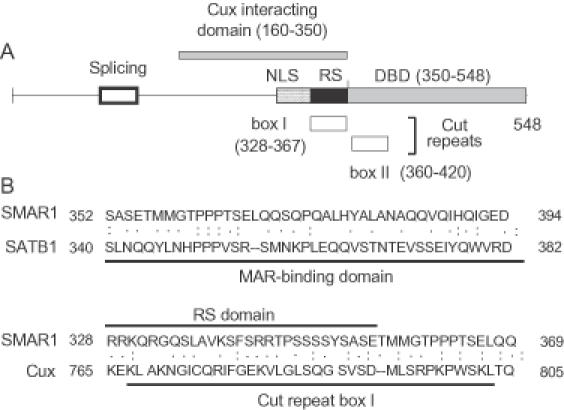
SMAR1 domains and their comparison with other MARBPs. (A) A schematic of the various domains of SMAR1 is indicated (not drawn to scale). The dotted lines at the 5′ end indicate a region, which undergoes alternative pre-mRNA splicing. Residues 160–350 are sufficient for interaction with Cux. The RS domain is represented by solid box, whereas the hatched box corresponds to the NLS. The DNA-binding domain (350–548) is located near the C-terminus of SMAR1. Boxes I and II are the regions of similarity with the Cut repeat 2 of mouse Cux-1 and the single Cut repeat of human SATB1, respectively. (B) Sequence alignments of SMAR1 with human SATB1 and mouse Cux-1. Upper panel, comparison of the MAR binding regions of SMAR1 and SATB1 Lower panel, comparison of the RS domain of SMAR1 with the Cut repeat 2 of mouse Cux-1. Amino acid similarity and identity are indicated by one or two dots, respectively.
Full-length and truncated GFP–SMAR1 fusion constructs were tested for their ability to repress pGL2-HS1-Eβ luciferase activity in 4980 cells. Overexpression of full-length SMAR1 (Figure 3G, lane d) and SMAR1 (160–350) (Figure 3G, lane e) resulted in a 2.8- and a 3.8-fold decrease, respectively, in transcription of Eβ as compared to control (Figure 3G, lane a). In contrast, SMAR1 (1–245) gave only a 1.5-fold decrease in transcription (Figure 3G, lane c) and SMAR1 (350–548) did not show any appreciable decrease (Figure 3G, lane b). These results indicate that the repression domain of SMAR1 resides within residues 160–350. Curiously, this region contains only the N-terminal portion (Box 1, Figure 3A) of the multiple CUT DNA-binding domains conserved between SMAR1 and Cux (31). We conclude that this limited region of homology is sufficient for SMAR1-mediated nuclear localization and repression.
Cux and SMAR1 synergistically repress transcription
Cux/CDP is known to function widely as a transcriptional repressor (34,38–42) and binds to MARβ along with SMAR1 (19,31). Using the same reporter constructs pGL2-Eβ and pGL2-HS1-Eβ, as described above, we tested the transcriptional activity of Eβ upon overexpression of either Cux alone or Cux in association with SMAR1. Compared with the control (Figure 4A, lane a), SMAR1 and Cux independently repress the transcriptional activity of the enhancer by 1.8- and 4-fold, respectively, in 4980 cells (Figure 4A, lanes b and c). Co-expression of Cux and SMAR1 resulted in significant dose-dependent increases in Eβ repression from 2.5- to 27-fold (Figure 4B, lanes e and f) compared with the control (Figure 4B, lane d). However, in case of Eβ alone, co expression of Cux and SMAR1 showed no significant dose-dependent repression (Figure 4B, lanes a–c). Thus, independently both SMAR1 and Cux function as negative regulators of Eβ transcription, but together they synergize to reduce transcription markedly.
Figure 4.
Cux and SMAR1 synergistically repress Eβ-mediated transcription. (A) Cux and SMAR1 independently repress transcription. The 4980 cells were transiently transfected with 5 μg of either HS1-Eβ alone (lane a) or cotransfected with HS1-Eβ and 10 μg of either SMAR1 (lane b) or Cux (lane c). Relative luciferase activity was calculated after 48 h. (B) Cells were either transfected either with 5 μg of pGL2-Eβ alone (lane a), HS1-Eβ (lane b) or cotransfected with 5 μg of Eβ or HS1-Eβ and the indicated amounts (5 or 10 μg) of SMAR1 and Cux (lanes b and c, e and f, respectively). Luciferase assays were performed after 48 h. (C) Cux collaborates with the RS-domain-containing region SMAR1 (160–350). Cells were either transfected with 5 μg of HS1-Eβ (lane a) or cotransfected with HS1-Eβ (5 μg), Cux (10 μg) and 10 μg of either full-length SMAR1 (lane b) or the truncations of SMAR1 (lanes c–e) as indicated.
Various truncations of SMAR1 were cotransfected with Cux to identify the domain that effectively cooperates to repress transcription. Maximal repression (∼3.2-fold) was achieved by SMAR1 (160–350) and Cux (Figure 4C, lane e), as compared with the control (lane a). More modest repression was observed under these expression conditions for Cux cotransfected with full-length SMAR1 (1.9-fold, lane b) or the SMAR1 (1–245) truncation (1.8-fold, lane c). Thus, whether in the presence or absence of Cux, the region of SMAR1 between residues 160–350 is necessary and sufficient for maximum repression.
SATB1 fails to cooperate with SMAR1 for transcriptional regulation of Eβ
Previous EMSA-super shift assays employing anti-SATB1 antiserum demonstrated that SATB1 also binds to the MARβ region (19). Since SATB1 is known to function both as a transcriptional repressor (28,43) and activator (20), we tested its effect on Eβ expression in 4980 cells. Neither dose of SATB1 employed in Figure 5A (lanes b and c) significantly altered Eβ transcription under conditions where the lower dose equivalent of SMAR1 alone exhibited a 2.3-fold decrease in transcription (Figure 5A, lane d). SATB1 does not cooperate with SMAR1, since co-expression of the two proteins gave no appreciable difference in repression (2.5-fold; Figure 5A, lane e) than SMAR1 alone (lane d). An immunoblot showing the protein expression levels of SATB1 in T cells transiently transfected with increasing amounts of SATB1 (5–10 μg) (Figure 5B, lanes 2 and 3). Figure 5B, lanes 1 and 4 show the endogenous levels of SATB1 in T cells. Overexpression of Cux, which also binds to MARβ (31), reduced Eβ-mediated transcription in a dose-dependent manner (1.7- and 2.8-fold, Figure 5C, lanes b and c, respectively). Again, under similar conditions, SATB1 alone produced no significant effects (Figure 5C, lanes d and e). Upon co-expression of Cux and SATB1, there was a slight decrease in repression (1.9-fold, lane g) relative to the equivalent dose of Cux (2.8 fold, lane c), indicating that repression was mediated solely by Cux and not by SATB1. Thus, SATB1 does not function as a repressor and fails to cooperate with either SMAR1 or Cux in modulating Eβ-mediated transcription.
Figure 5.
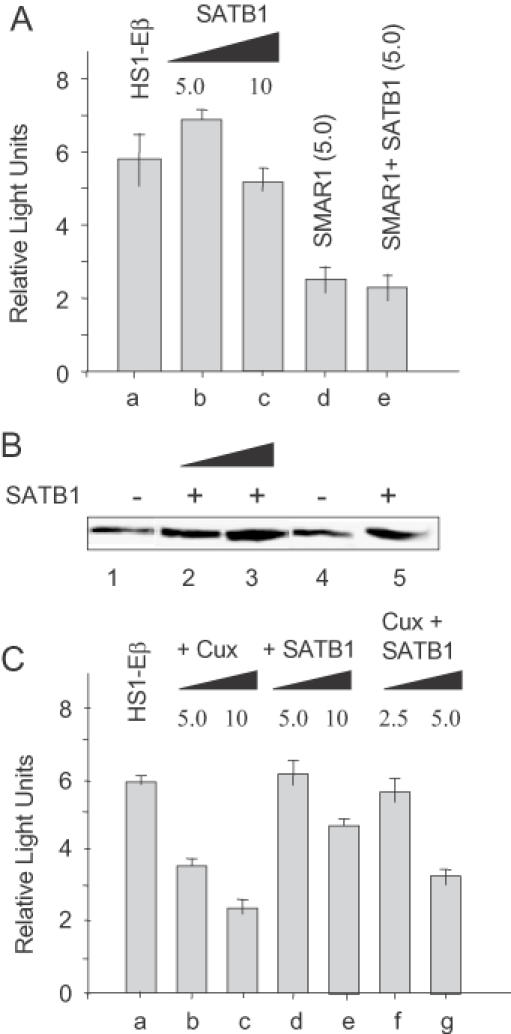
SATB1 does not repress Eβ-mediated transcription. (A) The 4980 cells were transiently transfected with plasmid encoding either HS1-Eβ (5.0 μg) alone (lane a) or cotransfected with HS1-Eβ and different amounts (5 and 10 μg) of SATB1 (lanes b and c, respectively) or 5 μg of SMAR1 (lane d) or with 5 μg each of SMAR1 and SATB1 (lane e) as indicated in the figure. After 48 h, the cells were lysed and processed for luciferase assays. The data shown are the mean ± SD of four independent experiments. (B) The SATB1 protein expression levels were checked using anti-SATB1 by western blot analysis. (C) Cells were transfected with HS1-Eβ (lane a) or cotransfected with HS1-Eβ and various amounts (as indicated) of either Cux (lanes b and c), SATB1 (lanes d and e) or both Cux and SATB1 (lanes f and g). Luciferase activity was measured in the lysates 48 h post-transfection. The data shown are the mean ± SD of four independent experiments.
Colocalization of Cux and SMAR1 in the nucleus
The repression synergy demonstrated for SMAR1 and Cux prompted us to investigate their localization properties. We cotransfected B16F1 cells with expression constructs encoding Cux (pCEP4-Cux) and FLAG-tagged, full-length SMAR1 (3×FLAG–SMAR1S). After 48 h, expression was visualized by indirect immunofluorescence. As shown in Figure 6, we observed several patterns of colocalization. In some cells, Cux (stained green with FITC) accumulated in punctuate foci (Figure 6A, middle panel). Cotransfection of SMAR1 (stained red with CY3) resulted in colocalization of a fraction of SMAR1 (Figure 6A, left panel) within the Cux dots (merged in Figure 6A, center panel). Other cells (Figure 6B, left and right panel) displayed a uniform distribution in which the majority of Cux and SMAR1 in the nucleus were colocalized (merged in Figure 6B, right panel). Interestingly, in the majority of the cells (Figure 6C and D), most of the Cux protein (green panels) colocalized with SMAR1 (red panels) within a perinuclear ring (yellow, merged panels), indicative of an interaction of these two proteins at the nuclear periphery.
Figure 6.
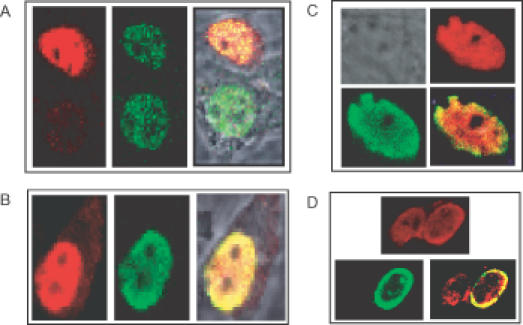
SMAR1 and Cux colocalize within the nucleus in multiple patterns. B16F1 cells were transfected with 1μg of plasmid DNAs encoding either 3×FLAG–SMAR1S or pCEP4-Cux. Their localization was analyzed by immunofluorescence microscopy 48 h later following staining with either polyclonal rabbit antisera against Cux (green) or with a monoclonal antibody (M2) against the FLAG epitope of 3×FLAG–SMAR1S (red). Representative pictures are shown. Images were collected separately and merged (yellow) as depicted. (A) In a minority of cells, SMAR1 and Cux colocalize to nuclear punctuate structures. As compared to a relatively homogenous distribution of SMAR1 (left panel), Cux distributes to nuclear dots (middle panel). This is reflected in a punctuate pattern for the colocalized fraction (right panel). (B) A minority of cells shows uniform nuclear distribution for Cux (middle) and SMAR1 (left); most of which (right panel) colocalizes. (C and D) In the majority (>90%) of cells, SMAR1 and Cux colocalize to the perinuclear region, regardless of whether the individual proteins accumulate in a uniform (C) or in a perinuclear (D) distribution.
SMAR1 interacts with Cux through the RS-rich domain
Since residues 160–350 of SMAR1 are sufficient for nuclear localization and Eβ repression, we carried out similar Cux colocalization experiments with a FLAG-tagged SMAR1 (160–350) truncation (Figure 7A and B). Virtually, every B16F1 cell cotransfected with Cux (green panels) and SMAR1 (160–350) (red panels) exhibited exclusive perinuclear colocalization (yellow panels of Figure 7A and B). Since the expression achieved for SMAR1 and SMAR1 (160–350) were similar (Figure 7C), it appears that, as with the transcription synergy results of Figure 6, the isolated RS domain containing fragment of SMAR1 is more efficient in driving the expressed protein to the nuclear envelope.
Figure 7.
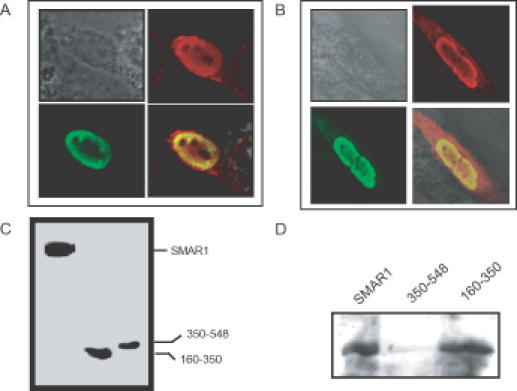
SMAR1 (160–350) interacts with Cux. (A and B) Immunofluorescence staining of B16F1 cells cotransfected with Cux and either Flag-tagged full-length SMAR1 or Flag-tagged SMAR1 truncations as indicated and described in Materials and Methods. The RS region (residues 160–350) of SMAR1 (red) and Cux (green) colocalize (yellow) within the perinuclear ring. (C) Western blot with anti-FLAG demonstrating expression of Flag-tagged SMAR1 truncations (160–350 and 350–548) along with full length FLAG–SMAR1 in total cell lysates prepared 48 h after transfection into B16F1 cells. (D) Wild-type (Flag–SMAR1) and Flag-SMAR1 (160–350) but not Flag-SMAR1 (350–548) immunoprecipitated with Cux. An aliquot of 2 ×10⁵ B16F1 cells were cotransfected with 1 μg of Cux and either of the Flag-tagged full-length SMAR1 or truncations. Total protein lysates were incubated with Flag-tagged beads and the pulled-down sample was immunoblotted with anti-Cux antibody as mentioned in Materials and Methods.
Nuclear colocalization of SMAR1 and Cux suggested that the two proteins might be physically interacting to regulate Eβ mediated transcription. Whole-cell lysates of B16F1 cells were prepared 48 h following transfection with Cux- and FLAG-tagged versions of either full-length or truncated SMAR1 expression constructs. Immunoblotting with anti-FLAG confirmed the expression of SMAR1 proteins (Figure 7C). The cell lysates were incubated with FLAG-tagged beads, then the bound proteins were eluted, fractionated on SDS–PAGE and western blotted with an anti-Cux antibody (Figure 7D). Consistent with our confocal results, full-length SMAR1 as well as the SMAR1 (160–350) truncation interacts with Cux (Figure 7D). A region from residues 350 to 548, which did not have an appreciable effect in the repression experiments, does not pull down Cux (Figure 7D). The immunofluorescence microscopy and pull-down studies together indicate that SMAR1 and Cux physically interact with each other and for this protein–protein interaction; the RS-rich domain of SMAR1 is essential.
Specific binding of SMAR1–Cux complex to MARβ
Previously, we demonstrated by South–western blotting that SMAR1 and Cux/CDP bind to the MARβ region (31). EMSA-super shift assays performed with mouse thymocyte nuclear extract had suggested that Cux specifically bound to that site (32). Analysis of the 170 bp sequence spanning MARβ identified a 37 bp core region of 100% ATC base composition—a characteristic feature of MARs. We have employed both the 37mer core and the 170 bp MARβ MAR sequences to confirm and extend these results with purified Cux and SMAR1 proteins. In line with our previous observation (32), GST–Cux protein binds specifically in a dose-dependent manner to the 170mer MARβ sequence (Figure 8A) and shows a strong binding affinity for the core 37mer MARβ region (Figure 8D, lanes 2–5). To determine the specificity of Cux/CDP binding, we examined if the complex was immunoreactive with anti-Cux/CDP antiserum. With increasing doses of antibody, the Cux/CDP complex was supershifted quantitatively (Figure 8B, lanes 1–5), whereas equivalent quantities of pre-immune serum produced no effect (data not shown). To further confirm the binding specificity, competition experiments were carried out with either the 170 bp MARβ-containing fragment or a fragment located 128 bp upstream (Figure 8C). High doses of the MARβ-containing competitor DNA completely abolished the nucleoprotein complex (Figure 8C, lanes 2–6), whereas the 128 bp upstream DNA gave no competition (Figure 8C, lanes 7–10).
Figure 8.
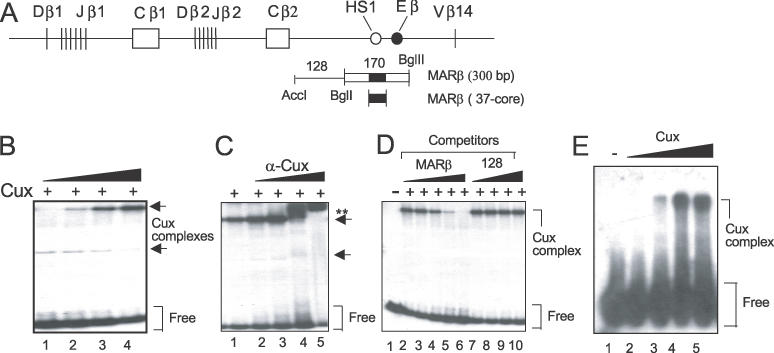
Cux directly binds to MARβ. (A) Schematic representation of the TCRβ locus showing HS1/MARβ along with the probes (numbers above represent base pairs; not drawn to scale) used for EMSA. Three probes were derived from a 780 bp BstXI–BglII fragment that encompasses HS1/MARβ. The core 37mer ATC-rich fragment resides within the 170 bp MARβ spanning fragment. (B) Ten nanograms of 32P-labeled 170 bp MARβ probe was incubated with increasing concentrations of GST–Cux protein in the presence of 1 μg of poly(dI–dC) and electrophoresed on a 5% polyacrylamide gel. The Cux–MARβ complexes and free probe are indicated. (C) The 170mer MARβ probe was incubated with 1 μg of GST–Cux and increasing amounts (0.25–2 μl) of anti-Cux/CDP antiserum (lanes 2–5). The super-shifted complex is denoted by double asterisks. (D) Competition assays were performed using either MARβ (lanes 2–6) or a 128 bp MARβ upstream fragment (lanes 7–10). Increasing amounts of unlabeled MARβ fragment results in the abolishment of the Cux complex (lane 6), whereas the 128 bp fragment did not compete for complex formation. (E) Ten nanograms of 32P-labeled 37mer core MARβ fragment was incubated with increasing amounts of GST–Cux protein (0.25–1.0 μg) (lanes 2–5). The arrow shows the Cux complex formed and the free probe is indicated.
GST–SMAR1 formed a single complex on the core 37mer in the presence of increasing amounts of the protein (Figure 9B, lanes 2–6), whereas the GST protein that was used as a negative control did not form any complex even at higher doses (Figure 9A, lanes 1–3). However, this binding was relatively weak compared to that of GST–Cux, indicating that SMAR1 might require additional DNA sequences within the 170 bp MARβ region for efficient binding. We utilized various truncated forms of SMAR1 to identify the region(s) required for 37mer binding (Figure 9C). The DNA-binding region of SMAR1 lies within residues 350–548 (Figure 9C, lanes 3 and 4) compared with SMAR1 (400–548) (Figure 9C, lanes 5 and 6). Thus the DNA-binding domain of SMAR1 is different from the protein–protein interaction domain (160–350 amino acids), which shows no binding (Figure 9C, lanes 1 and 2). The weak DNA-binding affinity observed for SMAR1 (400–548) suggests that a region from residues 350–400 is sufficient for full DNA binding. This extra 50 amino acids share homology with the MAR binding domains of both SATB1 and Cux (Figure 10B).
Figure 9.
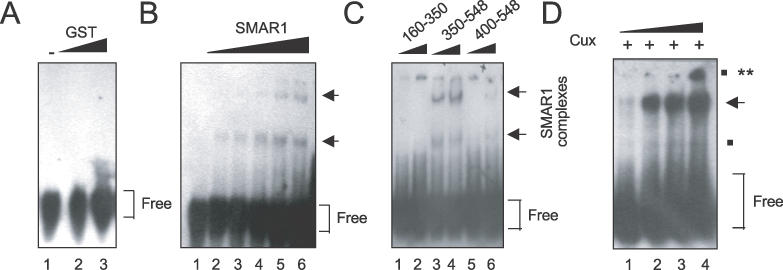
The minimal domain of SMAR1 that binds to MARβ. The labeled 37mer core oligo probe was incubated with increasing amounts (0.5 and 1.0 μg) of either GST (A) or GST–SMAR1 (B) proteins. The arrows indicate two specific complexes formed by SMAR1 (B). (C) The labeled 37mer core MARβ fragment was incubated with two concentrations (0.5 and 1.0 μg) of the indicated SMAR1 truncations. Compared to other truncations (lanes 1 and 2, 5 and 6), SMAR1 (350–548) binds with highest affinity to the 37mer MARβ probe (lanes 3 and 4). (D) The 37mer probe was incubated with 1 μg of SMAR1 and increasing amounts of Cux/CDP protein (0.25–1.0 μg). Upon increasing the concentration of Cux, a SMAR1–Cux–DNA ternary complex was formed as indicated by double asterisks.
EMSAs were performed to determine if SMAR1 and Cux/CDP form a ternary 37mer DNA-binding complex. In the presence of a constant amount of SMAR1 (1 μg) there was hardly any complex formed at the lowest amount (0.25 μg) of Cux/CDP (Figure 9D, lane 1). As the amount of Cux/CDP was increased, a SMAR1–Cux complex began to form (Figure 9D, lanes 2 and 3), and at the highest amount of Cux (1.0 μg), the ternary complex was evident (Figure 9D, lane 4). We conclude that both SMAR1 and Cux can bind together to sequences within the 37 bp ATC core of the MARβ silencers.
DISCUSSION
The TCRβ enhancer (Eβ) is critical for both transcription and V(D)J recombination that occurs during DN to DP transition. This complex process requires chromatin structure modulation so that the gene segments are made accessible to the recombinase machinery as well as to other factors involved in recombination (44). The Eβ enhancer is known to cross-talk with other cis-regulatory elements such as promoters and MARs as well as trans-acting factors that allow accessibility through chromatin remodeling (2,45). Thus, fine-tuning the regulation of the Eβ enhancer is critical for V(D)J recombination. Interestingly, the induction of the hypersensitive site HS1 (MARβ) at the TCRβ locus during DP stage is important for maintaining locus accessibility during V(D)J recombination (32).
Here, we showed that accessibility of MARβ as well as the Eβ enhancer is detected only in T cells and not in B cells, implying that the lineage-specific presence of these two cis-elements is critical for V(D)J rearrangement of TCRβ gene segments. Moreover, MARβ chromatin is modulated differentially during different stages of thymocyte development, but the locus is not accessible in peripheral T cells. Thus, chromatin remodeling at MARβ appears to be transient and stage-specific within a specific lymphoid lineage. Since MARβ functions as a transcriptional silencer (19), it is possible that MARβ along with its associated trans-acting factors might regulate V(D)J recombination through regulation of Eβ function. Interestingly, upon overexpression of the MARβ binding proteins, SMAR1 and Cux, together, HS1 (MARβ) is prominently induced in both T as well as non-T-cells. These results suggest that overexpression of SMAR1 and Cux modulate the chromatin at MARβ.
MARBPs are known to play significant roles in regulating transcription of antigen receptor gene loci through specific binding to their target MAR sequences. Some MARBPs, depending on the context, either function as transcriptional repressors or as activators. MARBPs such as Cux/CDP and SATB1 can function as transcriptional repressors in non-B-cells by interacting with their target MAR sequences flanking the IgH intronic enhancer (34,28). On the other hand, the MARBP Bright acts as a transcriptional activator in B cells (29), and this activation is context-dependent in that it requires an intact IgH enhancer core (30). MARβ, which resides at the 5′ end of the TCRβ enhancer (Eβ), is the docking site for three MARBPs—SMAR1, Cux and SATB1 (31). SMAR1 is a relatively recently characterized MARBP that was isolated from a murine DP thymocyte expression library using MARβ as a probe (31). This screen gave the first clue that Cux was also involved in MARβ function, as three of four clones identified were found to be alternatively spliced forms of SMAR1 and the fourth clone encoded the 3′ region of Cux (31). Subsequent expression studies (31) established that SMAR1 mRNA and protein accumulated maximally within DP thymocytes, providing a specific time and place for a biologically relevant role for SMAR1 in repression of Eβ-mediated V(D)J recombination at the DP stage of thymocyte development. Since two negative regulatory proteins Cux and SATB1 also bind to MARβ, we investigated their contribution in the context of SMAR1. Our results show that SMAR1 is a strong repressor of Eβ-mediated transcription. These results are consistent with our preliminary observation that transgenic mice expressing SMAR1 exhibit decreased Eβ-dependent transcription as well as severe perturbation in V(D)J recombination of commonly used Vβs (R. Kaul-Ghanekar et al., unpublished data). Thus, in addition to the previously identified cell cycle regulatory function for SMAR1 (33), upon binding to MARβ at the DP stage of thymocyte differentiation, SMAR1 negatively regulates Eβ enhancer function at the TCRβ locus.
We report, here, evidence that Cux also represses Eβ-mediated transcription and coexpression of SMAR1 and Cux results in a marked synergistic reduction of enhancer activity. On the other hand, SATB1, which also binds specifically to MARβ (19), neither represses Eβ independently nor cooperates with SMAR1 to enhance repression. While binding to MARβ is known to repress Eβ-mediated transcription in cultured cell lines, the targeted deletion of this region in mice had no apparent effect on transcription or V(D)J recombination of the TCRβ gene (19). The reason for this could be that after deletion of MARβ, the binding sites for the negative regulatory factors, SMAR1 and Cux, are lost, thereby eliminating the opportunity for these proteins to fine-tune transcription mediated by the enhancer. Thus, an orchestrated recruitment of at least two repressor proteins, SMAR1 and Cux/CDP, is required at the MARβ region to regulate Eβ function at the TCRβ locus. Cux/CDP is known to repress the transcription of its target genes either by interfering with the binding of transcriptional activators through competition for binding-site occupancy (37,46,47) or by recruiting HDACs through its C-terminal region (47,48). Therefore, SMAR1 repression might be mediated by recruiting HDACs, either directly or indirectly through interaction with Cux.
To delineate the core repressor domain within SMAR1, various truncated constructs of SMAR1 were generated. Among these, residues 160–350 exhibited maximum repressor activity both independently as well as in conjunction with Cux. Interestingly, this short truncated domain of SMAR1 is sufficient for direct interaction with Cux and for colocalization with Cux (in most cells) within the perinuclear space. Nuclear periphery and perinuclear localization of chromatin has been known to facilitate transcriptional silencing (49,50). The SMAR1 (160–350) domain lies within a central region of SMAR1 and is rich in RS residues that harbor the NLS (Figure 10A). There are reports suggesting that arginine richness exists in DNA- or RNA-binding domains of various factors, including HIV Tat and Rev (37). RS-domain-containing hnRNP proteins have been implicated as regulators of pre-mRNA splicing events (51). There are additional precedents for multiple regulatory functions of RS domains, and the RS domain of SMAR1 provides a potentially novel one for TCRβ gene regulation. It provides not only a prototypic NLS function for SMAR1, but may also modulate intra-nuclear localization within a region of the nuclear periphery associated with heterochromatin (49,50).
Finally, our results demonstrate that the protein–protein (RS) and DNA–protein interaction domains of SMAR1 can function independently; the former, SMAR1 (160–350), being essential for interaction with Cux, and the latter, SMAR1 (350–548), forming a complex with MARβ DNA. Interestingly, the DNA-binding domain of SMAR1 has significant homology with the MAR binding domains of Cux and SATB1 (31) (Figure 10B). The core 37mer G-less region within the 170 bp MARβ DNA exhibits stronger affinity for Cux than SMAR1 suggesting that SMAR1 requires a larger DNA scaffold for attachment. At increased protein concentrations, significant DNA–protein as well as protein–protein interactions are observed. This is consistent with our findings that overexpression of SMAR1 and Cux results in prominent induction of MARβ DNaseI hypersensitivity in T- as well as non-T-cells. Together, these data provide compelling evidence that SMAR1 and Cux must interact and bind in concert to the MARβ region in order to negatively regulate the transcriptional activity of the Eβ. We anticipate, therefore, that a SMAR1–Cux ternary complex with MARβ may regulate T cell development by controlling V(D)J recombination via regulation of Eβ enhancer. It will be informative to identify additional molecular partners that associate with SMAR1 and Cux to fine-tune the regulation of Eβ-mediated transcription and V(D)J recombination.
Acknowledgments
ACKNOWLEDGEMENTS
We thank our Director, Dr G. C. Mishra, for his generous support to carry out the experiments. Funding from the Department of Biotechnology and Department of Science and Technology, New Delhi, India and the NIH, USA, supported the work. For confocal imaging, we thank Ms Ashwini Atre and Dr M. V. Krishnashastry. The SATB1 construct was a kind gift from Dr Richard H. Scheuermann.
REFERENCES
- 1.Okada A. and Alt,F.W. (1994) Mechanisms that control antigen receptor variable region gene assembly. Semin. Immunol., 6, 185–196. [DOI] [PubMed] [Google Scholar]
- 2.Sleckman B.P., Gorman,J.R. and Alt,F.W. (1996) Accessibility control of antigen-receptor variable-region gene assembly: role of cis-acting elements. Annu. Rev. Immunol., 14, 459–481. [DOI] [PubMed] [Google Scholar]
- 3.Krangel M.S., Hernandez-Munain,C., Lauzurica,P., McMurry,M., Roberts,J.L. and Zhong,X.P. (1998) Developmental regulation of V(D)J recombination at the TCR alpha/delta locus. Immunol. Rev., 165, 131–147. [DOI] [PubMed] [Google Scholar]
- 4.Whitehurst C.E., Chattopadhyay,S. and Chen,J. (1999) Control of V(D)J recombinational accessibility of the D beta 1 gene segment at the TCR beta locus by a germline promoter. Immunity, 10, 313–322. [DOI] [PubMed] [Google Scholar]
- 5.Bories J.C., Demengeot,J., Davidson,L. and Alt,F.W. (1996) Gene-targeted deletion and replacement mutations of the T-cell receptor β-chain enhancer: the role of enhancer elements in controlling V(D)J recombination accessibility. Proc. Natl Acad. Sci. USA, 93, 7871–7876. [DOI] [PMC free article] [PubMed] [Google Scholar]
- 6.Bouvier G., Watrin,F., Naspetti,M., Verthuy,C., Naquet,P. and Ferrier,P. (1996) Deletion of the mouse T-cell receptor β gene enhancer blocks αβ T-cell development. Proc. Natl Acad. Sci. USA, 93, 7877–7881. [DOI] [PMC free article] [PubMed] [Google Scholar]
- 7.Mathieu N., Hempel,W.M., Spicuglia,S., Verthuy,C. and Ferrier,P. (2000) Chromatin remodeling by the T cell receptor (TCR)-beta gene enhancer during early T cell development: implications for the control of TCR-beta locus recombination. J. Exp. Med., 192, 625–636. [DOI] [PMC free article] [PubMed] [Google Scholar]
- 8.Capone M., Watrin,F., Fernex,C., Horvat,B., Krippl,B., Wu,L., Scollay,R. and Ferrier,P. (1993) TCRβ and TCRα gene enhancers confer tissue- and stage- specificity on V(D)J recombination. EMBO J., 12, 4335–4346. [DOI] [PMC free article] [PubMed] [Google Scholar]
- 9.Okada A., Mendelsohn,M. and Alt,F.W. (1994) Differential activation of transcription versus recombination of transgenic T cell receptor beta variable region gene segments in B and T lineage cells. J. Exp. Med., 180, 261–272. [DOI] [PMC free article] [PubMed] [Google Scholar]
- 10.Hesslein D.G. and Schatz,D.G. (2001) Factors and forces controlling V(D)J recombination. Adv. Immunol., 78, 169–232. [DOI] [PubMed] [Google Scholar]
- 11.Blasquez V.C., Sperry,A.O., Cockerill,P.N. and Garrard,W.T. (1989) Protein:DNA interactions at chromosomal loop attachment sites. Genome, 31, 503–509. [DOI] [PubMed] [Google Scholar]
- 12.Berezney R. and Coffey,D.S. (1974) Identification of a nuclear protein matrix. Biochem. Biophys. Res. Commun., 60, 1410–1417. [DOI] [PubMed] [Google Scholar]
- 13.Gasser S.M. and Laemmli,U.K. (1987) A glimpse at chromosomal order. Trends Genet., 3, 16–22. [Google Scholar]
- 14.Cockerill P.N. and Garrard,W.T. (1986) Chromosomal loop anchorage of the kappa immunoglobulin gene occurs next to the enhancer in a region containing topoisomerase II sites. Cell, 44, 273–282. [DOI] [PubMed] [Google Scholar]
- 15.Cockerill P.N. (1990) Nuclear matrix attachment occurs in several regions of the IgH locus. Nucleic Acids Res., 18, 2643–2648. [DOI] [PMC free article] [PubMed] [Google Scholar]
- 16.Cockerill P.N., Yuen,M.H. and Garrard,W.T. (1987) The enhancer of the immunoglobulin heavy chain locus is flanked by presumptive chromosomal loop anchorage elements. J. Biol. Chem., 262, 5394–5397. [PubMed] [Google Scholar]
- 17.Webb C.F., Das,C., Eneff,K.L. and Tucker,P.W. (1991) Identification of a matrix-associated region 5′ of an immunoglobulin heavy chain variable region gene. Mol. Cell. Biol., 11, 5206–5211. [DOI] [PMC free article] [PubMed] [Google Scholar]
- 18.Zhong X.P., Carabana,J. and Krangel,M.S. (1999) Flanking nuclear matrix attachment regions synergize with the T cell receptor delta enhancer to promote V(D)J recombination. Proc. Natl Acad. Sci. USA, 96, 11970–11975. [DOI] [PMC free article] [PubMed] [Google Scholar]
- 19.Chattopadhyay S., Whitehurst,C., Schwenk,F. and Chen,J. (1998) A nuclear matrix attachment region upstream of the T cell receptor beta gene enhancer binds Cux/CDP and SATB1 and modulates enhancer-dependent reporter gene expression but not endogenous gene expression. J. Biol. Chem., 273, 29838–29846. [DOI] [PubMed] [Google Scholar]
- 20.Banan M., Rojas,I.C., Lee,W.H., King,H.L., Harris,J.V., Kobayashi,R., Webb,C.F. and Gottlieb,P.D. (1997) Interaction of the nuclear matrix-associated region (MAR)-binding proteins, SATB1 and CDP/Cux, with a MAR element (L2a) in an upstream regulatory region of the mouse CD8a gene. J. Biol. Chem., 272, 18440–18452. [DOI] [PubMed] [Google Scholar]
- 21.Rampalli S., Kukarni,A., Kumar,P., Mogare,D., Galande,S., Mitra,D. and Chattopadhyay,S. (2003) Stimulation of Tat-independent transcriptional processivity from the HIV-1 LTR promoter by matrix attachment regions. Nucleic Acids Res., 31, 3248–3256. [DOI] [PMC free article] [PubMed] [Google Scholar]
- 22.Wang Z., Goldstein,A., Zong,R.T., Lin,D., Neufeld,E.J., Scheuermann,R.H. and Tucker,P.W. (1999) Cux/CDP homeoprotein is a component of NF-muNR and represses the immunoglobulin heavy chain intronic enhancer by antagonizing the bright transcription activator. Mol. Cell. Biol., 19, 284–295. [DOI] [PMC free article] [PubMed] [Google Scholar]
- 23.Imler J.L., Lemaire,C., Wasylyk,C. and Wasylyk,B. (1987) Negative regulation contributes to tissue specificity of the immunoglobulin heavy-chain enhancer. Mol. Cell. Biol., 7, 2558–2567. [DOI] [PMC free article] [PubMed] [Google Scholar]
- 24.Weinberger J., Jat,P.S. and Sharp,P.A. (1988) Localization of a repressive sequence contributing to B-cell specificity in the immunoglobulin heavy-chain enhancer. Mol. Cell. Biol., 8, 988–992. [DOI] [PMC free article] [PubMed] [Google Scholar]
- 25.Scheuermann R.H. and Chen,U. (1989) A developmental-specific factor binds to suppressor sites flanking the immunoglobulin heavy-chain enhancer. Genes Dev., 3, 1255–1266. [DOI] [PubMed] [Google Scholar]
- 26.Genetta T., Ruezinsky,D. and Kadesch,T. (1994) Displacement of an E-box-binding repressor by basic helix–loop–helix proteins: implications for B-cell specificity of the immunoglobulin heavy-chain enhancer. Mol. Cell. Biol., 14, 6153–6163. [DOI] [PMC free article] [PubMed] [Google Scholar]
- 27.Dickinson L.A., Joh,T., Kohwim,Y. and Kohwi-Shigematsu,T. (1992) A tissue-specific MAR/SAR DNA-binding protein with unusual binding site recognition. Cell, 70, 631–645. [DOI] [PubMed] [Google Scholar]
- 28.Kohwi-Shigematsu T., Maass,K. and Bode,J. (1997) A thymocyte factor SATB1 suppresses transcription of stably integrated matrix-attachment region-linked reporter genes. Biochemistry, 36, 12005–12010. [DOI] [PubMed] [Google Scholar]
- 29.Herrscher R.F., Kaplan,M.H., Leslz,D.L., Das,C., Scheuermann,R.H. and Tucker,P.W. (1995) The immunoglobulin heavy-chain matrix-associating regions are bound by Bright: a B cell-specific trans-activator that describes a new DNA-binding protein family. Genes Dev., 9, 3067–3082. [DOI] [PubMed] [Google Scholar]
- 30.Kaplan M.H., Zong,R.T., Herrscher,R.F., Scheuermann,R.H. and Tucker,P.W. (2001) Transcriptional activation by a matrix associating region-binding protein. Contextual requirements for the function of bright. J. Biol. Chem., 276, 21325–21330. [DOI] [PubMed] [Google Scholar]
- 31.Chattopadhyay S., Kaul,R., Charest,A., Housman,D. and Chen,J. (2000) SMAR1, a novel, alternatively spliced gene product, binds the scaffold/matrix-associated region at the T cell receptor beta locus. Genomics, 68, 93–96. [DOI] [PubMed] [Google Scholar]
- 32.Chattopadhyay S., Whitehurst,C., Schwenk,F. and Chen,J. (1998) Biochemical and functional analyses of chromatin changes at the TCR-beta gene locus during CD4−CD8− to CD4+CD8+ thymocyte differentiation. J. Immunol., 160, 1256–1267. [PubMed] [Google Scholar]
- 33.Kaul R., Mukherjee,S., Ahmed,F., Bhat,M.K., Chhipa,R., Galande,S. and Chattopadhyay,S. (2003) Direct interaction with and activation of p53 by SMAR1 retards cell-cycle progression at G2/M phase and delays tumor growth in mice. Int. J. Cancer, 103, 606–615. [DOI] [PubMed] [Google Scholar]
- 34.Zong R.T. and Scheuermann,R.H. (1995) Mutually exclusive interaction of a novel matrix attachment region binding protein and the NF-muNR enhancer repressor. Implications for regulation of immunoglobulin heavy chain expression. J. Biol. Chem., 270, 24010–24018. [DOI] [PubMed] [Google Scholar]
- 35.Liu J., Barnett,A., Neufeld,E.J. and Dudley,J.P. (1999) Homeoproteins CDP and SATB1 interact: potential for tissue-specific regulation. Mol. Cell. Biol., 19, 4918–4926. [DOI] [PMC free article] [PubMed] [Google Scholar]
- 36.Nepveu A. (2001) Role of the multifunctional CDP/Cut/Cux homeodomain transcription factor in regulating differentiation, cell growth and development. Gene, 270, 1–15. [DOI] [PubMed] [Google Scholar]
- 37.Dynan W.S. (1989) Modularity in promoters and enhancers. Cell, 58, 1–4. [DOI] [PubMed] [Google Scholar]
- 38.Barberis A., Superti-Furga,G. and Busslinger,M. (1987) Mutually exclusive interaction of the CCAAT-binding factor and of a displacement protein with overlapping sequences of a histone gene promoter. Cell, 50, 347–359. [DOI] [PubMed] [Google Scholar]
- 39.Nirodi C., Hart,J., Dhawan,P., Moon,N.S., Nepveu,A. and Richmond,A. (2001) The role of CDP in the negative regulation of CXCL1 gene expression. J. Biol. Chem., 276, 26122–26131. [DOI] [PMC free article] [PubMed] [Google Scholar]
- 40.O'Connor M.J., Stunkel,W., Koh,C.H., Zimmermann,H. and Bernard,H.U. (2000) The differentiation-specific factor CDP/Cut represses transcription and replication of human papillomaviruses through a conserved silencing element. J. Virol., 74, 401–410. [PMC free article] [PubMed] [Google Scholar]
- 41.Stunkel W., Huang,Z., Tan,S.H., O'Connor,M.J and Bernard,H.U. (2000) Nuclear matrix attachment regions of human papillomavirus type 16 repress or activate the E6 promoter, depending on the physical state of the viral DNA. J. Virol., 74, 2489–2501. [DOI] [PMC free article] [PubMed] [Google Scholar]
- 42.Wu F. and Lee,A.S. (2002) CDP and AP-2 mediated repression mechanism of the replication-dependent hamster histone H3.2 promoter. J. Cell Biochem., 84, 699–707. [DOI] [PubMed] [Google Scholar]
- 43.Fujii Y., Kumatori,A. and Nakamura,M. (2003) SATB1 makes a complex with p300 and represses gp91(phox) promoter activity. Microbiol. Immunol., 47, 803–811. [DOI] [PubMed] [Google Scholar]
- 44.Jung D. and Alt,F.W. (2004) Unraveling V(D)J recombination; insights into gene regulation. Cell, 116, 299–311. [DOI] [PubMed] [Google Scholar]
- 45.Hempel W.M., Leduc,I., Mathieu,N., Tripathi,R.K. and Ferrier,P. (1998) Accessibility control of V(D)J recombination: lessons from gene targeting. Adv. Immunol., 69, 309–52. [DOI] [PubMed] [Google Scholar]
- 46.Skalnik D.G., Strauss,E.C. and Orkin,S.H. (1991) CCAAT displacement protein as a repressor of the myelomonocytic-specific gp91-phox gene promoter. J. Biol. Chem., 266, 16736–16744. [PubMed] [Google Scholar]
- 47.Mailly F., Berube,G., Harada,R., Mao,P.L., Phillips,S. and Nepveu,A. (1996) The human cut homeodomain protein can repress gene expression by two distinct mechanisms: active repression and competition for binding site occupancy. Mol. Cell. Biol., 16, 5346–5357. [DOI] [PMC free article] [PubMed] [Google Scholar]
- 48.Li S., Moy,L., Pittman,N., Shue,G., Aufiero,B., Neufeld,E.J., LeLeiko,N.S. and Walsh,M.J. (1999) Transcriptional repression of the cystic fibrosis transmembrane conductance regulator gene, mediated by CCAAT displacement protein/cut homolog, is associated with histone deacetylation. J. Biol. Chem., 274, 7803–7815. [DOI] [PubMed] [Google Scholar]
- 49.Cockell M. and Gasser,S.M. (1999) Nuclear compartments and gene regulation. Curr. Opin. Genet. Dev., 9, 199–205. [DOI] [PubMed] [Google Scholar]
- 50.Futaki S., Suzuki,T., Ohashi,W., Yagami,T., Tanaka,S., Ueda,K. and Sugiura,Y. (2001) Arginine-rich peptides. An abundant source of membrane-permeable peptides having potential as carriers for intracellular protein delivery. J. Biol. Chem., 276, 5836–5840. [DOI] [PubMed] [Google Scholar]
- 51.Yun C.Y., Velazquez-Dones,A.L., Lyman,S.K. and Fu,X.D. (2003) Phosphorylation-dependent and -independent nuclear import of RS domain-containing splicing factors and regulators. J. Biol. Chem., 278, 18050–18055. [DOI] [PubMed] [Google Scholar]