Abstract
Human angiotensin type 1 receptor (hAT1R) gene is regulated by hormones, second messengers, and both pathophysiological and developmental states. The focus of the present study was to determine the role of glucose in the trans-repression of hAT1R gene transcription and to identify the functional cis-acting response element(s). Serial deletions of the hAT1R promoter region indicated that an area between –1717 and –1543 base pairs upstream of the 5′ end of the cDNA sequence has a glucose responsive regulatory element (GluRE) to down-regulate the gene expression. Further analysis revealed a putative 29-bp (5′-AACTGATTTTTGTATATTGATCTTGTATT-3′) repressor element located between –1582 and -1610 bp was necessary for transcriptional repression. Removal of this region from promoter construct abolished repression of the hAT1R gene transcription in human proximal tubule epithelial cells (hPTECs). Using mobility shift assays, we demonstrated DNA binding activity to the labeled repressor element in hPTEC nuclear extracts. Additional studies demonstrated increased DNA binding activity to the labeled repressor element in nuclear extracts treated with high glucose (25 mM). Southwestern analysis identified two GluRE binding proteins of 34 and 36 kDa in glucose-treated extracts. Glucose-induced activity of the repressor trans-acting factor(s) reached a maximum at 4 h, which correlated with decreased transcriptional activity of the hAT1R gene, suggesting that glucose can down-regulate the transcription of the hAT1R gene through the repressor element. Furthermore, insertion of the glucose response element into heterologous SV40 promoter (SV40) chloramphenicol acetyl transferase (CAT) vector showed orientation/distance-independent repression of SV40 promoter-mediated CAT activity in hPTECs. Our results show that the glucose response factor(s) acts as trans-acting factor(s) binding to the cis-acting repressor element in the hAT1R promoter, which may participate in the control of basal transcription as well as glucose-mediated transcriptional inhibition of the hAT1R gene.
INTRODUCTION
Circulating and locally produced angiotensin II (AngII) through specific G protein-coupled receptors controls a diverse array of processes, including the maintenance of blood pressure, fluid and electrolyte balance, regulation of cell growth, and neuromodulatory functions (reviewed in Raizada et al., 1993; Berk and Corson, 1997). In humans, there are at least two pharmacologically distinct cell surface receptors, angiotensin type 1 (AT1) and type 2 (AT2), with opposing functions (Gelband et al., 1997). In the adult kidney, the AT1 receptors seem to be responsible for most known effector-coupled responses described to date (Kim and Iwao, 2000; Brewster et al., 2003). Angiotensin II affects efferent and afferent arteriole vasoconstriction, increases glomerular filtration rate and renal blood flow, tubulointerstitial hypertrophy and hyperplasia, and renin and mineral-corticoid release (Wolf and Neilson, 1991, 1993). Angiotensin II also has been shown to be a principal regulator of sodium reabsorption both in the proximal and distal tubules (Thekkumkara et al., 1998). The above-mentioned actions, taken together, indicate that AngII is an important modulator of renal function. Therefore, factors or events that alter AT1 receptor gene expression will disrupt normal renal function.
Diabetic nephropathy is one of the leading causes of morbidity and mortality in insulin-dependent diabetes mellitus (Berneger et al., 1994; Ibrahim and Hostetter, 1997). Hyperglycemia and/or insulin deficiency plays an important role in the pathogenesis of diabetic nephropathy. The clinical manifestations of diabetic nephropathy include microalbuminuria, which is followed by hypertension, nephrotic syndrome, and end-stage renal disease. In addition, several systemic and intrarenal networks of hormones, cytokines, and growth factors are functionally altered by diabetes. Angiotensin II has shown to be involved in several forms of clinical and experimental diabetic nephropathy and hypertension (Whiteside and Thompson, 1989; Bakris, 1993; KaLinyak el al., 1993; Ross and Rennke, 1994; Ibrahim and Hostetter, 1997). Angiotensin II is especially relevant to diabetes mellitus because studies in diabetic patients and experimental animals show that angiotensin-converting enzyme (ACE) treatment significantly inhibits the progression of diabetic nephropathy (Bakris, 1993; Lewis el al., 1993). Furthermore, blockade of AT1 receptors with receptor-specific antagonists reduced renal complications of diabetes in experimental animals (Remuzzi et al., 1993). Thus, it is hypothesized that AngII through the AT1 receptor promotes the progression of diabetes-induced nephropathy in patients and experimental animal models. However, in the proximal tubule AT1 receptors are down-regulated from the early onset to the end-stage of diabetic nephropathy (Cheng et al., 1994).
We hypothesized that in normal physiology, hAT1R expression is achieved by a fine interplay between insulin and glucose on hAT1R gene transcription. Alternatively, in pathophysiology such as diabetes, when extracellular glucose levels are high due to insulin deregulation, the equilibrium interaction between glucose and insulin will shift, resulting in decreased expression of hAT1R gene. How these factors control hAT1R gene expression is not clear. In untreated diabetes mellitus, several studies demonstrated an increase in the steady-state mRNA levels of AT1 receptor and hormone-receptor binding in heart and systemic and a decrease in kidney (Sechi et al., 1994, Brown et al., 1997), suggesting kidney-specific regulation of the receptor. Insulin treatment of diabetic rats reversed these abnormalities. The functional significance of AT1 receptor down-regulation in the kidney is not known. Moreover, despite the fact that renal AT1 receptor expression is decreased, the renal protective effects of ACE inhibition and hAT1R antagonists strongly suggest that AngII function through AT1 receptor activation contributes to diabetes mellitus-induced renal failure. These enigmatic observations are not easily explained. Understanding the mechanisms responsible for the unique regulatory properties of the hAT1R gene in the kidney will require a detailed analysis of the structural and functional properties of the promoter region of the receptor gene. Although it has been suggested that multiple transcriptional factors may be involved in the regulation of the hAT1R, recently we have identified an insulin/growth hormone-induced transcriptional enhancer region upstream of the hAT1R gene promoter (Wyse et al., 2000). In the present study, we identified a glucose-mediated transcriptional repressor element and demonstrated that high glucose alters the rate of transcription by interacting with glucose inducible nuclear trans-acting factor(s). Our observation is the first evidence that transcriptional regulation of the hAT1R gene in the renal proximal tubule is controlled by cross talk between glucose and insulin through selective recognition by specific nuclear binding proteins.
MATERIALS AND METHODS
Materials
The human proximal tubule cell line (hPTEC) was kindly provided by Dr. Lorraine Racusen (The John Hopkins University School of Medicine, Baltimore, MD). DMEM, penicillin, streptomycin, and trypsin/EDTA were from Sigma-Aldrich (St. Louis, MO). MacVector 7.0 sequencing software was from Accelrys (San Diego, CA). GraphPad Prism statistical analysis software was from GraphPad Software (San Diego, CA). Tube-O-Dialyzer was from Geno-Technology (St. Louis, MO). [α-32P]dTTP were from PerkinElmer Life and Analytical Sciences (Boston, MA). pCAT reporter plasmid, pCAT SV40-promoter plasmid, and pSV-β-galactosidase expression plasmids and all restriction enzymes were from Promega (Madison, WI). Exonuclease-free Klenow and Sephadex G-50 columns were from Amersham Biosciences AB (Uppsala, Sweden). Chemicals and electrophoresis reagents were from Bio-Rad (Richmond, CA). Taq polymerase was from Roche Diagnostics (Indianapolis, ID). Oligonucleotides were obtained from Integrated DNA Technology (Coralville, IA).
Construction of Expression Plasmids
Isolation of the genomic clone consisting of the human angiotensin type 1 receptor promoter and subcloning into pBluescript II KS vector was described previously (Wyse et al., 2000). All DNA manipulations were carried out using standard techniques. By using the genomic clone as a template for polymerase chain reaction (PCR) and oligonucleotides corresponding the published sequence of the hAT1R promoter (Guo et al., 1994), fragments of varying length were amplified. The oligonucleotide corresponding to exon 1 (+49 to +7 base pairs) of the hAT1R (5′-CCGCCGCGGCCCGGCAGAGCTG-3′) was used as the antisense primer for each reaction. The varying sense primers (hP1, 5′-GAGGCAGGGAGAGGACACAGACC-3′; hP2, 5′-TAATTAATTGATTCCTTAGGGCT-3′; hP3, 5′-GTCCAATTGCCCTCACTAGAACC-3′; hP4, 5′-GAGGAAGTTCCTATTCCTAGTTT-3′; and hP5, 5′-AATCTAATCTTGCTTTCTGGCATC-3′) yielded fragments of 1717, 1543, 1438, 1278, and 800 base pairs, respectively. Each fragment was cloned into the EcoR V site of pBluescript II KS (Stratagene, La Jolla, CA). To excise the promoter fragments from pBluescript, clones were digested with SalI and XbaI. The released fragments were subsequently inserted into the pCAT-Basic expression plasmid. To generate additional deletion fragments between –1717 and –1543 base pairs, PCR was performed using an antisense primer corresponding –750 base pairs and –771 base pairs (5′-GACTATACACCATGGTCAAGTG-3′) spanning the unique NcoI site and varying sense primers (hP2-1, 5′-ATGCGTCGACGTGGTGAGAAGCC-3′; hP2-2, 5′-ATGCGTCGACTTAATTCCATTTGTTG-3′; and hP2-3, 5′-ATGCGTCGACAACTGATTTTTGTATATTG-3′). Each PCR-amplified fragment and hP1-Bluescript (the pBluescript plasmid containing the –1717-base pairs promoter sequence) were restriction digested with NcoI and SalI and unidirectionally subcloned into the NcoI SalI site in the hP1-Bluescript. The resulting promoter fragments of –1653, -1609, and -1579 base pairs in pBluecript were further restriction digested with XbaI and SalI and inserted into basic pCAT expression plasmid. To insert hAT1R glucose response element (GluRE) sequence downstream of the heterologous SV40 promoter, chloramphenicol acetyl transferase (CAT) vector oligonucleotides were synthesized with XbaI and SalI linker sequences to allow unidirectional insertion. The double-stranded GluRE-containing sequence with linkers was generated by annealing two oligonucletides (forward orientation: sense primer, 5′-CTAGAACTGATTTTTGTATATTGATCTTGTATTG-3′; antisense primer, 5′-TCGACAATACAAGATCAATATACAAAAATCAGTT-3′ and reverse orientation: sense primer, 5′-CTAGATTATGTTCTAGTTATATGTTTTT AGTCAAG-3′; antisense primer, 5′-TCGACTTGACTAAAAACATATAACTAGAAC ATAAT-3′) The double-stranded GluRE was restriction digested with XbaI and SalI, and inserted into pCAT-Promoter (downstream of the reporter CAT gene). The authenticity of clones was confirmed by dideoxy sequencing as described previously (Wyse et al., 2000).
Cell Culture and Transfection of Reporter Gene Constructs
The hPTEC cells were maintained in a 1:1 mixture of DMEM/Ham's F-12 nutrient mixture (DMEM/F-12) containing 5% fetal bovine serum, 50 units/ml penicillin, and 100 μg/ml streptomycin (complete medium) as described previously (Wyse et al., 2000). For transient transfection of DNA constructs, hPTECs were seeded in six-well plates and grown to 70–80% confluence in complete medium. Cells were transiently transfected with 2 μg of reporter plasmids and cotransfected with 2 μg of pSV-β-galactosidase expression construct (to act as an internal control for transfection efficiency) by using the Trans-IT reagent method according to manufacturers instructions (Mirrus, PanVera, Madison, WI) and grown for 24 h in complete medium.
CAT Assay
The CAT assays were performed as described previously (Wyse et al., 2000). Briefly, transfected cells were growth arrested in glucose- and insulin-free DMEM medium with 1% fetal bovine serum for 24 h and stimulated with normal glucose (5.5 mM) or high glucose (25 mM). After 24 h, cells were rinsed with phosphate-buffered saline (PBS) three times and harvested in the same buffer. Cells were then centrifuged and the resultant pellet was resuspended in 100 μl of 0.25 M Tris-HCl, pH 7.8. Cellular extracts were prepared by bath sonication at 4°C and 10-min centrifugation (17,530 × g at 4°C). Thirty microliters of the supernatant was removed and β-galactosidase activity was measured using a colorimetric assay according to the previously published method (Wyse et al., 2000). The remaining supernatant was heated at 70°C for 10 min to inactivate endogenous acetylases and centrifuged further to remove cell debris. The assay for CAT activity was performed as described previously (Wyse et al., 2000). The radioactivity was visualized by autoradiography and its intensity of density quantified by image analysis. The results are expressed as normalized values to β-galactosidase activity.
Preparation of hPTEC Cytoplasmic and Nuclear Extracts
Initially, cells were grown to 80–90% confluence in complete medium containing 5% fetal bovine serum, 50 U/ml penicillin, and 100 μg/ml streptomycin. Twenty-four hour growth-arrested cells in RPMI medium (without glucose) were stimulated with normal or high glucose for indicated times. Alternatively, high glucose-treated cells were primed with cyclohexamide (1 μg/ml) for 15 min. Cells were rinsed two times with PBS, scraped into PBS without Mg2+ and Ca2+ (pH 7.4), and cytosolic and nuclear extracts were prepared as described previously (Wyse et al., 2000). Briefly, harvested cells were centrifuged at 650 × g for 10 min at 4°C, and cell pellets were resuspended in ice-cold hypotonic buffer containing 10 mM HEPES, 10 mM KCl, 1.5 mM MgCl2, and 0.5 mM dithiothreitol (DTT) supplemented with protease inhibitors (Complete Mini protease inhibitor mixture tablets, EDTA-free; Roche Diagnostics). The cells were Dounce homogenized (14 strokes) and centrifuged at 1000 × g for 10 min at 4°C. The supernatant, cytoplasmic extract was stored at -70°C for later use, and the pellet was resuspended in high-salt buffer containing 20 mM HEPES, 25% glycerol, 400 mM NaCl, and 1 mM EDTA supplemented with protease inhibitors. The high salt nuclear extract was dialyzed (membrane molecular weight cut-off of 8 kDa) overnight in a buffer containing 20 mM Tris-HCl, pH 7.9, 0.1 M KCl, 0.2 mM EDTA, 0.5 mM DTT, 20% glycerol, and 50 μg/ml phenylmethylsulfonyl fluoride (PMSF). Protein concentration was determined using Bio-Rad protein assay reagent based on Bradford method (Bradford, 1976), and extracts were stored at -70°C for later use.
Electrophoretic Mobility Shift Assay
Mobility shift assays were performed as described previously (Wyse et al., 2000). A double-stranded GluRE-containing sequence with a 5′ overhang was generated by annealing two oligonucleotides (sense primer, 5′-AACTGATTTTTGTATATTGATCTTGTA-3′; antisense primer, 5′-AATACAAGATCAATATACAAAAATCAG-3′) at 65°C. The double-stranded GluRE was labeled by filling the overhang with DNA polymerase Klenow in the presence of [α-32P]dTTP. The labeled probe was purified using a Sephadex G-25 column. Nuclear extracts were preincubated with 2 μg of poly(dI-dC) in a total volume of 20 μl of binding buffer comprising of 0.1 M Tris-HCl, 50% glycerol, 0.2 M KCl, 0.5 M EDTA, and 1.0 M DTT at 22°C for 20 min. In addition, the reaction mixture was supplemented with either proteinase K, varying concentrations (0–50-fold excess) of double-stranded, unlabeled GluRE; 50-fold excess of nonspecific double-stranded GAGA probe (5′-GAGAGGGAGGAG-3′); or 50-fold excess of unlabeled mutant GluRE (M1, 5′-ACAGAATTTTTGTATATTGATCTTGTATT-3′; M2 5′-AACTGAGGGGTGATAT TGATCTTGTATT-3′; M3, 5′-AACTGATTTTTGGCGCTTGATCTTGTATT-3′; M4, 5′-AACTGATTTTTGTATATTGAGAGGGTATT-3′; M5, 5′-ACAGAAGGGGTGTTATTGATCTTGTATT-3′; M6, 5′-AACTGATTTTTGGCGCTTGAGAGGGTATT-3′ and M7, 5′-AACTGATTTTTGTAGCGGGATCTTGGCGG-3′). Then, the labeled probe (400,000 cpm) was added and the reaction mixture further incubated for 30 min at 22°C. Complexes were separated on a 4% native polyacrylamide gel containing 0.5× Tris borate-EDTA buffer (25 mM Tris, 25 mM boric acid, and 0.5 mM EDTA). The gels were run at 240 V at 4°C, dried, and exposed to Kodak XR-film at -70°C with intensifying screens.
Southwestern Analysis
Southwestern analysis was performed as described previously (Wyse et al., 2000) by separating nuclear proteins on an 8% SDS-polyacrylamide gel and electrophoretically transferring them to a nitrocellulose membrane. The membrane was rinsed in PBS, prehybridized in buffer containing 10 mM Tris-HCl (pH 8.0), 50 mM KCl, 1 mM EDTA, 1 mM DTT, 5% glycerol, 0.5 mM PMSF, and 500 ng/ml salmon sperm DNA for 30 min at 22°C. Membrane was hybridized in the same buffer containing [α-32P]dTTP-labeled GluRE probe (2.5 × 10⁶ cpm/10 ml of buffer) for 45 min at 22°C. Nonspecific binding was removed by adding 2 U of DNase I for 15 in at 37°C. The membrane was washed twice in PBS at 22°C and exposed to XR-film at -70°C with intensifying screen.
Computer and Statistical Analysis
Sequence analyses and alignments were performed using MacVector 7.0 sequence analysis software. Transcription factors search and analysis were performed using TESS (Transcription Element Search Software) on the World Wide Web (http://www.cbil.upenn.edu.tess/index.html). Statistical significance between two experimental groups was analyzed with the computer software GraphPad Prism by using Student's t test for unpaired samples. The values presented are mean ± SEM, and p <0.05 was considered to be significant.
RESULTS
Measurement of Glucose-mediated hAT1R Transcription
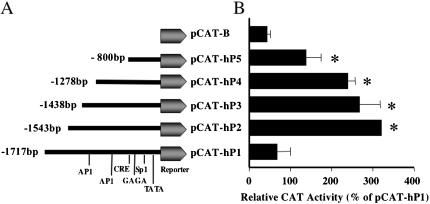
When the angiotensin receptor gene was cloned, gene expression studies revealed that in most tissues, including the kidney, the receptor transcripts express at very low levels (Burson et al., 1994). In this study, we investigated the involvement of the –1717 to +70-base pair promoter sequence in the regulation of the hAT1R gene transcription. Functional analysis of the hAT1R gene transcriptional repressor unit was performed using a reporter gene assay, which relies on the linkage of putative regulatory sequences to a reporter CAT gene, whose transcription is detected after transfection into hPTECs. To define the role of specific DNA sequences within this region, various-sized deletion fragments were made and placed upstream of the pCAT reporter gene (Fig. 1A). The reporter gene constructs were transiently transfected into hPTECs, grown in 25 mM glucose, and the cell extracts were prepared 48 h after transfection. As shown in Figure 1B, there was no significant increase in the CAT activity in cells expressing the pCAT-hP1 (-1717 base pairs AT1 promoter sequence) compared with pCAT-B (basic CAT vector). However, the CAT activity was significantly increased in cells expressing the pCAT-hP2 (-1543 base pairs), pCAT-hP3 (-1438 base pairs), pCAT-hP4 (-1301 base pairs), and pCAT-hP5 (-823 base pairs), indicating the presence of a repressor element between –1543 and –1717 base pairs.
Figure 1.
CAT activity of hAT1R reporter gene constructs in 25 mM glucose. CAT activity for serially deleted promoter fragments in pCAT vector was determined. (A) Schematic representation of the pCAT reporter expression vector containing serially deleted 5′ promoter region of the hAT1R gene. pCAT-hP1 is labeled with a number of putative transcription binding sites. (B) Solid bars represent the CAT activity for each serially deleted hAT1R promoter fragment in hPTECs. Data are expressed as the mean ± SEM (n = 4–6). *p <0.05 versus basic vector pCAT-B.
Determination of Glucose-mediated Repressor Element in the hAT1R Gene Promoter
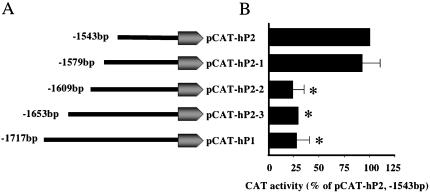
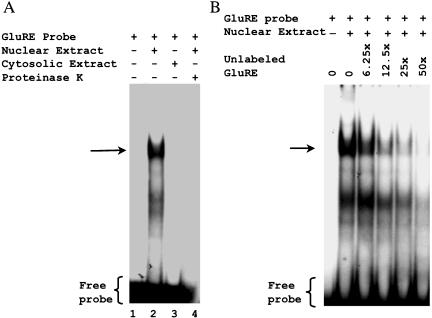
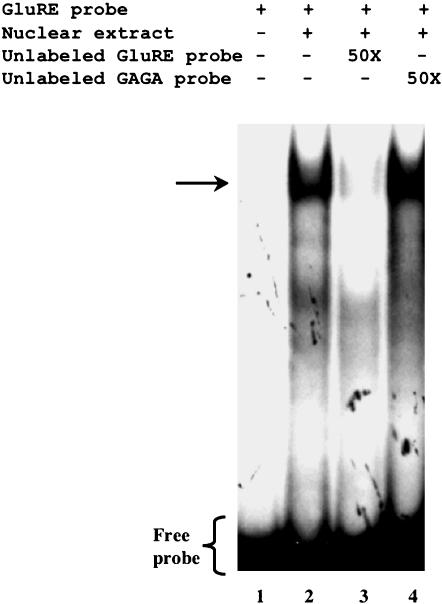
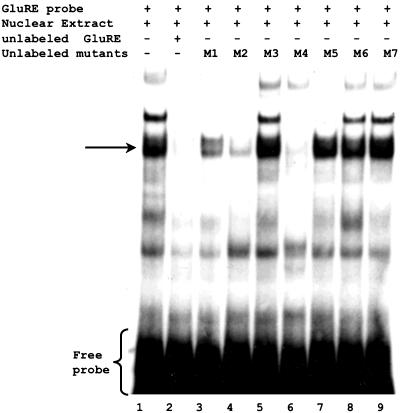
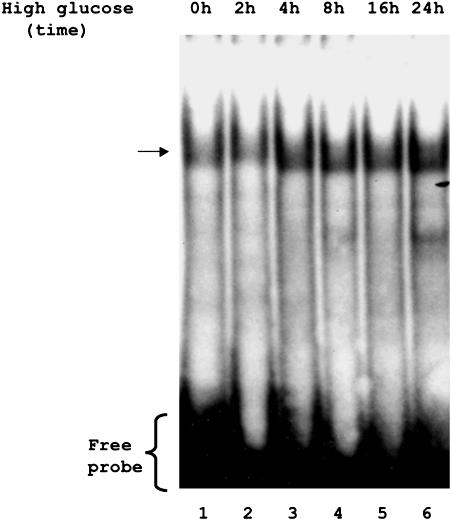
To further define the region responsible for glucose-mediated repression of CAT activity, we generated additional deletion constructs between –1543- and –1717-base pair sequences (Figure 2A). Reporter gene assays using pCAT-hP2-1 (-1579 base pairs), pCAT-hP2-2 (1609 base pairs), and pCAT-hP2-3 (-1653 base pairs) revealed that the repressor activity resides within the pCAT-hP2-2 construct, suggesting the repressor element is located between –1582 and –1610 base pairs (Figure 2B). Although computer analysis indicated a number of putative binding sites located within this region, the 29-base pair sequence (5′-AACTGATTTTTGTATATTGATCTTGTATT-3′) showed no significant homology with any known cis-regulatory elements. Therefore, we refer to this sequence as the GluRE. To determine whether this region (between -1582 and -1610 base pairs) was capable of binding transcription factors, we performed a series of gel shift assay experiments with nuclear extracts of glucose-exposed hPTECs by using the α-32P–labeled GluRE as a probe. Gel shift assays showed a distinct mobility shift of the labeled probe (indicated by arrow) with the nuclear extracts (Figure 3A, lane 2), which was abolished on pretreatment of the extracts with proteinase K (Figure 3A, lane 4), indicating the formation of a glucose-induced protein–DNA complex. The protein-DNA binding was specific for nuclear factor(s) as evidenced by observed lack of mobility shift with the cytoplasmic extract (Figure 3A, lane 3). The presence of increasing concentrations (0–50 times) of unlabeled GluRE probe progressively inhibited the appearance of labeled DNA–protein complex (Figure 3B), demonstrating the specificity of the nuclear protein(s) binding to GluRE DNA. This specificity was further confirmed by competitive mobility shift assay with a nonspecific competitor. A previously identified enhancer element (GAGA box) in the hAT1R promoter (Wyse et al., 2000) was used as a nonspecific competitor. Although the unlabeled specific GluRE probe (50-fold excess) efficiently competed with the 32P-labeled GluRE probe, there was no competition observed in binding when the nonspecific GAGA box was used as a competitor (Figure 4). Occasionally, we observed an additional band in the mobility shift assay that could be due to degradation of nuclear binding factors or alterations in binding factor affinity. In an attempt to identify the essential DNA sequences within the GluRE necessary for nuclear trans-acting factor(s) to bind GluRE-DNA, mobility shift assays were performed using nuclear extracts from high glucose-treated cells in the presence of 50-fold excess of various unlabeled mutant GluRE-DNAs. Results in Figure 5 show that although certain mutations within the GluRE have no effect and allowed effective competition with the original sequence, there are three specific regions (“ACTG” motif, and two “TATT” motifs) within the GluRE has high affinity for nuclear protein(s) binding. Sequence alteration of any one region significantly reduced the ability of the GluRE to bind nuclear trans-acting factor(s), suggesting that multiple elements within the hormone response unit are required for full repressor activity. To further define the importance of high glucose in GluRE to bind nuclear trans-acting factor(s), we evaluated time-dependent changes in GluRE binding. Exposure of cells to high glucose caused a time-dependent increase in GluRE binding activity to nuclear trans-acting factor(s) (Figure 6). The maximum binding activity was observed at 4 h (44% increase over basal activity) and maintained up to 24 h after high glucose exposure.
Figure 2.
Identification of a glucose responsive repressor element in hAT1R gene promoter. To identify further the repressor element additional hAT1R promoter CAT constructs were generated within the –1543 to –1717-bp region. (A) Schematic representation of the pCAT reporter expression vector containing serially deleted 5′ promoter region of the hAT1R gene. For the functional analysis of these constructs, hPTECs were transiently transfected and CAT activity measured. (B) Solid bars represent the CAT activity for each serially deleted hAT1R promoter fragment in hPTECs. Data are expressed as CAT activity normalized to β-galactosidase activity for each construct. The results represent the mean ± SEM of three separate experiments. *p <0.05 versus pCAT-hP2 (-1543-base pair) fragment.
Figure 3.
Identification of specific protein binding activity in hPTEC nuclear extracts to the GluRE. To identify protein binding to GluRE in high glucose-exposed hPTEC nuclear extracts, mobility shift assays were performed. 32P-Labeled GluRE probe was incubated with 10 μg of nuclear or cytosolic extracts. Samples were analyzed on 4% non-denaturing polyacrylamide gels and visualized by autoradiography. (A) Labeled probe in the absence of nuclear or cytosolic extract (lane 1), in the presence of high glucose (25 mM)-exposed nuclear extract (lane 2), in the presence of cytosolic extract (lane 3), and in the presence of nuclear extract with proteinase K (lane 4). (B) Mobility shift assay performed using labeled GluRE in the presence of high glucose-treated nuclear extracts and increasing concentrations of unlabeled GluRE probe as indicated. The position of the protein–DNA complex is indicated by arrow.
Figure 4.
Glucose-induced protein-DNA binding activity is specific to GluRE DNA. To determine the binding specificity of glucose induced nuclear factor(s) to GluRE DNA, competition experiments were performed using 32P-labeled GluRE DNA in the presence of unlabeled GluRE DNA or unlabeled GAGA DNA (previously shown as a growth response enhancer element; Wyse et al., 2000). Lane 1, labeled probe in the absence of nuclear extract; lane 2, in the presence of high glucose (25 mM) exposed nuclear extract; lane 3, nuclear extract incubated with labeled probe to which 50-fold excess of unlabeled GluRE was added as a competitor; and lane 4, nuclear extract with labeled probe to which 50-fold excess of unlabeled GAGA was added as a competitor. The arrow indicates the position of the protein–DNA complex.
Figure 5.
Identification of specific DNA sequences within the GluRE necessary for nuclear factor(s) to bind to GluRE. Mobility shift assays were performed with high glucose-treated nuclear extracts in the presence of labeled double-stranded GluRE DNA and unlabeled mutant double-stranded GluRE DNA (50-fold excess) as competitor. Lane 1, high glucose-treated nuclear extract incubated with labeled GluRE probe; lane 2, nuclear extract incubated with labeled GluRE probe to which unlabeled double-stranded GluRE probe (5′-AACTGATTTTTGTATATTGATCTTGTATT-3′) was added as a competitor; lanes 3–9, nuclear extracts incubated with labeled GluRE to which unlabeled double-stranded mutant GluRE [lane 3 (M1), 5′-ACAGAATTTTTGTATATTGATCTTGTATT-3′; lane 4 (M2), 5′-AACTGAGGGGTGTATATTGATCTTGTATT-3′; lane 5 (M3), 5′-AACTGATTTTTGGCGCTTGATCTTGTATT-3′; lane 6 (M4), 5′-AACTGATTTTTGTATATTGAGAGGGTATT-3′; lane 7 (M5), 5′-ACAGAAGGGGTGTATATTGATCTTGTATT-3′; lane 8 (M6), 5′-AACTGATTTTTGGCGCTTGAGAGGGTATT-3′; lane 9 (M7), 5′-AACTGATTTTTGTAGCGGGATCTTGGCGG-3′] was added as a competitor. Sequences in bold indicate mutated bases, and the arrow indicates the position of protein–GluRE complexes.
Figure 6.
Glucose-induced nuclear protein(s) binding activity in hPTECs. Semiconfluent serum-depleted cells were exposed to high glucose (25 mM) for indicated times. Nuclear extracts were isolated as described in Materials and Methods. Mobility shift assay was performed in the presence of 32P-labeled double-stranded GluRE DNA. Data are representative of three experiments.
Identification of Trans-Acting Nuclear Factor(s)
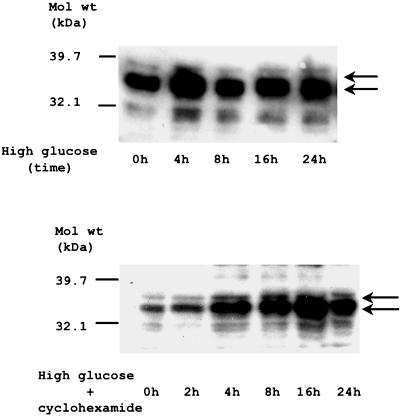
The direct interaction between GluRE and the nuclear transacting protein(s) was further examined by Southwestern analysis. Figure 7 (top) shows that in high glucose, two DNA binding proteins (34 and 36 kDa) showed induced DNA binding activity with the GluRE sequence. Exposure of hPTEC to high glucose for increasing times shows that the 34- and 36-kDa proteins were activated and reached a maximum at 4 h. Furthermore, the induced activity of these binding proteins (BPs) was sustained above basal level for up to 24 h. The delayed activation of these DNA binding proteins by glucose suggests that de novo synthesis may be required for their induced activity. To investigate whether new protein synthesis is required for glucose dependent trans-activation of DNA binding proteins, cells were pretreated with protein synthesis inhibitor cyclohexamide (1 μg/ml; a concentration shown to inhibit ongoing protein synthesis by >98%, as determined by the [3H]leucine incorporation assay (unpublished data), and glucose-induced DNA binding activity was measured (Figure 7, bottom). Our results show that inhibition of protein synthesis did not reduce glucose-induced activity of 34- and 36-kDa proteins to bind the hAT1R GluRE, suggesting that de novo protein synthesis (expression) of the trans-acting factors is not prerequisite for the observed increase in protein DNA binding activity.
Figure 7.
Demonstration of direct binding of glucose-induced transacting factor to GluRE in hPTECs. Southwestern analysis was performed to identify the direct interaction between GluRE probe and it binding protein(s). High glucose-exposed hPTEC nuclear extracts were separated on an 8% SDS gel, transferred to a nitrocellulose membrane, and hybridized with 32P-labeled GluRE probe. (A) Time course of glucose-activated nuclear proteins of 34 and 36 kDa (GluRE-BPs). (B) Determination of whether GluRE-BPs activation requires de novo protein synthesis. Nuclear extracts from cyclohexamide (1 μg/ml)-treated cells and exposed to high glucose (25 mM) for indicated time underwent Southwestern analysis by using 32P-labeled double-stranded GluRE probe. Arrows indicate the positions of GluRE-BPs. Data shown are representative of multiple experiments (n = 3).
Functional Significance of the Human AT1R-GluRE
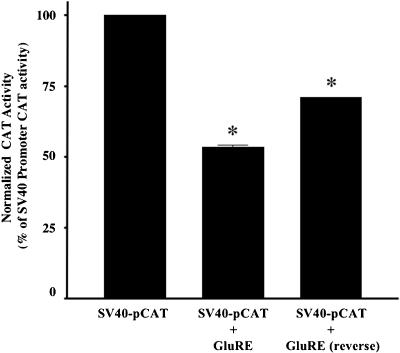
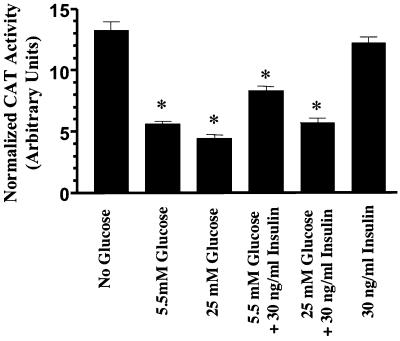
To determine whether the GluRE can function as a repressor element on a heterologous promoter, we used an SV40 pCAT-promoter vector construct. The 29-base pair GluRE sequence was inserted downstream from the SV40 promoter-CAT transcription unit in either orientation, and GluRE-mediated inhibition in CAT activity was measured in hPTECs. The results in Figure 8 show that the GluRE in either orientation significantly inhibited the strong SV40 promoter-induced CAT activity in hPTEC cells, confirming the function of the GluRE as a silencer element. Previously, we have shown that hAT1R gene promoter has a growth factor (insulin) enhancer element (Wyse et al., 2000). Therefore, we tested the ability of the enhancer to activate the hAT1R gene in the presence of normal and high glucose (Figure 9). The result shows that in the presence of high glucose, the insulin enhancer element was unable to induce hAT1R gene transcription over basal levels. We observed a modest increase in insulin-mediated hAT1R transcription in normal glucose. However, the enhancer element could activate the CAT activity in the absence of glucose, suggesting a dominant role for GluRE in hAT1R gene transcription.
Figure 8.
Effect of GluRE on heterologous promoter activity. CAT activity of hPTEC cells expressing three SV40 promoter constructs with GluRE (SV40 pCAT-promoter, SV40 pCAT-promoter with GluRE, correct orientation, and SV40 pCAT-promoter with GluRE, reverse orientation). Bars represent the CAT activity for each construct expressing cells treated with high glucose. Data shown are means ± SEM of three separate experiments. *p <0.01 versus SV40-pCAT.
Figure 9.
Functional analysis of the repressor element GluRE on hAT1R promoter. Reporter promoter CAT constructs (pCAT-hP2–2) were transfected into hPTECs, treated with different conditions as indicated and CAT activity was measured. Values are normalized to β-gal activity and total protein (n = 3). *p <0.05 versus no glucose treatment.
DISCUSSION
The overall objective of transcriptional regulation is to design each gene's regulatory region to be responsive to multiple factors, each of which reflects a specific cell need or function at a specific stage of development (Guarente, 1992). Recently, we have identified a 12-base pair sequence (GAGA box) located between –161 and -149 base pairs was necessary for basal and growth factor (insulin, epidermal growth factor, platelet-derived growth factor, and growth hormone)-induced transcriptional activation of the hAT1R gene. However, with functional studies using an extended 5′ region of the hAT1R gene (-1717 to +70 bp), we were unable to demonstrate the growth factor(s)-enhanced transcriptional activity over basal transcription, suggesting the presence of a negative regulator upstream of the growth factor(s) enhancer element. In this study, we identified a novel negative (silencer) element of the hAT1R gene located between -1610 and -1582 base pairs upstream of the 5′ end of the cDNA sequence identified by Bergsma et al. (1992). This sequence is responsible for glucose-mediated transcriptional repression of the hAT1R gene. Thus, we refer this sequence as the GluRE. Even so, the lack of endogenous hAT1R expression in cultured hPTEC makes it difficult to address the correlation between the glucose and the endogenous hAT1R in these cells. Several in vivo studies in rats with untreated diabetes mellitus demonstrated an increase in the steady-state mRNA levels of AT1 receptor and hormone-receptor binding in heart, liver, and adrenal gland and a decrease in kidney (Sechi et al., 1994; Brown et al., 1997). However, insulin treatment of diabetic rats reversed these abnormalities. Furthermore, exposure to high glucose showed reduced AngII-mediated cellular functions in mesangial cells (Amiri and Garcia, 1999). In addition, studies in our laboratory by using human adrenocortical cells expressing endogenous hAT1R show glucose-mediated down-regulation of receptor mRNA and protein expression (unpublished data). Transcriptional repressors can be divided into two main types, depending on the mode of action: 1) passive repression resulting in down-regulation of activators, for example, via competing for it active binding sites; and 2) active repression resulting in direct inhibition of transcriptional initiation. With GluRE binding transcription factor(s), we observed basal binding activity in the presence of normal glucose and an increased binding activity in presence of high glucose. The decrease in hAT1R transcription is consistent with the level of glucose-induced increase in the activity of GluRE binding to trans-acting factors, suggesting a functional role for GluRE in hAT1R gene repression. Functional analysis of the GluRE by using a heterologous promoter (SV40) further confirmed these results.
A comparison analysis of the rat and the mouse AT1a-R or AT1b-R 5′ regulatory regions shows no significant similarity with the human AT1R-GluRE, suggesting that in human hAT1R may use a unique transcriptional repression mechanism. However, one negative (N1, -489 to –331 base pairs) and three positive cis-regulatory elements in the 5′-flanking region of the rat AT1a-R gene have been reported previously (Murasawa et al., 1995). The authors showed that the core sequence in the negative regulatory element (NRE) is A + T rich (5′-TAATCTTTTATTTTA-3′). Site-directed mutagenesis of the core GluRE sequence showed that multiple regions within the 29-bp stretch are required for maximum binding to the nuclear transacting proteins. There is 55.2% sequence homology in the rat AT1aR sequence (between –464 and –434 base pairs) overlapping the NRE with the GluRE. Furthermore, the hAT1R-GluRE does not show sequence homology with any of the reported glucose response elements. A DNA sequence termed as glucose inducible response element (GlRE) responsible for glucose-activated transcription has been extensively studied (Bergot et al., 1992; Cuif et al., 1993; Diaz Guerra et al., 1993; Lefrancois-Martinez et al., 1995). The GIRE sequence is closely related to another transcriptional response element known as the carbohydrate response element (ChoRE) (Shih et al., 1995; Kaytor et al., 1997). In cultured cells, the ChoRE can induce transcription in response to increased glucose concentration in the media. Studies demonstrated that in S14 gene a 30-base pair segment in the promoter region is essential for the glucose-induced transcriptional activation. The L-type pyruvate kinase (L-PK) gene GlRE consists of two palindromic noncanonical E-boxes (CANNTG) separated by five base pairs. Previously, it was shown that these E boxes bind to the upstream stimulatory factor(s) (USFs) (Diaz Guerra et al., 1993; Shih et al., 1995), which are important for normal diet dependent activation of genes by glucose (Vallet et al., 1997, 1998; Casado et al., 1999). Also Koo and Towle (2000) have proposed a ChoRE model consisting of two E box half sites related to CACG motifs. However, the studies clearly demonstrated that the interaction of USFs alone with GlRE/ChoRE could not account for the observed glucose responsiveness in various genes, which led to the discovery of chicken ovalbumin upstream promoter-transcription factor II (COUP-TFII) (Lou et al., 1999). Studies have shown that COUP-TFII was able to inhibit glucose-induced USF-dependent activation of the L-PK gene transcription. COUP-TFII binding sites overlapping with the GIRE/ChoRE could serve as a negative regulatory factor of the glucose sensor complex. A number of other DNA binding glucose responsive elements also have been reported (Hasegawa et al., 1999; Lou et al., 1999; reviewed in Yamada and Noguchi, 1999; Koo and Towle, 2000) that correlates with glucose-dependent transcriptional activity. Previous observations in combination with our results suggest that multiple cis-acting elements (termed a hormone response unit) are required for the maximum effect of glucose on gene transcription. Interestingly, all these previously identified glucose response elements are GC rich, whereas the hAT1R GluRE is an AT-rich sequence Therefore, further studies are required to elucidate the mechanisms by which GluRE inserts its repressor effect on hAT1R gene transcription. These areas are currently under investigation.
Although many inflammatory and immunological processes that can cause kidney diseases, diabetes mellitus is the leading contributor to the development of diabetic nephropathy and end-stage renal disease. Compared with other tissues, AngII receptor expression in the kidney is decreased in experimentally induced diabetes mellitus (Wilkes, 1987; Cheng et al., 1994; Brown et al., 1997), and insulin replacement normalizes the expression (Christiansen et al., 1982; Cheng et al., 1994). The functional significance of this decrease in AngII receptors is not understood, because studies have shown that inhibition of RAS can prevent progression of kidney disease. Interactions between glucose/insulin and AngII signaling may have an important role in the regulation of renal physiology. There are two classes of glucose transporters described in mammalian cells; the facilitated and sodium-coupled glucose transporters (Olefsky, 1999; Saltiel and Kahn, 2001). Currently, at least six sodium-dependent and 13 insulin-facilitated transporters are recognized (Wood and Trayhurn, 2003). They exhibit different substrate specificity, transport affinity, developmental regulation, and tissue-specific expression. In the renal nephron, reabsorption of luminal glucose against a concentration gradient occurs via apical Na+/glucose cotransporters (Lee et al., 1994; You et al., 1995), and glucose diffuses out of the cells into the blood via basolateral-facilitated glucose transporters (Cheung and Hammerman, 1988; Dominguez et al., 1994). Alternatively, in other target cells such as adrenal, heart, and liver, glucose uptake is mediated by facilitated glucose transporters for glucose metabolism and utilization (Vaulont et al., 2000). Diabetes mellitus is a heterogeneous disorder with hyperglycemia as a common feature due to the deregulation of insulin signaling. In target cells (nonrenal), insulin is necessary for transmembrane transport of glucose (Saltiel, 1996; O'brien et al., 2001; Saltiel and Kahn, 2001). In normal physiology, a rise in extracellular glucose levels results in cellular uptake of glucose facilitated by insulin-dependent glucose transporters. Therefore, insulin is necessary for intracellular uptake of glucose in those cells. In addition, insulin and insulin like-growth factors initiate mitogenic signaling and stimulate growth and differentiation (Vijayan et al., 1999; O'brien et al., 2001). However, impairment in insulin signaling (such as in diabetes) will result in less cellular glucose uptake (although there is high extracellular glucose), as adrenal, heart, and liver, therefore causing activation of hAT1R gene transcription, probably mediated by growth factors (studies showed that growth factors, in particular growth hormone, are up-regulated in diabetes). Alternatively, in the renal proximal tubule, cellular glucose uptake is mediated from the luminal side by Na+/glucose cotransporters and exits the cell through the basolateral-facilitated glucose transporter. However, in diabetes intracellular glucose exit mechanisms at the basolateral membrane are impaired due to deregulation of insulin. Therefore, glucose accumulates inside the proximal tubule cells and down-regulates the hAT1R gene transcription. It remains to be determined whether glucose directly or through its metabolites, modulates the transcriptional machinery of hAT1R gene. It has been suggested that glucose-dependent gene expression is not dependent on a single regulator but may be a result of cross talk between multiple factors and cofactors that determines cell-specific transcriptional regulation.
In summary, we have demonstrated that hAT1R gene transcription can be inhibited by glucose. This inhibition is mediated through a cis-acting repressor element (GluRE) located upstream of the basic transcription unit. Furthermore, we identified two DNA binding trans-acting nuclear factors of 34 and 36 kDa, specifically activated in the presence of glucose, and recognized the hAT1R-GluRE. The interaction between the GluRE and the glucose-induced trans-acting factors is necessary for the observed hAT1R transcriptional repression in glucose-treated hPTECs. Moreover, in the presence of high glucose, insulin was unable to enhance the hAT1R gene transcription over basal expression. Our data suggest that although insulin can activate hAT1R gene transcription, the GluRE functions as a repressor that controls the transcriptional repression of hAT1R gene by specific DNA binding trans-acting factor(s) that recognize the hAT1R glucose response element. Therefore, glucose plays a pivotal role in the regulation of hAT1R function (normal physiology) in renal proximal tubule through transcriptional control of the gene. Isolation and functional characterization of the GluRE trans-acting factors will allow an understanding of the molecular mechanisms by which glucose regulates the hAT1R gene transcription.
Acknowledgments
This study was supported in part by research grants from the National Institutes of Health (HL61356) and the American Diabetes Association. Portions of this study were presented at the Experimental Biology 2003, the annual meeting of the American Society for Biochemistry and Molecular Biology in San Diego, CA.
Article published online ahead of print. Mol. Biol. Cell 10.1091/mbc.E04–03–0203. Article and publication date are available at www.molbiolcell.org/cgi/doi/10.1091/mbc.E04–03–0203.
Abbreviations used: AngII, angiotensin II; CAT, chloramphenicol acetyl transferase; ChoRE, carbohydrate response element; COUP-TFII, chicken ovalbumin upstream promoter-transcription factor II; GIRE, glucose-induced response element; hAT1R, human angiotensin type 1 receptor; hPTEC, human proximal tubule epithelial cell; GluRE, glucose response element; NRE, negative regulatory element; USF, upstream stimulatory factor.
References
- Amiri, F., and Garcia, R. (1999). Regulation of angiotensin II receptors and PKC isoforms by glucose in rat mesangial cells. Am. J. Physiol. 276, F691-F699. [DOI] [PubMed] [Google Scholar]
- Bakris, G.L. (1993). Angiotensin-converting enzyme inhibitors and the progression of diabetic nephropathy. Ann. Intern. Med. 118, 643-644. [DOI] [PubMed] [Google Scholar]
- Bergsma, D.J., Ellis, C., Kumar, C., Nuthulaganti, P., Kersten, H., Elshourbagy, N., Griffin, E., Stadel, J.M., and Aiyar, N. (1992). Cloning and characterization of a human angiotensin II type 1 receptor. Biochem. Biophys. Res. Commun. 183, 989-995. [DOI] [PubMed] [Google Scholar]
- Bergot, M.O., Diaz-Guerra, M.J., Puzenat, N., Raymondjean, M., and Kahn, A. (1992). cis-Regulation of the L-type pyruvate kinase gene promoter by glucose, insulin and cyclic AMP. Nucleic Acids Res. 20, 1871-1877. [DOI] [PMC free article] [PubMed] [Google Scholar]
- Berk, B.C., and Corson, M.A. (1997). Angiotensin II signal transduction in vascular smooth muscle cells: role of tyrosine kinases. Circ. Res. 80, 607-617. [DOI] [PubMed] [Google Scholar]
- Berneger, T.V., Brancati, F.L., Whelton, P.K., and Klag, M.J. (1994). End-stage renal disease attributable to diabetes mellitus. Ann. Intern. Med. 121, 912-918. [DOI] [PubMed] [Google Scholar]
- Bradford, M.M. (1976). A rapid and sensitive method for the quantitation of microgram quantities of protein utilizing the principle of protein-dye binding. Anal. Biochem. 72, 248-254. [DOI] [PubMed] [Google Scholar]
- Brewster, U.C., Setaro, J.F., and Perazella, M.A. (2003). The renin-angiotensin-aldosterone system: cardiorenal effects and implications for renal and cardiovascular disease states. Am. J. Med. Sci. 326, 15-24. [DOI] [PubMed] [Google Scholar]
- Brown, L., Wall, D., Marchant, C., and Sernia, C. (1997). Tissue-specific changes in angiotensin II receptors in streptozotocin-diabetic rats. J. Endocrinol. 154, 355-362. [DOI] [PubMed] [Google Scholar]
- Burson, J.M., Aguilera, G., Gross, K.W., and Sigmund, C.D. (1994). Differential expression of angiotensin receptor 1A and 1B in mouse. Am. J. Physiol. 267, E260-E267. [DOI] [PubMed] [Google Scholar]
- Casado, M., Vallet, V.S., Kahn, A., and Vaulont, S. (1999). Essential role in vivo of upstream stimulatory factors for a normal dietary response of the fatty acid synthase gene in the liver. J. Biol. Chem. 274, 2009-2013. [DOI] [PubMed] [Google Scholar]
- Cheng, H-F., Burns, K.D., and Harris, R.C. (1994). Reduced proximal tubule angiotensin II receptor expression in streptozotocin induced diabetes mellitus. Kidney Int. 46, 1603-1610. [DOI] [PubMed] [Google Scholar]
- Cheung, P.T., and Hammerman, M.R. (1988). Na+-independent D-glucose transport in rabbit renal basolateral membranes. Am. J. Physiol. 254, F711-F718. [DOI] [PubMed] [Google Scholar]
- Christiansen, J.S., Gammelgaard, J., Tronier, B., Svendsen, P.A., and Prving, H.-H. (1982). Kidney function and size in diabetics before and during initial insulin treatment. Kidney Int. 21, 683-688. [DOI] [PubMed] [Google Scholar]
- Cuif, M.H., Porteu, A., Kahn, A., and Vaulont, S. (1993). Exploration of a liver-specific glucose/insulin-responsive promoter in transgenic mice. J. Biol. Chem. 268, 13769-13772. [PubMed] [Google Scholar]
- Diaz Guerra, M.J., Bergot, M.O., Martinez, A., Cuif, M.H., Kahn, A., and Raymondjean, M. (1993). Functional characterization of the L-type pyruvate kinase gene glucose response complex. Mol. Cell Biol. 12, 7725-7733. [DOI] [PMC free article] [PubMed] [Google Scholar]
- Dominguez, J.H., Camp, K., Maianu, L., Feister, H., and Garvey, W.T. (1994). Molecular adaptations of GLUT1 and GLUT2 in renal proximal tubules of diabetic rats. Am. J. Physiol. 266, F283-F290. [DOI] [PubMed] [Google Scholar]
- Gelband, C.H., Zhu, M., Lu, d., Reagan, L.P., Fluharty, S.J., Posner, P., Raizada, M.K., and Sumners, C. (1997). Functional interactions between neuronal AT1 and AT2 receptors. Endocrinology. 138, 2195-2198. [DOI] [PubMed] [Google Scholar]
- Guarente, L. (1992). Mechanism and regulation of transcriptional activation in eukaryotes: conserved features from yeast to human. In: Transcriptional Regulation, Vol. 2, ed. S.L. McKnight and K.R. Yamamoto, Cold Spring Harbor, New York: Cold Spring Harbor Laboratory Press, 1007-1036. [Google Scholar]
- Guo, D.F., Furuta, H., Mizukoshi, M., and Inagami, T. (1994). The genomic organization of human angiotensin II type 1 receptor. Biochem. Biophys. Res. Commun. 200, 313-319. [DOI] [PubMed] [Google Scholar]
- Ibrahim, H.N., and Hostetter, T.H. (1997). Diabetic nephropathy. J. Am. Soc. Nephrol. 8, 487-493. [DOI] [PubMed] [Google Scholar]
- Hasegawa, J., Osatomi, K., Wu, R.F., and Uyeda, K. (1999). A novel factor binding to the glucose response elements of liver pyruvate kinase and fatty acid synthase genes. J. Biol. Chem. 274, 1100-1107. [DOI] [PubMed] [Google Scholar]
- KaLinyak, J.E., Sechi, L.A., Griffin, C.A., and Don, B.R. (1993). The renin-angiotensin system in streptozotocin-induced diabetes mellitus in the rat. J. Am. Soc. Nephrol. 4, 1337-1345. [DOI] [PubMed] [Google Scholar]
- Kaytor, E.N., Shih, H., and Towle, H.C. (1997). Carbohydrate regulation of hepatic gene expression. Evidence against a role for the upstream stimulatory factor. J. Biol. Chem. 272, 7525-7531. [DOI] [PubMed] [Google Scholar]
- Kim, S., and Iwao, H. (2000). Molecular and cellular mechanisms of angiotensin II-mediated cardiovascular and renal diseases. Pharmacol. Rev. 52, 11-34. [PubMed] [Google Scholar]
- Koo, S.H., and Towle, H.C. (2000). Glucose regulation of mouse S(14) gene expression in hepatocytes. Involvement of a novel transcription factor complex. J. Biol. Chem. 275, 5200-5207. [DOI] [PubMed] [Google Scholar]
- Lee, W.S., Kanai, Y., Wells, R.G., and Hediger, M.A. (1994). The high affinity Na+/glucose cotransporter. Re-evaluation of function and distribution of expression. J. Biol. Chem. 269, 12032-12039. [PubMed] [Google Scholar]
- Lefrancois-Martinez, A.M., Martinez, A., Antoine, B., Raymondjean, M., and Kahn, A. (1995). Upstream stimulatory factor proteins are major components of the glucose response complex of the L-type pyruvate kinase gene promoter. J. Biol. Chem. 270, 2640-2643. [DOI] [PubMed] [Google Scholar]
- Lewis, E.J., Hunsicker, L.G., Bain, R.P., and Rhode, R.D. (1993). The effect of angiotensin-converting enzyme inhibition on diabetic nephropathy. N. Engl. J. Med. 329, 1456-1462. [DOI] [PubMed] [Google Scholar]
- Lou, D.Q., Tannour, M., Selig, L., Thomas, D., Kahn, A., and Vasseur-Cognet, M. (1999). Chicken ovalbumin upstream promoter-transcription factor II, a new partner of the glucose response element of the L-type pyruvate kinase gene, acts as an inhibitor of the glucose response. J. Biol. Chem. 274, 28385-28394. [DOI] [PubMed] [Google Scholar]
- Murasawa, S., Matsubara, H., Mori, Y., Kijima, K., Maruyama, K., and Inada, M. (1995). Identification of a negative cis-regulatory element and trans-acting protein that inhibit transcription of the angiotensin II type 1a receptor gene. J. Biol. Chem. 270, 24282-24286. [DOI] [PubMed] [Google Scholar]
- O'brien, R.M., Streeper, R.S., Ayala, J.E., Stadelmaier, B.T., and Horn-buckle, L.A. (2001). Insulin-regulated gene expression. Biochem. Soc. Trans. 29, 552-558. [DOI] [PubMed] [Google Scholar]
- Olefsky, J.M. (1999). Insulin-stimulated glucose transport minireview series. J. Biol. Chem. 274, 1863-1868. [DOI] [PubMed] [Google Scholar]
- Raizada, M.K., Phillips, M.I., and Summers, C. (1993). Cellular and Molecular Biology of the Rennin Angiotensin System, Boca Raton, FL: CRC Press.
- Remuzzi, A., Perico, N., Amuchastegui, C.S., Malanchini, B., Mazersha, M., Battaglia, C., Bertani, T., and Remuzzi, G. (1993). Short and long-term effect of angiotensin II receptor blockade in rats with experimental diabetes. J. Am. Soc. Nephrol. 4, 40-49. [DOI] [PubMed] [Google Scholar]
- Ross, B.D., and Rennke, H.G. (1994). Renal Pathophysiology - The Essentials, ed P. Coryell, Baltimore, MD: Williams & Wilkins.
- Saltiel, A.R. (1996). Diverse signaling pathways in the cellular actions of insulin. Am. J. Physiol. 270, E375-E385. [DOI] [PubMed] [Google Scholar]
- Saltiel, A.R., and Kahn, C.R. (2001). Insulin signalling and the regulation of glucose and lipid metabolism. Nature 414, 799-806. [DOI] [PubMed] [Google Scholar]
- Sechi, L.A., Griffin, C.A., and Schambelan, M. (1994). The cardIac renin-angiotensin system in STZ-induced diabetes. Diabetes 43, 1180-1184. [DOI] [PubMed] [Google Scholar]
- Shih, H.M., Liu, Z., and Towle, H.C. (1995). Two CACGTG motifs with proper spacing dictate the carbohydrate regulation of hepatic gene transcription. J. Biol. Chem. 270, 21991-21997. [DOI] [PubMed] [Google Scholar]
- Thekkumkara, T.J., Cookson, R., and Linas, S.L. (1998). Angiotensin (AT1A) receptor-mediated increases in transcellular sodium transport in proximal tubule cells. Am. J. Physiol. 274, F897-F905. [DOI] [PubMed] [Google Scholar]
- Whiteside, C.I., and Thompson, J. (1989). The role of angiotensin II in progressive diabetic glomerulopathy in the rat. Endocrinology 125, 1932-1940. [DOI] [PubMed] [Google Scholar]
- Vallet, V.S., Henrion, A.A., Bucchini, D., Casado, M., Raymondjean, M., Kahn, A., and Vaulont, S. (1997). Glucose-dependent liver gene expression in upstream stimulatory factor 2 -/- mice. J. Biol. Chem. 272, 21944-21949. [DOI] [PubMed] [Google Scholar]
- Vallet, V.S., Casado, M., Henrion, A.A., Bucchini, D., Raymondjean, M., Kahn, A., and Vaulont, S. (1998). Differential roles of upstream stimulatory factors 1 and 2 in the transcriptional response of liver genes to glucose. J. Biol. Chem. 273, 20175-20179. [DOI] [PubMed] [Google Scholar]
- Vaulont, S., Vasseur-Cognet, M., and Kahn, A. (2000). Glucose regulation of gene expression. J. Biol. Chem. 275, 31555-31558. [DOI] [PubMed] [Google Scholar]
- Vijayan, A., Franklin, S.C., Behrend, T., Hammerman, M.R., and Miller, S.B. (1999). Insulin-like growth factor I improves renal function in patients with end-stage chronic renal failure. Am. J. Physiol. 276, R929-R934. [DOI] [PubMed] [Google Scholar]
- Wilkes, B.M. (1987). Reduced glomerular angiotensin II receptor density in diabetes mellitus in the rat: time course and mechanism. Endocrinology 120, 1291-1298. [DOI] [PubMed] [Google Scholar]
- Wolf, G., and Neilson, E.G. (1991). Molecular mechanisms of tubulointerstitial hypertrophy and hyperplasia. Kidney Int. 39, 401-420. [DOI] [PubMed] [Google Scholar]
- Wolf, G., and Neilson, E.G. (1993). Angiotensin II as a renal growth factor. J. Am. Soc. Nephrol. 3, 1531-1540. [DOI] [PubMed] [Google Scholar]
- Wood, I.S., and Trayhurn, P. (2003). Glucose transporters (GLUT and SGLT): expanded families of sugar transport proteins. Br. J. Nutr. 89, 3-9. [DOI] [PubMed] [Google Scholar]
- Wyse, B.D., Linas, S.L., and Thekkumkara, T.J. (2000). Functional role of a novel cis-acting element (GAGA box) in human type-1 angiotensin II receptor gene transcription. J. Mol. Endocrinol. 25, 97-108. [DOI] [PubMed] [Google Scholar]
- Yamada, K., and Noguchi, T. (1999). Nutrient and hormonal regulation of pyruvate kinase gene expression. Biochem. J. 337, 1-11. [PMC free article] [PubMed] [Google Scholar]
- You, G., Lee, W.S., Barros, E.J., Kanai, Y., Huo, T.L., Khawaja, S., Wells, R.G., Nigam, S.K., and Hediger, M.A. (1995). Molecular characteristics of Na(+)-coupled glucose transporters in adult and embryonic rat kidney. J. Biol. Chem. 270, 29365-29371. [DOI] [PubMed] [Google Scholar]


