

Abstract
Quantitative understanding of nanoparticles delivery in a complex vascular networks is very challenging because it involves interplay of transport, hydrodynamic force, and multivalent interactions across different scales. Heterogeneous pulmonary network includes up to 16 generations of vessels in its arterial tree. Modeling the complete pulmonary vascular system in 3D is computationally unrealistic. To save computational cost, a model reconstructed from MRI scanned images is cut into an arbitrary pathway consisting of the upper 4-generations. The remaining generations are represented by an artificially rebuilt pathway. Physiological data such as branch information and connectivity matrix are used for geometry reconstruction. A lumped model is used to model the flow resistance of the branches that are cut off from the truncated pathway. Moreover, since the nanoparticle binding process is stochastic in nature, a binding probability function is used to simplify the carrier attachment and detachment processes. The stitched realistic and artificial geometries coupled with the lumped model at the unresolved outlets are used to resolve the flow field within the truncated arterial tree. Then, the biodistribution of 200nm, 700nm and 2μm particles at different vessel generations is studied. At the end, 0.2 to 0.5% nanocarrier deposition is predicted during one time passage of drug carriers through pulmonary vascular tree. Our truncated approach enabled us to ef ciently model hemodynamics and accordingly particle distribution in a complex 3D vasculature providing a simple, yet efficient predictive tool to study drug delivery at organ level.
Keywords: Nanoparticle delivery, Heterogeneous vasculature, Human lung, Truncated Model, Adhesion probability function, Organ level drug delivery
Introduction
Nanoparticles have been widely studied as potential multifunctional carrier platforms for therapeutic drug delivery and imaging applications (Farokhzad and Langer, 2006, Roney et al., 2005, Zhou et al., 2016). Nanoparticles (NPs) need to be delivered directly to the desired tissues while minimizing deposition/uptake by other tissues. To evaluate delivery efficacy to target region and assess damage to healthy tissues, the distribution and concentration of deposited NPs along the vascular pathway is needed. Nanoparticle targeted delivery in a vascular system involves interplay of transport, hydrodynamic force, and multivalent interactions with targeted biosurfaces. The biodistribution of drug carriers in a vascular network depends on many parameters such as particle size, vascular geometry, and local flow conditions (Sohrabi et al., 2014). For instance, several studies have demonstrated that particle binding is inversely correlated with shear rates (Lin et al., 2010, Blackwell et al., 2001).
Various nanomedicine and drug administration methods have been developed for treating and diagnosing lung diseases such as lung cancer, tuberculosis, cystic fibrosis. Therapeutic or diagnostic compounds enter the lung mainly in two ways: intravenous injection and inhalational delivery (De Jong et al., 2008, Santra et al., 2005, Fabian et al., 2008, Videira et al., 2002, Pandey and Khuller, 2005). While there have been extensive studies on the NP transport during inhalational delivery (Schroeter et al., 2012, Zhang et al., 2005, Kleinstreuer and Zhang, 2003), little has been done on NP transport in pulmonary circulation. In fact, pulmonary circulation is involved in the distribution and uptake of not only intravenously injected but also inhaled drugs since pulmonary circulation could be one of the primary vascular targets of NPs that penetrate into the lungs after inhalation. It is thus important to develop a tool for evaluation of vascular NP delivery in lung, which has a high translational impact on pulmonary therapeutics.
Lung vasculature tree is highly branched and complex in morphometry (Tawhai et al., 2006). Some Vessels feed the lobes and others provide blood to the individual alveoli (Yang et al., 2010). The structure and function of lung are intimately related (Burrowes et al., 2008). Many mathematical models have been developed to incorporate actual branching pattern of pulmonary tree to better understand heterogeneous network hemodynamic (Karau et al., 2001, Molthen et al., 2004, Krenz and Dawson, 2003, Spilker et al., 2007). Studies focusing on pulmonary blood flow have emphasized the role of vessel branching pattern on flow and pressure distribution within the arterial tree (Burrowes et al., 2005a, Tawhai et al., 2011). Assuming rigid vessels, Burrowes et al. (Burrowes et al., 2005a) used imaging data, volume-filling branching algorithm (VFB) (Burrowes et al., 2005b, Tawhai et al., 2000) and 1D linear finite element method to relate the structure to the function of left lung vasculature. Yang et al. (Yang et al., 2010) compared individual representations of vascular trees to propose a statistically meaningful branching pattern for lung and placenta. Introducing tapering principal pathway as observed in rat tomography X-rays (Karau et al., 2001), Dawson et al. (Dawson et al., 1999) studied the heterogeneity of pulmonary blood flow using concepts related to fractal-like structures, e.g. self-consistency. In self-consistent tree (Boxt et al., 1994), the structure of all side branches off main pathway can be assumed to be statistically indistinguishable from their corresponding sub-regions in the principal trunk.
Numerical models have been extensively used to study drug particle behavior in blood flow. Computational fluid-particle dynamic (CFPD) simulation provides an attractive way to study the particle delivery in a complex geometry model (Marsden et al., 2007, Oakes et al., 2013, Liu et al., 2012, Wang et al., 2014). Gentile et al. (Gentile et al., 2008) investigated the effect of vessel permeability and blood rheology on the transport of nanoparticles. Longest et al. (Longest and Kleinstreuer, 2003) simulated the blood particle deposition process in a non-parallel flow. Sohrabi et al. (Sohrabi et al., 2014) quantified the transport and adhesion of drug particles in a 4 generation vascular model. However, there has been no attempt in literature to quantify distribution of drug particles at an organ level. To accomplish this task, a complete 3D model of vascular network is needed.
Due to the complexity of the lung vascular network, using a full scale model for the whole lung is computationally unrealistic (Zhang et al., 2008). In this study, we propose a novel approach for reconstruction of heterogeneous lung vascular tree from morphometric data. Using this model, we are able to solve blood flow in 3D. The objective is to develop a tool to study drug particle deposition in a whole vascular tree. First, the whole heterogeneous complex network is truncated into a sample pathway beginning from main pulmonary artery and emptying into capillaries. Lumped model (Zhang et al., 2008, Walters and Luke, 2010) at the unresolved boundaries yields a virtual ow geometry that allows acceptable statistical resolution of the ow at all scales for any set of ow conditions. This computationally efficient 3D model is then used to study the transport and adhesion of drug particles where we can quantify drug delivery in a heterogeneous lung vascular network. Since the nanoparticle binding process is stochastic in nature, we have used a binding probability function to account for ligand-receptor dynamics. In what follows, the geometry reconstruction process is explained first, then the model is carefully benchmarked and fluid flow results are discussed in detail. At the end, we showed distribution of drug carrier at various generations of vascular tree and evaluated the percentage of delivered drug load.
Method
a. Connectivity matrix
The asymmetry feature of vasculature considerably influences hemodynamics and subsequently stress distribution to which the vessel walls were exposed in reality (Huang et al., 1996). In lung vasculature, every vessel between two bifurcation points is described as a segment and the combination of those vessels with the same order connected in series are defined as an element. The statistical average length and diameter of elements are listed in Table 1 (Huang et al., 1996). In a heterogeneous tree, blood vessels of order n not only originate from vessels of order n − 1 but also branch off vessels of order n, n − 2 and n − 3. Connectivity matrix (CM) proposed by Kassab et al. (Kassab et al., 1993) quantitatively describes the branching pattern of lung vasculature. Table 2 demonstrates the connectivity matrix of pulmonary arteries of a human left lung. Each entry indicates the ratio of the total number of elements of order m (which expands from a parent element of order n) divided by total number of elements of order n. CM can also be used to calculate the total number of elements of order m using as shown in Table 1.
Table 1.
Dimensions and morphometric specifications of left human lung vessels (Huang et al., 1996).
| Generation number | Diameter (mm) | Length (mm) | α = NS/NE | Corrected total number of elements [24] | Proposed artificial model |
|---|---|---|---|---|---|
| #1 | 0.020 | 0.20 | 1.07 | 51,205,812 | 52,718,208 |
| #2 | 0.036 | 0.19 | 1.38 | 14,057,197 | 15,506,119 |
| #3 | 0.056 | 0.26 | 1.35 | 5,101,903 | 4,373,245 |
| #4 | 0.096 | 0.31 | 1.46 | 2,256,846 | 1,204,087 |
| #5 | 0.15 | 0.48 | 1.41 | 674,169 | 521,716 |
| #6 | 0.22 | 0.54 | 2.02 | 285,772 | 100,203 |
| #7 | 0.35 | 0.64 | 2.99 | 86,020 | 38,862 |
| #8 | 0.51 | 0.76 | 3.73 | 22,004 | 17,272 |
| #9 | 0.77 | 1.00 | 3.74 | 6,225 | 4,318 |
| #10 | 1.17 | 1.54 | 3.34 | 1,724 | 889 |
| #11 | 1.78 | 2.16 | 5.73 | 450 | 381 |
| #12 | 2.81 | 3.59 | 5.30 | 127 | 127 |
| #13 | 4.33 | 5.01 | 5.19 | 43 | |
| #14 | 7.31 | 9.39 | 3.80 | 7 | |
| #15 | 15.12 | 10.12 | 2.50 | 2 |
Table 2.
Connectivity matrix of elements in pulmonary arteries of a left human lung (Huang et al., 1996). The integer numbers in parentheses characterize the exact configuration of our substitute network.
| Generation No. | #1 | #2 | #3 | #4 | #5 | #6 | #7 | #8 | #9 | #10 | #11 | #12 | #13 | #14 | #15 |
|---|---|---|---|---|---|---|---|---|---|---|---|---|---|---|---|
|
| |||||||||||||||
| #1 | 0.17 (0) | 2.54 (3) | 1.11 (1) | 0.38 (0) | 0.02 (0) | 0.01 (0) | 0.02 (0) | 0 | 0.02 (0) | 0 | 0 | 0 | 0 | 0 | 0 |
|
| |||||||||||||||
| #2 | 0.23 (0) | 1.67 (2) | 0.97 (1) | 0.17 (0) | 0.09 (0) | 0.06 (0) | 0.04 (0) | 0.02 (0) | 0 | 0 | 0 | 0 | 0 | 0 | |
|
|
|
||||||||||||||
| #3 | 0.26 (0) | 1.44 (2) | 0.63 (0) | 0.28 (0) | 0.2 (1) | 0.19 (0) | 0.11 (0) | 0.03 (0) | 0 | 0 | 0 | 0 | 0 | ||
|
|
|
||||||||||||||
| #4 | 0.18 (1) | 1.96 (2) | 1.5 (1) | 0.93 (1) | 1.07 (1) | 0.65 (1) | 0.16 (0) | 0.03 (0) | 0 | 0 | 0 | 0 | |||
|
|
|
||||||||||||||
| #5 | 0.06 (1) | 1.81 (2) | 1.1 (1) | 0.81 (1) | 0.83 (1) | 0.45 (0) | 0.12 (0) | 0.02 (0) | 0 | 0 | 0 | ||||
|
|
|
||||||||||||||
| #6 | 0.12 (0) | 2.54 (2) | 1.16 (1) | 0.83 (1) | 0.93 (1) | 0.71 (1) | 0.2 (0) | 0.05 | 0 | 0 | |||||
|
|
|
||||||||||||||
| #7 | 0.25 (0) | 2.52 (2) | 1.08 (1) | 1.08 (2) | 1.49 (1) | 0.94 (1) | 0.43 | 0 | 0 | ||||||
|
|
|
||||||||||||||
| #8 | 0.28 (1) | 2.06 (2) | 1.26 (1) | 1.63 (2) | 1.45 (1) | 0.43 | 0 | 0 | |||||||
|
|
|
||||||||||||||
| #9 | 0.21 (0) | 2.38 (3) | 1.47 (1) | 0.88 (1) | 0.81 | 0.33 | 0 | ||||||||
|
|
|
||||||||||||||
| #10 | 0.21 (0) | 2.52 (3) | 1.35 (1) | 1.48 | 0 | 0 | |||||||||
|
|
|
||||||||||||||
| #11 | 0.25 (0) | 2.43 (3) | 0.95 | 0.33 | 0 | ||||||||||
|
|
|
||||||||||||||
| #12 | 0.14 (0) | 2.57 | 1 | 0.5 | |||||||||||
|
|
|
||||||||||||||
| #13 | 0.19 | 2.83 | 1.5 | ||||||||||||
|
|
|
||||||||||||||
| #14 | 0 | 3.5 | |||||||||||||
|
|
|
||||||||||||||
| #15 | 0.5 | ||||||||||||||
b. Realistic vessel geometry
A MRI 3 based DICOM 4 image of a healthy, adult human lung vasculature was obtained retrospectively from a clinical research study at UPMC5. Since modeling the blood flow in a full vasculature tree is extremely challenging, we propose to trim the network tree into an arbitrary pathway as shown in Figure 1a. The cut realistic geometry comprises of upper four generations of arterial tree and 18 truncated daughter segments. The summation of entries in every column of connectivity matrix, shown in Table 2, can roughly represents the number of vessels originated from a parent element. In our case, the summation of CM entries within the grey region in Table 2 adds up ~17.4 which is approximately equal to 18, the number of daughter segments in our truncated realistic geometry, as shown in Figure 1a.
Figure 1.

(a) The realistic and (b) artificial parts of proposed 3-D model structure. Each color represent a specific generation in substitute section.
c. Artificial vessel geometry
Examination of the MRI-images shows that the vessels smaller than generation 12 do not have an acceptable image precision. The inaccuracies are generally caused by scanning resolution limitations or patient’s movement during the scanning procedure. To reconstruct a full scale model of lung vasculature, the truncated realistic pathway is extended by an artificial substitute model down to capillaries. Starting from generation 12, we have constructed a substitute pathway using the pulmonary morphometric data by Huang et al. (Huang et al., 1996). Since the entries in CM are not integers, we need to round them up/down for geometry reconstruction. Moreover, segment-to-element ratio (α = NS/NE) represents the number of daughter branching sites in parent elements which is also needed to be rounded.
In Table 2, the integer numbers in parentheses characterize the exact configuration of our substitute network as shown Figure 1b. Every parent element is divided into segments separated by internal nodes. Generally, the two largest daughter vessels branch out from the last node of parent element. The rest were connected to the interior nodes such that the larger daughters were closer to the element inlet. The branching daughters that branch out from main truck are cut by their segment length. The reconstructed pathway has two triple bifurcations and all branching angles were assumed to be 60°. The smallest vessel is 20μm in diameter, slightly larger than capillaries.
The artificial truncated model is reconstructed as shown in Figure 1b. It should be noted that some elements even originate from the vessels with the same order, e.g. generations 8, 5 and 4. The total number of cut daughter vessels in the proposed pathway is approximately equal to the summation of all CM entries. Furthermore, we virtually expanded the truncated branches of our artificial model to calculate the total number of vessels in every generation. It is shown that it agrees well with listed morphometric data (Huang et al., 1996) in Table 1. At the end, stitching truncated realistic and artificial geometries, a sample pathway representing whole pulmonary arterial tree is reconstructed. Generations 15 and 1 have two orders of magnitude size difference. Dividing the whole geometry into separate sections, we are able to attribute different computational mesh settings to each region. More detail information about mesh generation can be found in supplementary information.
d. Boundary condition
The average blood flow to main pulmonary artery (MPA) of a normal subject is 3.4 l/min (Henk et al., 1998). It corresponds to average inlet velocity of 0.135 m/s to the realistic part of our truncated model. It should be noted that the steady state flow regime is assumed in this study. Also, fully developed parabolic velocity profile is prescribed at the MPA inlet. Assuming maximum inlet velocity and diameter of 0.27m/s and 23mm, Reynolds number can be estimated as 2000 indicating that blood flow in our truncated geometry is laminar.
Due to Fåhraeus–Lindqvist effect (Sharan and Popel, 2001), viscosity changes in pulmonary tree. The empirical equation used to evaluate viscosity in term of vessel diameter are discussed in detail in supplementary information. Also, a lumped model is used to evaluate flow resistance at cut branches. Two methods for evaluation of equivalent resistance are developed and benchmarked accordingly. These information can also be found in supplementary information.
e. Nanoparticle tracking and deposition
NPs were modeled as rigid bodies with motion governed by hydrodynamic forces and Brownian dynamics (Brańka and Heyes, 1998, Radhakrishnan et al., 2013). Langevin dynamics was used to simulate the motion of particles.
| (3) |
where ς is the friction coefficient and Fr is the random force that satisfies the fluctuation dissipation theorem. It should be noted that commercial finite-volume CFD solver, Fluent 15.0 (ANSYS Inc.) was used for solving flow field on a Dell Precision T5500 workstation. An in-house code is used for particle tracking simulation where the Velocity Verlet algorithm is used to update NP position and velocity (Sohrabi et al., 2014).”
Particle adhesion to vessel wall is stochastic in nature. Thus, binding probability function is introduced to estimates the likelihood of having closed ligand-receptor bonds between NP and vessel wall. Decuzzi and Ferrari (Decuzzi and Ferrari, 2006) proposed that the ligands with particle surface density of ml and the receptors with substrate surface density of mr can stochastically form successful bonds at probability Pa when particle hit the substrate. Pa can be expressed as
| (4) |
where the coefficients FS and TS depend on aspect ratio (Goldman et al., 1967); is the association constant at zero load of the ligand-receptor pair; r0 is the radius of interaction area between the particle and the substrate; λ = 1e−10 is a characteristic length of the ligand-receptor bond; dp is particle diameter; kBT is the Boltzman thermal energy; and h0 = 1e−8m and δeq = 5e−9m are maximum and equilibrium separation distance, respectively.
Flow resolution in pulmonary vasculature
By coupling 3D and 0D models at truncated boundaries, we are able to simulate the whole lung arterial network by one sample pathway. Realistic geometry represents generations 16 to 12 while artificial substitute pathway represents generations 12 to 1. The pressure distribution is plotted out within different generations of vascular network which agrees well with the prediction using lumped model as shown in Figure 2a. The realistic and artificial sections of truncated model almost have the same pressure reduction trend at stitched location which indicates that the artificial extension is a suitable substitute. Moreover, it should be noted that the pressure loss in distal lumens is higher as shown in Figure 2a. The driving pressures through the pulmonary circulatory system including arterial, venular and capillary network is approximately 7mmhg (Clough et al., 2006). In our model, the arterial network beginning from MPA and emptying into capillaries has a pressure drop of approximately 3.4mmhg.
Figure 2.

Pressure distribution in whole pulmonary vascular network versus generation order for 3D and lumped models (+1 through +12 for artificial model and +12 through +16 for realistic section) (a); Mass flux within elements of main body (red bars), at the outlet of branches in the truncated artificial (blue bars) and realistic (blue dots) portions. The green line represent flow rates in lumped model (b).
Blood flow rate within various vessels of truncated model is shown in Figure 2b. The red bar corresponds to the flow rates within elements in the main pathway while blue bars represent flow rate at the cut locations. From right to left, blue bars within each generation characterize smaller to bigger vessels. The flow rate within truncated 3D model matches well with lumped model especially for proximal and distal elements. Furthermore, our predicted flow rates also lie within ranges reported by Yang et al. (Yang et al., 2010) and Burrowes et al. (Burrowes et al., 2005a). The shear stress distribution in whole arterial network is also demonstrated in Figure 3. It is demonstrated that the bifurcating regions are exposed to higher shear stresses. Moreover, the shear rate in microvasculature remains within the physiologically relevant range of 200 and 1600 s−1 as reported by others (Nigro et al., 2011, Nagaoka and Yoshida, 2006).
Figure 3.
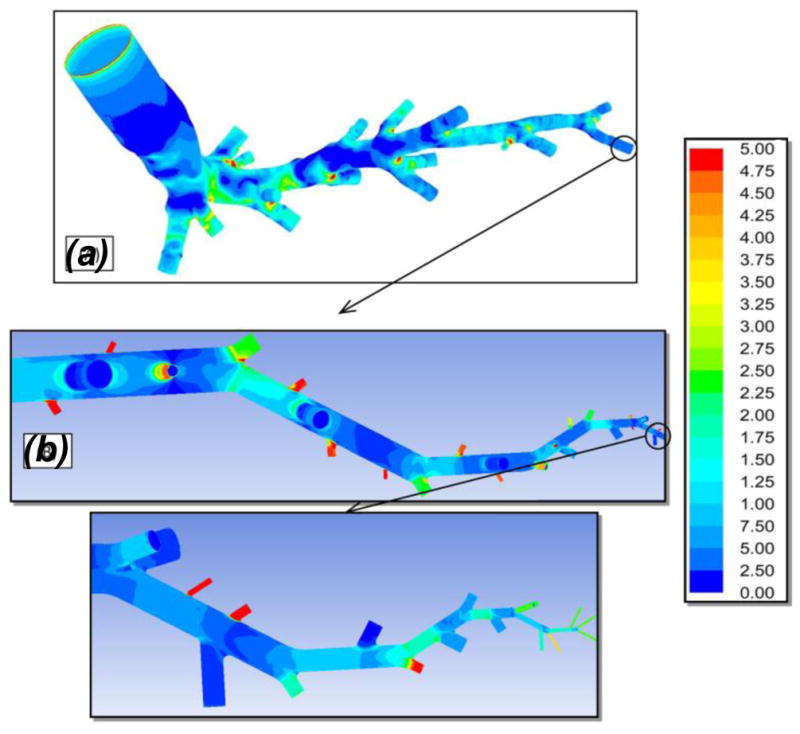
Shear stress (Pa) contours on the wall of realistic (A) and artificial (B) geometries. The realistic and substitute structures are stitched together at the appropriate location.
Particle transport and deposition
To quantify drug distribution in the arterial tree, 2 million particles are released into the 3D vessel network model. It should be noted that due to low concentration of drug particles in blood stream, particle-particle interactions (i.e., collision and/or coalescence) is not considered in this study. Without any modifications to modeling algorithm, most of particles leave the main pathway at cut locations while just a few particles reach lower generations. In this case, the number of particles passing through smaller vessels is not enough to draw a clear conclusion about the particle binding in microvasculature. To address this issue, particles are brought to re-enter computational domain from the same generation from where they left as shown in Figure 4. For instance, the particles leaving truncated model at A, B and C will re-enter at D. Moreover, it should be noted that the particle’s radial position do not change during this process. Using this approach, the delivery process can be simply modeled in whole vasculature network as shown in Figure 4. It is observed that particles mostly deposit in lower generation vessels, specifically microvasculature network.
Figure 4.

Schematics of particle tracking algorithm in the truncated model; NP distribution in a section of pulmonary tree.
To model particle transport and deposition, NPs are primarily assumed to deposit as soon as they contact the vessel wall. In this instant binding situation, the adhesion probability is 100%. Results from 100% binding probability case will be same as results from solution of conventional convection-transport equation (Cwall = 0) since particles bind as soon as they hit the vessel wall. This control case act as a comparison tool to better understand the significance of drug particle attachment and detachment processes. As mentioned before, we have previously proposed an approach to simplify the attachment and detachment of drug carrier to/from vessel wall using adhesion probability function (Sohrabi et al., 2016). This model is extensively benchmarked and validated with experimental data in microcirculation (Thomas et al., 2014). The chance of permanent binding to vessel wall is calculated from Eq. 4. In what follows, these two cases are compared and discussed in detail.
Clinically relevant carrier sizes of 200nm, 700nm and, 2μm are considered in this study. The results are post-processed to evaluate binding percentage and density at different generations of vascular tree. The binding percentage characterizes the ratio of deposited particles to the total number of particles passing through a certain vessel. Furthermore, the binding density represents the number of particles deposited on 1mm2 of vessel wall. It should be noted that the binding percentage demonstrate the average adsorption rate while binding density represents local delivery load. It is shown in Figure 5a that the binding percentage is significantly higher in mirovessels compared to upper generations. It is also observed that smaller particles have comparatively higher binding rate in lower generations due to their higher dispersion rate. On the contrary to binding percentage, drug particles have relatively higher binding density in bigger vessels as shown in Figure 5b. For adhesion probability of 100%., the binding density in upper generations is almost independent of particle size.
Figure 5.

(a) The binding percentage and (b) the binding density of 200nm, 700nm and 2μm particles in different generation of vascular network when the adhesion probability is 100%.
To implement adhesion dynamics, particles are assumed to have %P chance of forming permanent bonds and depositing as they contact the vessel wall. Particles who fail to bind will still have chances to hit the wall again and successfully adhere. Failed particles will be reflected with opposite velocity. Based on Eq. 5, the adhesion probability of 200nm particles slightly change with shear stress while that for 2μm decreases exponentially with shear stress as shown in Figure 6.
Figure 6.

(a) The binding percentage and (b) the binding density of 200nm, 700nm and 2μm particles in different generation of vascular network; The adhesion probability changing with shear stress is also shown for all considered particle sizes.
Similar to instant binding case, deposition percentage is much higher in smaller vessels as shown in Figure 6a. However, comparatively higher binding rates are observed in upper generations. In particularl, 700nm particles has higher deposition percentage in upper generations compared to 200nm and 2μm particles. The interplay of adhesion and dispersion dynamics can explain this behavior. For instance, 2μm carriers in comparison with 200nm particles have lower dispersion rate but higher chance of binding in lower shear regions.
Using binding probability function, it is observed in Figure 6b that the NPs binding density is significantly higher in larger vessels. It should be noted that the binding density of NPs does not characterize volumetric delivery load, but merely demonstrate drug supply to 1 mm2 unit area of vessel wall. Thus, endothelial cells of bigger vessels essentially receive higher drug load and the adverse effect of drug may first appear in upper generation of vascular tree.
Red blood cells enhance drug delivery in vascular flow as NP dispersion rate is influenced by local disturbances in the flow due to RBC motion and deformation. Adding relatively small deformable RBCs to our model of vascular network is computationally unrealistic. However, to better understand how RBCs influence drug delivery in vascular tree, dispersion rate can be corrected to compensate the presence of RBCs. In our prior work (Tan et al., 2016), we have previously characterized nanoparticle dispersion in red blood cell suspension by the Lattice Boltzmann-Immersed Boundary Method. Simulations were performed to obtain an empirical formula to predict NP dispersion rate for a range of shear rates and cell concentrations. It can be expressed as
| (5) |
where η is the shear rate. The proposed formula provided us an efficient method for estimating the NP dispersion rate in modeling NP transport in large-scale vascular networks without explicit RBC models (Tan et al., 2016). Applying our proposed formula, it is observed that presence of RBC mostly influences the binding rate of the smaller particles in lower generations as shown in Figure 7a. It can be concluded that the dominant transport mechanism in upper generations is not diffusion.
Figure 7.

(a) The binding percentage of 200nm and 2μm particles in the presence of RBC; (b) The total delivery load to lung via arterial network for particle of different sizes.
It is of great significance to know the delivery load to the whole vascular network as the drug is being released into the main pulmonary artery. The overall binding percentage is demonstrated for different carrier sizes with and without adhesion probability function as shown in Figure 7b. In other word, this percentage of injected drug can deposit in arterial network during its one time passage. Based on our model, 0.2 to 0.5% deposition is predicted for drug particles of various sizes. It is also shown that although particles binding probability is basically two orders of magnitude smaller than instant binding case, the actual deposition rate is at most four time smaller. Thus, it can be concluded that due to the complex dynamics of particle transport and adhesion mechanism, the correlation between binding probability and actual deposition rate is not linear. More detailed information about this nonlinear correlation can be found in our previous work (Sohrabi et al., 2016).
Conclusion
To quantify nanoparticles delivery to lung, a 3D model of its vascular network is needed. The heterogeneous pulmonary network is simplified into one sample pathway which consists of realistic and artificial parts. Morphometric data describing the complex asymmetric branching structure of the human pulmonary vasculature is used for geometry reconstruction. By applying equivalent 0D model at unresolved outlets, a statistically equivalent “virtual geometry” is created at reduced computational cost. Moreover, a multi-scale strategy is applied to model pulmonary NP delivery using binding probability function.
First, by coupling 3D and 0D models, flow and pressure distribution within arterial pulmonary tree are obtained. Then, drug deposition in whole vascular network is quantified. Our approach enabled us to study drug transport within different vessel sizes spanning from 15mm to 20μm. High computational cost can be considered as one limitation of this approach. The solution of fluid field takes only a few hours while particle tracking section contributes to the major part of the computational load, ~2days. The computational cost of particle tracking section can be significantly reduced using an optimized code on GPU (Graphics Processing Unit used for High-Performance Computing). Thus, the proposed computational approach is believed that it can be used in the clinical work flow as an efficient predictive tool. It should be also noted that our results are statistical representation of drug delivery to different generations of vascular tree in organ level. However, we could not investigate the particle binding distribution at individual micro-vessels since lower portion of vascular tree are reconstructed artificially. Following similar approach, drug delivery in other organs can be also studied closely and these results can be put together to be directly implemented into whole body pharmokinetic models. Following this path, we are able to acquire an optimal design, dose and concentration of NPs to achieve the dual goal of minimal damage to healthy tissues and maximal curing dose for the targeted region.
Supplementary Material
Acknowledgments
The authors acknowledge the supports of this work from National Science Foundation (NSF) CAREER grant CBET-1113040, NSF CBET-1067502, and National Institute of Health (NIH) grant EB015105.
Footnotes
Magnetic Resonance Imaging
Digital Imaging and Communications in Medicine
University of Pittsburgh Medical Center
Publisher's Disclaimer: This is a PDF file of an unedited manuscript that has been accepted for publication. As a service to our customers we are providing this early version of the manuscript. The manuscript will undergo copyediting, typesetting, and review of the resulting proof before it is published in its final citable form. Please note that during the production process errors may be discovered which could affect the content, and all legal disclaimers that apply to the journal pertain.
Contributor Information
Salman Sohrabi, Department of Mechanical Engineering & Mechanics, Lehigh University, Bethlehem, PA 18015, USA.
Shunqiang Wang, Department of Mechanical Engineering & Mechanics, Lehigh University, Bethlehem, PA 18015, USA.
Jifu Tan, Department of Mechanical Engineering & Mechanics, Lehigh University, Bethlehem, PA 18015, USA.
Jiang Xu, School of Mechanics and Engineering, Southwest Jiaotong University, 610031 Chengdu, China.
Jie Yang, School of Mechanics and Engineering, Southwest Jiaotong University, 610031 Chengdu, China.
Yaling Liu, Department of Mechanical Engineering & Mechanics, Bioengineering Program, Lehigh University, Bethlehem, PA 18015, USA.
References
- BLACKWELL JE, DAGIA NM, DICKERSON JB, BERG EL, GOETZ DJ. Ligand coated nanosphere adhesion to E- and P-selectin under static and flow conditions. Ann Biomed Eng. 2001;29:523–33. doi: 10.1114/1.1376697. [DOI] [PubMed] [Google Scholar]
- BOXT LM, KATZ J, LIEBOVITCH LS, JONES R, ESSER PD, REID L. Fractal analysis of pulmonary arteries: the fractal dimension is lower in pulmonary hypertension. Journal of thoracic imaging. 1994;9:8–13. [PubMed] [Google Scholar]
- BRAŃKA A, HEYES D. Algorithms for Brownian dynamics simulation. Physical Review E. 1998;58:2611. doi: 10.1103/physreve.60.2381. [DOI] [PubMed] [Google Scholar]
- BURROWES K, SWAN A, WARREN N, TAWHAI M. Towards a virtual lung: multi-scale, multi-physics modelling of the pulmonary system. Philosophical Transactions of the Royal Society of London A: Mathematical, Physical and Engineering Sciences. 2008;366:3247–3263. doi: 10.1098/rsta.2008.0073. [DOI] [PMC free article] [PubMed] [Google Scholar]
- BURROWES KS, HUNTER PJ, TAWHAI MH. Anatomically based finite element models of the human pulmonary arterial and venous trees including supernumerary vessels. Journal of applied physiology. 2005a;99:731–738. doi: 10.1152/japplphysiol.01033.2004. [DOI] [PubMed] [Google Scholar]
- BURROWES KS, HUNTER PJ, TAWHAI MH. Investigation of the Relative Effects of Vascular Branching Structure and Gravity on Pulmonary Arterial Blood Flow Heterogeneity via an Image-based Computational Model 1. Academic radiology. 2005b;12:1464–1474. doi: 10.1016/j.acra.2005.06.004. [DOI] [PubMed] [Google Scholar]
- CLOUGH AV, AUDI SH, MOLTHEN RC, KRENZ GS. Lung circulation modeling: status and prospect. Proceedings of the IEEE. 2006;94:753–768. [Google Scholar]
- DAWSON CA, KRENZ GS, KARAU KL, HAWORTH ST, HANGER CC, LINEHAN JH. Structure-function relationships in the pulmonary arterial tree. Journal of Applied Physiology. 1999;86:569–583. doi: 10.1152/jappl.1999.86.2.569. [DOI] [PubMed] [Google Scholar]
- DE JONG WH, HAGENS WI, KRYSTEK P, BURGER MC, SIPS A, GEERTSMA RE. Particle size-dependent organ distribution of gold nanoparticles after intravenous administration. Biomaterials. 2008;29:1912–1919. doi: 10.1016/j.biomaterials.2007.12.037. [DOI] [PubMed] [Google Scholar]
- DECUZZI P, FERRARI M. The adhesive strength of non-spherical particles mediated by specific interactions. Biomaterials. 2006;27:5307–5314. doi: 10.1016/j.biomaterials.2006.05.024. [DOI] [PubMed] [Google Scholar]
- FABIAN E, LANDSIEDEL R, MA-HOCK L, WIENCH K, WOHLLEBEN W, VAN RAVENZWAAY B. Tissue distribution and toxicity of intravenously administered titanium dioxide nanoparticles in rats. Archives of Toxicology. 2008;82:151–157. doi: 10.1007/s00204-007-0253-y. [DOI] [PubMed] [Google Scholar]
- FAROKHZAD OC, LANGER R. Nanomedicine: developing smarter therapeutic and diagnostic modalities. Advanced drug delivery reviews. 2006;58:1456–1459. doi: 10.1016/j.addr.2006.09.011. [DOI] [PubMed] [Google Scholar]
- GENTILE F, CHIAPPINI C, FINE D, BHAVANE R, PELUCCIO M, CHENG MMC, LIU X, FERRARI M, DECUZZI P. The effect of shape on the margination dynamics of non-neutrally buoyant particles in two-dimensional shear flows. Journal of biomechanics. 2008;41:2312–2318. doi: 10.1016/j.jbiomech.2008.03.021. [DOI] [PubMed] [Google Scholar]
- GOLDMAN A, COX R, BRENNER H. Slow viscous motion of a sphere parallel to a plane wall—II Couette flow. Chemical Engineering Science. 1967;22:653–660. [Google Scholar]
- HENK CB, SCHLECHTA B, GRAMPP S, GOMISCHEK G, KLEPETKO W, MOSTBECK GH. Pulmonary and aortic blood flow measurements in normal subjects and patients after single lung transplantation at 0.5 T using velocity encoded cine MRI. CHEST Journal. 1998;114:771–779. doi: 10.1378/chest.114.3.771. [DOI] [PubMed] [Google Scholar]
- HUANG W, YEN R, MCLAURINE M, BLEDSOE G. Morphometry of the human pulmonary vasculature. Journal of Applied Physiology. 1996;81:2123–2133. doi: 10.1152/jappl.1996.81.5.2123. [DOI] [PubMed] [Google Scholar]
- KARAU KL, MOLTHEN RC, DHYANI A, HAWORTH ST, HANGER CC, ROERIG DL, JOHNSON RH, DAWSON CA. Pulmonary arterial morphometry from microfocal X-ray computed tomography. American Journal of Physiology-Heart and Circulatory Physiology. 2001;281:H2747–H2756. doi: 10.1152/ajpheart.2001.281.6.H2747. [DOI] [PubMed] [Google Scholar]
- KASSAB GS, RIDER CA, TANG NJ, FUNG YC. Morphometry of pig coronary arterial trees. American Journal of Physiology-Heart and Circulatory Physiology. 1993;265:H350–H365. doi: 10.1152/ajpheart.1993.265.1.H350. [DOI] [PubMed] [Google Scholar]
- KLEINSTREUER C, ZHANG Z. Laminar-to-turbulent fluid-particle flows in a human airway model. International Journal of Multiphase Flow. 2003;29:271–289. [Google Scholar]
- KRENZ GS, DAWSON CA. Flow and pressure distributions in vascular networks consisting of distensible vessels. American Journal of Physiology-Heart and Circulatory Physiology. 2003;284:H2192–H2203. doi: 10.1152/ajpheart.00762.2002. [DOI] [PubMed] [Google Scholar]
- LIN A, SABNIS A, KONA S, NATTAMA S, PATEL H, DONG JF, NGUYEN KT. Shear-regulated uptake of nanoparticles by endothelial cells and development of endothelial-targeting nanoparticles. Journal of Biomedical Materials Research Part A. 2010;93A:833–842. doi: 10.1002/jbm.a.32592. [DOI] [PMC free article] [PubMed] [Google Scholar]
- LIU Y, SHAH S, TAN J. Computational modeling of nanoparticle targeted drug delivery. Reviews in Nanoscience and Nanotechnology. 2012;1:66–83. [Google Scholar]
- LONGEST PW, KLEINSTREUER C. Comparison of blood particle deposition models for non-parallel flow domains. Journal of Biomechanics. 2003;36:421–430. doi: 10.1016/s0021-9290(02)00434-7. [DOI] [PubMed] [Google Scholar]
- MARSDEN AL, VIGNON-CLEMENTEL IE, CHAN FP, FEINSTEIN JA, TAYLOR CA. Effects of exercise and respiration on hemodynamic efficiency in CFD simulations of the total cavopulmonary connection. Annals of biomedical engineering. 2007;35:250–263. doi: 10.1007/s10439-006-9224-3. [DOI] [PubMed] [Google Scholar]
- MOLTHEN RC, KARAU KL, DAWSON CA. Quantitative models of the rat pulmonary arterial tree morphometry applied to hypoxia-induced arterial remodeling. Journal of Applied Physiology. 2004;97:2372–2384. doi: 10.1152/japplphysiol.00454.2004. [DOI] [PubMed] [Google Scholar]
- NAGAOKA T, YOSHIDA A. Noninvasive evaluation of wall shear stress on retinal microcirculation in humans. Investigative ophthalmology & visual science. 2006;47:1113–1119. doi: 10.1167/iovs.05-0218. [DOI] [PubMed] [Google Scholar]
- NIGRO P, ABE JI, BERK BC. Flow shear stress and atherosclerosis: a matter of site specificity. Antioxidants & redox signaling. 2011;15:1405–1414. doi: 10.1089/ars.2010.3679. [DOI] [PMC free article] [PubMed] [Google Scholar]
- OAKES JM, MARSDEN AL, GRANDMONT C, SHADDEN SC, DARQUENNE C, VIGNON-CLEMENTEL IE. Airflow and Particle Deposition Simulations in Health and Emphysema: From In Vivo to In Silico Animal Experiments. Annals of biomedical engineering. 2013:1–16. doi: 10.1007/s10439-013-0954-8. [DOI] [PMC free article] [PubMed] [Google Scholar]
- PANDEY R, KHULLER GK. Solid lipid particle-based inhalable sustained drug delivery system against experimental tuberculosis. Tuberculosis. 2005;85:227–234. doi: 10.1016/j.tube.2004.11.003. [DOI] [PubMed] [Google Scholar]
- RADHAKRISHNAN R, UMA B, LIU J, AYYASWAMY PS, ECKMANN DM. Temporal multiscale approach for nanocarrier motion with simultaneous adhesion and hydrodynamic interactions in targeted drug delivery. Journal of Computational Physics. 2013;244:252–263. doi: 10.1016/j.jcp.2012.10.026. [DOI] [PMC free article] [PubMed] [Google Scholar]
- RONEY C, KULKARNI P, ARORA V, ANTICH P, BONTE F, WU A, MALLIKARJUANA N, MANOHAR S, LIANG HF, KULKARNI AR. Targeted nanoparticles for drug delivery through the blood–brain barrier for Alzheimer’s disease. Journal of Controlled Release. 2005;108:193–214. doi: 10.1016/j.jconrel.2005.07.024. [DOI] [PubMed] [Google Scholar]
- SANTRA S, DUTTA D, MOUDGIL BM. Functional dye-doped silica nanoparticles for bioimaging, diagnostics and therapeutics. Food and Bioproducts Processing. 2005;83:136–140. [Google Scholar]
- SCHROETER JD, KIMBELL JS, ASGHARIAN B, TEWKSBURY EW, SINGAL M. Computational fluid dynamics simulations of submicrometer and micrometer particle deposition in the nasal passages of a Sprague-Dawley rat. Journal of aerosol science. 2012;43:31–44. [Google Scholar]
- SHARAN M, POPEL AS. A two-phase model for flow of blood in narrow tubes with increased effective viscosity near the wall. Biorheology. 2001;38:415–428. [PubMed] [Google Scholar]
- SOHRABI S, YUNUS DE, XU J, YANG J, LIU Y. Characterization of nanoparticle binding dynamics in microcirculation using an adhesion probability function. Microvascular Research. 2016;108:41–47. doi: 10.1016/j.mvr.2016.07.005. [DOI] [PubMed] [Google Scholar]
- SOHRABI S, ZHENG J, FINOL EA, LIU Y. Numerical Simulation of Particle Transport and Deposition in the Pulmonary Vasculature. Journal of biomechanical engineering. 2014;136:121010. doi: 10.1115/1.4028800. [DOI] [PMC free article] [PubMed] [Google Scholar]
- SPILKER RL, FEINSTEIN JA, PARKER DW, REDDY VM, TAYLOR CA. Morphometry-based impedance boundary conditions for patient-specific modeling of blood flow in pulmonary arteries. Annals of biomedical engineering. 2007;35:546–559. doi: 10.1007/s10439-006-9240-3. [DOI] [PubMed] [Google Scholar]
- TAN J, KELLER W, SOHRABI S, YANG J, LIU Y. Characterization of Nanoparticle Dispersion in Red Blood Cell Suspension by the Lattice Boltzmann-Immersed Boundary Method. Nanomaterials. 2016;6:30. doi: 10.3390/nano6020030. [DOI] [PMC free article] [PubMed] [Google Scholar]
- TAWHAI MH, BURROWES KS, HOFFMAN EA. Computational models of structure–function relationships in the pulmonary circulation and their validation. Experimental physiology. 2006;91:285–293. doi: 10.1113/expphysiol.2005.030957. [DOI] [PubMed] [Google Scholar]
- TAWHAI MH, CLARK AR, BURROWES KS. Computational models of the pulmonary circulation: insights and the move towards clinically directed studies. Pulmonary circulation. 2011;1:224. doi: 10.4103/2045-8932.83452. [DOI] [PMC free article] [PubMed] [Google Scholar]
- TAWHAI MH, PULLAN A, HUNTER P. Generation of an anatomically based three-dimensional model of the conducting airways. Annals of biomedical engineering. 2000;28:793–802. doi: 10.1114/1.1289457. [DOI] [PubMed] [Google Scholar]
- THOMAS A, TAN J, LIU Y. Characterization of nanoparticle delivery in microcirculation using a microfluidic device. Microvascular research. 2014;94:17–27. doi: 10.1016/j.mvr.2014.04.008. [DOI] [PMC free article] [PubMed] [Google Scholar]
- VIDEIRA MA, BOTELHO MF, SANTOS AC, GOUVEIA LF, DE LIMA JJP, ALMEIDA AJ. Lymphatic Uptake of Pulmonary Delivered Radiolabelled Solid Lipid Nanoparticles. Journal of Drug Targeting. 2002;10:607–613. doi: 10.1080/1061186021000054933. [DOI] [PubMed] [Google Scholar]
- WALTERS DK, LUKE WH. A method for three-dimensional Navier–Stokes simulations of large-scale regions of the human lung airway. Journal of Fluids Engineering. 2010;132:051101. [Google Scholar]
- WANG S, ZHOU Y, TAN J, XU J, YANG J, LIU Y. Computational modeling of magnetic nanoparticle targeting to stent surface under high gradient field. Computational mechanics. 2014;53:403–412. doi: 10.1007/s00466-013-0968-y. [DOI] [PMC free article] [PubMed] [Google Scholar]
- YANG J, YU L, RENNIE MY, SLED JG, HENKELMAN RM. Comparative structural and hemodynamic analysis of vascular trees. American Journal of Physiology-Heart and Circulatory Physiology. 2010;298:H1249–H1259. doi: 10.1152/ajpheart.00363.2009. [DOI] [PubMed] [Google Scholar]
- ZHANG Z, KLEINSTREUER C, DONOHUEC JF, KIM CS. Comparison of micro- and nano-size particle depositions in a human upper airway model. Journal of Aerosol Science. 2005;36:211–233. [Google Scholar]
- ZHANG Z, KLEINSTREUER C, KIM CS. Airflow and nanoparticle deposition in a 16-generation tracheobronchial airway model. Annals of Biomedical Engineering. 2008;36:2095–2110. doi: 10.1007/s10439-008-9583-z. [DOI] [PubMed] [Google Scholar]
- ZHOU Y, SOHRABI S, TAN J, LIU Y. Mechanical Properties of Nanoworm Assembled by DNA and Nanoparticle Conjugates. Journal of Nanoscience and Nanotechnology. 2016;16:5447–5456. doi: 10.1166/jnn.2016.12068. [DOI] [PubMed] [Google Scholar]
Associated Data
This section collects any data citations, data availability statements, or supplementary materials included in this article.