

ABSTRACT
Cefiderocol, a novel parenteral siderophore cephalosporin, exhibits potent efficacy against most Gram-negative bacteria, including carbapenem-resistant strains. Since cefiderocol is excreted primarily via the kidneys, this study was conducted to develop a population pharmacokinetics (PK) model to determine dose adjustment based on renal function. Population PK models were developed based on data for cefiderocol concentrations in plasma, urine, and dialysate with a nonlinear mixed-effects model approach. Monte-Carlo simulations were conducted to calculate the probability of target attainment (PTA) of fraction of time during the dosing interval where the free drug concentration in plasma exceeds the MIC (Tf>MIC) for an MIC range of 0.25 to 16 μg/ml. For the simulations, dose regimens were selected to compare cefiderocol exposure among groups with different levels of renal function. The developed models well described the PK of cefiderocol for each renal function group. A dose of 2 g every 8 h with 3-h infusions provided >90% PTA for 75% Tf>MIC for an MIC of ≤4 μg/ml for patients with normal renal function, while a more frequent dose (every 6 h) could be used for patients with augmented renal function. A reduced dose and/or extended dosing interval was selected for patients with impaired renal function. A supplemental dose immediately after intermittent hemodialysis was proposed for patients requiring intermittent hemodialysis. The PK of cefiderocol could be adequately modeled, and the modeling-and-simulation approach suggested dose regimens based on renal function, ensuring drug exposure with adequate bactericidal effect.
KEYWORDS: cefiderocol, cephalosporin, dose adjustment, hemodialysis, modeling and simulation, pharmacodynamics, pharmacokinetics, population pharmacokinetics, renal function
INTRODUCTION
The novel parenteral siderophore cephalosporin cefiderocol (also known as S-649266), discovered by Shionogi & Co., Ltd., exhibits potent efficacy in vitro and in vivo against most Gram-negative bacteria, including carbapenem-resistant strains of Enterobacteriaceae, Pseudomonas aeruginosa, and Acinetobacter baumannii (1–4). Cefiderocol is being developed as a therapeutic drug for the treatment of carbapenem-resistant Gram-negative bacterial infections, including nosocomial pneumonia, bloodstream infections, and complicated urinary tract infection (cUTI).
For cefiderocol, which exhibits bactericidal activity dependent on the duration of action, the pharmacokinetics/pharmacodynamics (PK/PD) parameter most closely correlated with efficacy is the fraction of the dosing interval during which the free drug concentration in plasma exceeds the MIC (Tf>MIC) (5–7), as is the case for other cephalosporins (8, 9). In vivo animal infection models, including carbapenem-resistant strains of Enterobacteriaceae, P. aeruginosa, and A. baumannii, demonstrated a bacteriostatic effect at 40% to 70% Tf>MIC and a bactericidal effect (≥1-log reduction) at 55% to 80% Tf>MIC (5–7), as summarized in Table S1 in the supplemental material.
The safety, tolerability, and PK of cefiderocol were evaluated in two phase 1 studies in healthy subjects (10) and subjects with renal impairment (11). The study designs and the PK parameters are summarized in Tables S2 and S3 in the supplemental material, respectively. The PK of cefiderocol are linear in the dose range tested (100 to 2,000 mg). The terminal elimination half-life (t1/2,z) of cefiderocol was 1.98 to 2.74 h in healthy subjects. Cefiderocol is excreted mainly via the kidneys, with 60 to 70% of the dose in urine as the unchanged parent drug. The total clearance (CL) of cefiderocol was dependent on renal function, and the area under the plasma concentration-time curve (AUC) of cefiderocol increased with decreasing renal function. Approximately 60% of cefiderocol was removed by hemodialysis (HD) of 3 to 4 h. No accumulation was observed at 2 g every 8 h (q8h) in subjects with normal renal function. The 2-g q8h dose of cefiderocol for 10 days was generally well tolerated in healthy subjects, and no clinically significant adverse events were reported.
The presence of augmented renal function, or a hyperdynamic cardiovascular state as a consequence of a systemic inflammatory response resulting in increases in the glomerular filtration rate (GFR), has often been reported in critically ill patients (12). This increased clearance could lead to decreased exposure to cefiderocol, possibly resulting in decreased efficacy. Therefore, for a patient population with augmented renal function, decreasing the dose interval should maintain the target Tf>MIC.
In this study, a pharmacokinetic model to describe cefiderocol pharmacokinetics in subjects with various degrees of renal function was developed, and dose adjustments for patients with augmented and impaired renal function and patients requiring intermittent HD were determined based on exposure to cefiderocol and the probability of target attainment (PTA) for Tf>MIC.
RESULTS
Development of the HS model and selection of a standard dose regimen.
The development process for the healthy subject (HS) model is presented in Table S4 in the supplemental material. The estimated population PK parameters for healthy subjects are shown in Table 1. The 3-compartment model described the data better than the 2-compartment model. A proportional residual error was selected based on the objective function value (OBJ). Figure S1 in the supplemental material shows a visual predictive check (VPC) with a median prediction and a 90% prediction interval for the HS model. The HS model described well the plasma and urine concentrations of cefiderocol in healthy subjects. The predicted 5th percentile of urine concentration over 8 h after a 2-g single dose with 1-h infusion (>100 μg/ml) was much higher than the MIC range from 0.25 to 16 μg/ml. Figure 1 shows the PTA for 50% Tf>MIC or 75% Tf>MIC following 1 g q8h or 2 g q8h, each with a 1- or 3-h infusion. The PTA at 2 g q8h with a 1- or 3-h infusion was >90% for 50% Tf>MIC up to an MIC of 8 μg/ml and for 75% Tf>MIC up to an MIC of 4 μg/ml, while the PTA at 1 g q8h with a 3-h infusion was >90% for 50% Tf>MIC up to an MIC of 4 μg/ml and for 75% Tf>MIC up to an MIC of 2 μg/ml. The 2-g q8h dose could be considered a standard dose regimen against pathogens with MICs of ≤4 μg/ml where 98% of the target pathogens were susceptible.
TABLE 1.
Population PK parameters estimated for healthy subjects and subjects with renal impairment
| Parameter | HS model |
MDRD-eGFR modela |
CG-CLCR modelb |
|||
|---|---|---|---|---|---|---|
| Mean | % RSE | Mean | % RSE | Mean | % RSE | |
| Typical CL (liters/h) | 5.59 | 1.9 | 5.66 | 2.0 | 4.83 | 2.9 |
| First slope of renal function marker on CL (MDRD-eGFR or CG-CLCR of <100) | 0.00857 | 1.4 | 0.00880 | 1.6 | ||
| Second slope of renal function marker on CL (MDRD-eGFR or CG-CLCR of ≥100) | 0 | Fixed | 0.00404 | 17.9 | ||
| Typical V1 (liters) | 7.74 | 2.5 | 7.58 | 2.7 | 7.58 | 2.7 |
| Exponent of body wt on V1 | 0.571 | 11.3 | 0.575 | 16.5 | ||
| Q2 (liters/h) | 5.44 | 3.6 | 5.45 | 4.3 | 5.45 | 4.5 |
| Typical V2 (liters) | 5.36 | 2.9 | 5.54 | 2.5 | 5.54 | 2.5 |
| Exponent of body wt on V2 | 0.727 | 13.1 | 0.730 | 12.9 | ||
| Q3 (liters/h) | 0.0762 | 15.2 | 0.0971 | 15.9 | 0.0969 | 17.0 |
| V3 (liters) | 0.594 | 8.7 | 0.682 | 7.7 | 0.681 | 8.3 |
| Fraction of urinary recovery | 0.659 | 1.2 | —c | — | — | — |
| IIV for CL (% CV) | 12.0 | 37.2 | 17.3 | 18.3 | 11.9 | 18.7 |
| IIV for V1 (% CV) | 16.3 | 27.1 | 19.5 | 19.4 | 19.3 | 19.7 |
| IIV for V2 (% CV) | 9.7 | 34.1 | 14.1 | 42.7 | 14.2 | 42.6 |
| Proportional residual error in plasma (% CV) | 13.6 | 14.0 | 12.0 | 14.1 | 12.0 | 14.1 |
| Proportional residual error in urine (% CV) | 17.9 | 19.3 | — | — | — | — |
If MDRD-eGFR < 100 ml/min/1.73 m2, then CL = 5.66 × [1 + 0.00857 × (eGFR − 100)]; if MDRD-eGFR ≥ 100 ml/min/1.73 m2, then CL = 5.66; V1 = 7.58 × (body weight/70)0.571; V2 = 5.54 × (body weight/70)0.727.
If CG-CLCR < 100 ml/min, then CL = 4.83 × [1 + 0.00880 × (CLCR − 100)]; if CG-CLCR ≥ 100 ml/min, then CL = 4.83 × [1 + 0.00404 × (CLCR − 100)]; V1 = 7.58 × (body weight/70)0.575; V2 = 5.54 × (body weight/70)0.730.
—, urine concentration data for cefiderocol were not used for the modeling.
FIG 1.
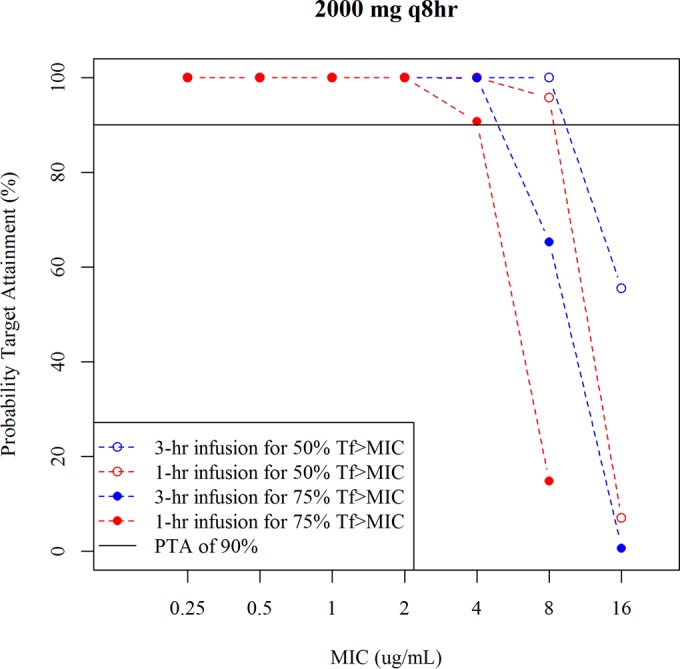
PTA for 50% Tf>MIC and 75% Tf>MIC using the healthy subject model.
Development of a covariate model.
The relationships between estimated glomerular filtration by the modification of diet in renal disease (MDRD-eGFR) and renal function based on estimated creatinine clearance (CLCR) (Cockcroft-Gault [CG]-CLCR) (see Fig. S2 in the supplemental material) suggest that CG-CLCR was generally higher than MDRD-eGFR. This difference further motivated the selection of the renal function markers for modeling and simulation. The relationships of empirical Bayes-estimated CL for the base model to MDRD-eGFR and CG-CLCR are shown in Fig. 2. Clear relationships of CL to MDRD-eGFR and to CG-CLCR were observed. Based on visual inspection from the relationship of CL to MDRD-eGFR and to CG-CLCR, the cutoff value for the piecewise linear model was determined to be an MDRD-eGFR of 100 ml/min/1.73 m2 or a CG-CLCR of 100 ml/min.
FIG 2.

Relationships of empirical Bayes-estimated CL for the base model to MDRD-eGFR or CG-CLCR. The solid line is a LOESS smoother line.
The estimated parameters of the covariate model with MDRD-eGFR are shown in Table 1. The incorporation of MDRD-eGFR into CL of the base model reduced the interindividual variability (IIV) for CL from 53.3% to 17.3%. The incorporation of body weight into the volume of distribution in the central compartment (V1) and in peripheral compartment 1 (V2) of the base model reduced the IIV for V1 from 24.2% to 19.5% and that for V2 from 22.0% to 14.1%. No further covariates on PK parameters were tested for model improvement because the IIV for PK parameters was sufficiently low (<20%) once MDRD-eGFR or CG-CLCR and body weight were incorporated in the model.
Goodness-of-fit plots for the covariate model with MDRD-eGFR are shown in Fig. S3 in the supplemental material. The results of VPC for the covariate model with MDRD-eGFR by renal function category are shown in Fig. S4 in the supplemental material. The covariate model with MDRD-eGFR described well the plasma cefiderocol concentrations for subjects with various degrees of renal impairment.
Body weight was a significant covariate on V1 and V2. Using 0.571 as a coefficient of body weight on V1, we calculated the ratios of V1 between body weight groups as 0.83 for 50 kg versus 70 kg and 1.15 for 90 kg versus 70 kg, suggesting that the effect of body weight on PK would be minimal.
The estimated parameters of the covariate model modified by incorporating CG-CLCR instead of MDRD-eGFR are shown in Table 1. The results of VPC for the covariate model with CG-CLCR in the CG-CLCR range of >90 to 200 ml/min are shown in Fig. S5 in the supplemental material.
Development of an HD model.
The estimated parameters of the hemodialysis (HD) model are shown in Table 2. The parameter estimates were reliable (relative standard error [RSE] of <30%) except for the variance for the residual error model of dialysate concentrations. The individual predicted and observed plots of plasma cefiderocol concentrations with or without HD for the subjects requiring intermittent HD are shown in Fig. S6 in the supplemental material. The developed model well described the plasma cefiderocol concentrations with or without a dialysis period. The individual predicted and observed plots of excretion ratios of cefiderocol in dialysate are shown in Fig. S7 in the supplemental material. The individual predictions for excretion ratios of cefiderocol in dialysate ranged from 48% to 65%, which was consistent with the observations (44% to 63%).
TABLE 2.
Population PK parameters estimated for the HD model
| Parameter | Mean | % RSE |
|---|---|---|
| CLHD (liters/h) | 7.37 | 4.6 |
| IIV for CLHD (% CV) | 12.7 | 29.3 |
| Proportional residual error in plasma (% CV) | 14.5 | 15.7 |
| Proportional residual error in dialysate (% CV) | 44.6 | 95.5 |
Simulations for renal impairment.
A summary of simulated cefiderocol exposure at the dose-adjusted regimens for patients with renal impairment is shown in Table 3. The dose-adjusted regimens provided daily AUCs for patients with renal impairment comparable to those in patients with normal renal function at 2 g q8h. The PTA for 75% Tf>MIC in the MIC range of 0.25 to 16 μg/ml at the adjusted dose regimen for each renal function category is shown in Fig. 3. The PTA for 75% Tf>MIC was >90% against an MIC of up to 4 μg/ml for all renal function groups using the dose-adjusted regimens.
TABLE 3.
Simulated Cmax and daily AUC at adjusted dose regimens by renal function group using the covariate model with MDRD-eGFR
| PK parameter | Median (90% prediction interval) for the following renal function group and adjusted dose regimena: |
||||
|---|---|---|---|---|---|
| Normal, 2 g q8h | Mild, 2 g q8h | Moderate, 1.5 g q8h | Severe, 1 g q8h | ESRD, 0.75 g q12h | |
| Cmax, μg/ml | 90.0 (71.8–111.6) | 105.4 (83.4–133.5) | 104.1 (78.8–134.3) | 95.4 (73.7–122.3) | 77.5 (61.6–97.5) |
| Daily AUC, μg · h/ml | 1,070 (814–1,410) | 1,344 (972–1,855) | 1,522 (1,046–2,154) | 1,599 (1,136–2,231) | 1,187 (857–1,671) |
Normal, subjects with MDRD-eGFR of ≥90 ml/min/1.73 m2; mild, subjects with MDRD-eGFR of 60 to <90 ml/min/1.73 m2; moderate, subjects with MDRD-eGFR of 30 to <60 ml/min/1.73 m2; severe, subjects with MDRD-eGFR of 15 to <30 ml/min/1.73 m2; ESRD, subjects with MDRD-eGFR of <15 ml/min/1.73 m2. The infusion time was 3 h.
FIG 3.
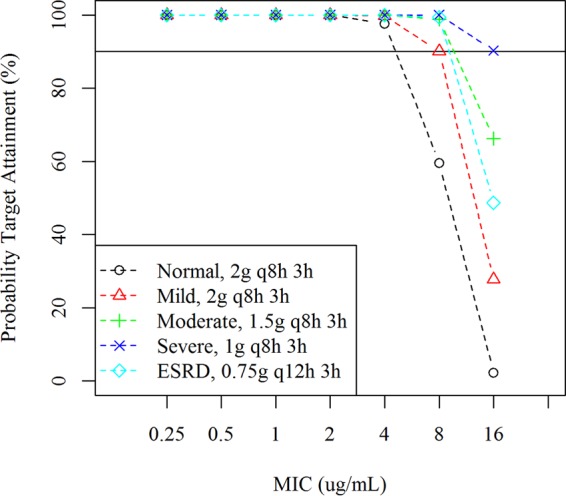
PTA for 75% Tf>MIC in patients with renal impairment using the covariate model with MDRD-eGFR. Normal, MDRD-eGFR of ≥90 ml/min/1.73 m2. Mild, MDRD-eGFR of 60 to <90 ml/min/1.73 m2. Moderate, MDRD-eGFR of 30 to <60 ml/min/1.73 m2. Severe, MDRD-eGFR of 15 to <60 ml/min/1.73 m2. ESRD, MDRD-eGFR of <15 ml/min/1.73 m2. PK steady state was assumed in the simulations. The infusion time was 3 h.
Simulations for augmented renal function.
The PTAs for 75% Tf>MIC for patients with normal function or augmented renal function considering original or inflated IIV are shown in Fig. 4. The PTA levels at a 2-g q6h dose with a 3-h infusion for patients with augmented renal function even for the inflated IIV were >90% against an MIC of up to 4 μg/ml, and those at a 2-g q8h dose with a 3-h infusion for patients with normal renal function for the original and inflated IIVs were almost 90% or >90% against an MIC of up to 4 μg/ml. The simulations suggested that 2 g q6h with a 3-h infusion could be used for critically ill patients with augmented renal function, while 2 g q8h with a 3-h infusion would be a standard dosage regimen for critically ill patients with normal renal function. The simulated maximum concentration in plasma (Cmax) and daily AUC at the 2-g q8h and 2-g q6h doses with a 3-h infusion in patients with normal renal function or augmented renal function are shown in Table 4. The 2-g q6h dose with a 3-h infusion provided daily AUC for patients with augmented renal function comparable to that for patients with normal renal function at 2 g q8h with a 3-h infusion.
FIG 4.

PTA for 75% Tf>MIC in patients with normal renal function and augmented renal function using the covariate model with CG-CLCR. Left panels, PTA with original IIV (10% to 20%). Right panels, PTA with inflated IIV (40%). PK steady state was assumed in the simulations. The infusion time was 3 h.
TABLE 4.
Simulated Cmax and daily AUC for patients with normal or augmented renal function at adjusted dose regimens using the covariate model with CG-CLCR
| Parameter | Median (90% prediction interval) for the following CG-CLCR (ml/min) and adjusted dose regimena |
||
|---|---|---|---|
| 90 to <120, 2 g q8h | 120 to <150, 2 g q6h | 150 to 200, 2 g q6h | |
| Cmax, μg/ml | 99.1 (84.4–117) | 95.1 (81.2–112) | 87.0 (72.6–102) |
| Daily AUC, μg · h/ml | 1,238 (1,007–1,535) | 1,450 (1,196–1,776) | 1,278 (1,037–1,560) |
With original IIV. The infusion time was 3 h.
Simulations for intermittent HD.
The simulated typical plasma cefiderocol concentration profiles at 0.75 g q12h with or without a supplemental dose of 0.75 g for patients receiving hemodialysis (HD) are shown in Fig. S8 in the supplemental material. The simulated Cmax and daily AUC are shown in Table 5. The simulated Cmax and AUC with the supplemental dose were similar to those for patients with normal renal function at 2 g q8h (Table 3). The PTA for 75% Tf>MIC for patients requiring intermittent HD is shown in Fig. 5. The 0.75-g q12h dose regimen without a supplemental dose (3-h infusion) provided >90% of PTA against an MIC of up to 8 μg/ml on the nondialysis day and against up to 1 μg/ml on the dialysis day. PTA on the dialysis day was improved with a supplemental dose of 0.75 g, with which the dose regimen provided >90% of PTA against an MIC of up to 16 μg/ml on the dialysis day.
TABLE 5.
Simulated Cmax and daily AUC for patients requiring intermittent HD at 0.75 g q12h with or without a supplemental dose
| Parameter | Median (90% prediction interval) ona: |
||
|---|---|---|---|
| Nondialysis day | Dialysis day |
||
| Without supplemental dose | With supplemental dose | ||
| Cmax, μg/ml | 77.2 (60.4–98.3) | 59.3 (49.2–72.3) | 89.1 (72.8–109) |
| Daily AUC, μg · h/ml | 1,189 (841.8–1,659) | 783.2 (608.1–998.7) | 1,211 (941–1,515) |
The infusion time was 3 h.
FIG 5.
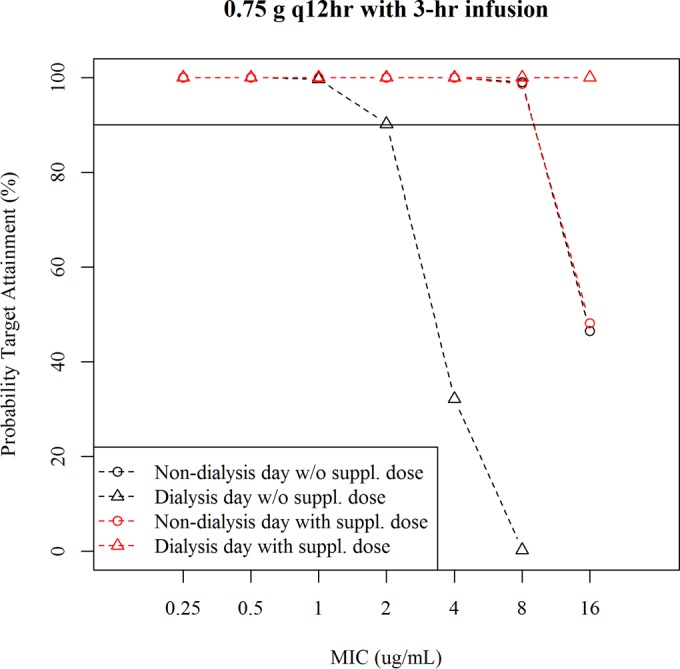
PTA for 75% Tf>MIC in patients requiring intermittent HD at a 0.75-g q12h dose with or without a supplemental dose The infusion time was 3 h.
Dose adjustment for patients with various degrees of renal function and subjects requiring intermittent HD.
The proposed dose regimens based on renal function to provide similar exposure to cefiderocol for the different renal function groups and subjects requiring intermittent hemodialysis with >90% PTA for 75% Tf>MIC against an MIC of ≤4 μg/ml are shown in Table 6.
TABLE 6.
Dose regimens based on renal function to provide similar cefiderocol exposure among renal function groups and >90% of PTA for 75% Tf>MIC against an MIC of ≤4 μg/ml
| Renal function | Dose regimen |
|---|---|
| Augmented (CG-CLCR, ≥120 ml/min) | 2 g q6h, 3-h infusion |
| Normal (MDRD-eGFR, ≥90 ml/min/1.73 m2) | 2 g q8h, 3-h infusion |
| Mild impairment (MDRD-eGFR, 60 to <90 ml/min/1.73 m2) | 2 g q8h, 3-h infusion |
| Moderate impairment (MDRD-eGFR, 30 to <60 ml/min/1.73 m2) | 1.5 g q8h, 3-h infusion |
| Severe impairment (MDRD-eGFR, 15 to <30 ml/min/1.73 m2) | 1 g q8h, 3-h infusion |
| ESRD (MDRD-eGFR, <15 ml/min/1.73 m2) | 0.75 g q12h, 3-h infusion |
| Requiring intermittent HD | 0.75 g q12h, 3-h infusiona |
A supplemental (third) dose of 0.75 g with a 3-h infusion is administered after the completion of intermittent HD on dialysis days.
DISCUSSION
Based on the antimicrobial susceptibility studies performed in iron-deficient medium, the MICs to inhibit 50% and 90% of the strains reported previously (1, 2) are summarized in Table S5 in the supplemental material. Out of 1,260 strains of the target pathogens (Pseudomonas aeruginosa, Acinetobacter baumannii, and Enterobacteriaceae) with MIC data available in these references (1, 2), 98% of the strains (1,233 strains) were susceptible to ≤4 μg/ml of cefiderocol. The 75% Tf>MIC demonstrated bactericidal efficacy in animal infection models (5–7). Based on human PK, the probability of achieving the target 75% Tf>MIC was >90% for microorganisms with an MIC of ≤4 μg/ml at the dose regimens proposed in Table 6.
The 2-g q8h dosing with a 3-h infusion was selected as the standard dose regimen in order to maximize the pharmacodynamics parameter. The simulation demonstrated that 2 g q8h with both 1- and 3-h infusions provided >90% PTA against an MIC of up to 4 μg/ml. The target patient population for cefiderocol includes critically ill patients. Regimens with prolonged infusion of β-lactam antibiotics are generally preferable, especially for critically ill patients, because β-lactam antibiotics show time-dependent antimicrobial activity. Therefore, 2 g q8h with a 3-h infusion was considered to be the optimal dose regimen for cefiderocol.
In critically ill patients, augmented renal function has often been reported and is typically seen in men less than 55 years of age with trauma, sepsis, burns, hematological malignant disease, or pancreatitis (12). Inflated PK variability was also reported for critically ill patients (12) and was considered for simulations in this study. For cefepime, ceftazidime, and doripenem, the unexplained variability (sum of interindividual variability and interoccasion variability) of the PK parameter was 58%, 30%, and 34% for CL and 67%, 35%, and 38% for V, respectively, in critically ill patients (13–15). In this study, a variability of 40% for CL, V1, and V2 was set as an additional condition to evaluate the effect of inflated PK variability on PTA for the target Tf>MIC for cefiderocol in critically ill patients. The simulation demonstrated that for patients with augmented renal function (CG-CLCR of ≥120 ml/min), 2 g q6h with a 3-h infusion provides >90% PTA against an MIC of up to 4 μg/ml even with inflated PK variability, with AUC comparable to that in patients with normal renal function at 2-g q8h dosing with a 3-h infusion. Efficacy and safety of cefiderocol for the critically ill patients would be expected.
CL of cefiderocol strongly correlated with renal function parameters (MDRD-eGFR and CG-CLCR), as expected. In healthy subjects, 60 to 70% of the dose was excreted into urine as unchanged cefiderocol. In subjects with impaired renal function, the AUC of cefiderocol increased with increasing severity of renal impairment (the AUC ratios in the mild, moderate, severe, and end-stage renal disease [ESRD] groups compared to the group with normal renal function were 1.0, 1.5, 2.5, and 4.1, respectively), while the Cmax of cefiderocol did not change with renal impairment (11).
Consistent with previous reports (16, 17), MDRD-eGFR was generally lower than CG-CLCR (see Fig. S2 in the supplemental material). For the modeling and for dose adjustment, MDRD-eGFR was mainly used as a renal function parameter, since the MDRD equation was reported to be widely recognized as providing more accurate estimates of GFR than the CG equation (18). On the other hand, there have been reports that CG-CLCR was closer to measured CLCR than the estimated GFR calculated with other equations, including the MDRD equation, for critically ill patients with augmented renal function (measured CLCR of >130 ml/min) (19). These factors were why the renal function markers for our modeling and simulation were different for augmented and impaired renal function.
MDRD-eGFR is standardized for a subject with a typical body surface area (BSA) (unit of ml/min/1.73 m2), and therefore, MDRD-eGFR may be adjusted using the individual BSA (unit of ml/min). In this study, MDRD-eGFR was used without BSA adjustment because the BSA-adjusted value based on the equation reported by Mosteller (20) (median, 99; range, 5 to 144 ml/min) was similar to the MDRD-eGFR without the adjustment (median, 99; range, 4 to 146 ml/min/1.73 m2) in this study. Adjustment of MDRD-eGFR using individual BSAs might be needed for obese patients or underweight patients.
Cefiderocol was significantly removed by intermittent HD (approximately 60% of cefiderocol by HD of 3 to 4 h) (11). The modeling and simulation for intermittent hemodialysis described the significant effect of intermittent HD on the PK of cefiderocol well and suggested the need of supplemental dose immediately after intermittent HD to provide >90% of PTA against an MIC of up to 4 μg/ml. A supplemental dose after HD has been used for other cephalosporins, such as ceftaroline and ceftolozane, which are also hemodialyzable (21, 22).
In conclusion, our model described well the PK of cefiderocol. In the modeling, renal function was a clinically meaningful factor for cefiderocol PK, as expected. The modeling-and-simulation approach suggests that the dose-adjusted regimens based on renal function are expected to provide therapeutic drug exposure and adequate bactericidal effect in all subjects according to their specific level of renal function.
MATERIALS AND METHODS
Data.
Plasma, urine, and dialysate concentration data for cefiderocol in two phase 1 studies were used for the modeling.
The initial study was a single- and multiple-ascending dose study conducted in 49 Japanese and 5 Caucasian healthy subjects (10). The 1,348 plasma and 276 urine concentration data points for cefiderocol following single (100- to 2,000-mg) or multiple (1,000- and 2,000-mg q8h) 1-hour intravenous infusions were used for the modeling.
The renal impairment phase 1 study was a single-dose study conducted in the United States to assess the effect of renal function on the PK of cefiderocol (11). Thirty-eight subjects meeting the eligibility criteria with mild (60 to <90 ml/min/1.73 m2), moderate (30 to <60 ml/min/1.73 m2), or severe (<30 ml/min/1.73 m2) renal impairment based on estimated glomerular filtration by the modification of diet in renal disease (MDRD-eGFR) (16) criteria or with end-stage renal disease (ESRD) undergoing HD and a matched control group of healthy subjects with normal renal function (≥90 ml/min) based on estimated creatinine clearance (Cockcroft-Gault [CG-CLCR] criteria [23]) were enrolled in the respective cohorts. The data obtained from 37 subjects with normal renal function (8 subjects), mild (8 subjects), moderate (7 subjects), or severe (6 subjects) renal impairment, or ESRD requiring hemodialysis (8 subjects) were used for the modeling. The 633 plasma and 30 dialysate concentration data points following a 1,000-mg single 1-hour intravenous infusion were used (513 plasma data points for the covariate modeling and 245 plasma and 30 dialysate data points for the HD modeling). The subjects requiring intermittent HD (3 to 4 h of HD) received 2 dosing sessions: the first dose was administered after an HD session (period 1, without HD), and the second dose was administered following at least a 72-hour washout and was given approximately 2 h prior to the subject's HD session (period 2, with HD).
Table 7 shows the background characteristics of the subjects.
TABLE 7.
Background characteristics of subjects in the data set
| Study and characteristic | Mean (SD) | Median (range) |
|---|---|---|
| SAD/MAD studya (n = 54) | ||
| Age, yr | 30.7 (9.7) | 27.5 (20–60) |
| Body wt, kg | 63.9 (8.3) | 62.6 (45.1–91.0) |
| MDRD-eGFR, ml/min/1.73 m2 | 110.4 (16.5) | 109.5 (76–146) |
| CG-CLCR, ml/min | 138.2 (24.5) | 137.5 (75–185) |
| Sex, no. male/no. female | 51/3 | |
| Ethnicity, no. Japanese/no. Caucasian | 49/5 | |
| Renal impairment study (n = 37) | ||
| Age, yr | 55.0 (10.8) | 53.0 (27–74) |
| Body wt, kg | 87.3 (17.6) | 85.2 (54.4–124.1) |
| MDRD-eGFR, ml/min/1.73 m2 | 51.2 (35.2) | 55 (4–124) |
| CG-CLCR, ml/min | 64.5 (40.1) | 68 (7–136) |
| Sex, no. male/no. female | 24/13 | |
| Ethnicity, no. Japanese/no. other | 0/37 | |
| Both studies (n = 91) | ||
| Age, yr | 40.6 (15.7) | 36 (20–74) |
| Body wt, kg | 73.4 (17.3) | 68.4 (45.1–124.1) |
| MDRD-eGFR, ml/min/1.73 m2 | 86.3 (38.9) | 99 (4–146) |
| CG-CLCR, ml/min | 108.3 (48.2) | 121 (7–185) |
| Sex, no. male/no. female | 75/16 | |
| Ethnicity, no. Japanese/no. other | 49/42 | |
SAD/MAD, single- and multiple-ascending dose.
Bioanalysis method.
The composite samples were prepared by treating each matrix (plasma, urine, and dialysate) with a buffer (0.2 mol/liter ammonium acetate, pH 5) at a 1:1 ratio by volume and used for measurement of cefiderocol concentrations. The cefiderocol concentrations were determined using a validated high-performance liquid chromatography–tandem mass spectrometry (LC/MS/MS) assay. The lower limits of quantification of cefiderocol in plasma, urine, and dialysate were 0.1, 1, and 0.05 μg/ml, respectively.
Population pharmacokinetic analyses. (i) Model development for healthy subjects.
A population PK model for healthy subjects was developed based on the plasma and urine concentration data for cefiderocol following single or multiple intravenous infusions in an initial phase 1 study. Two- and three-compartment disposition models with an output compartment were tested. The parameters of the 3-compartment model with an output compartment, which was selected as a healthy subject (HS) model, were CL, volumes of distribution in the central compartment (V1), peripheral compartment 1 (V2), and peripheral compartment 2 (V3), intercompartmental clearances from the central compartment to peripheral compartment 1 (Q2) and from the central compartment to peripheral compartment 2 (Q3), and fraction of urine excretion for total clearance (F4). The interindividual variability (IIV) for PK parameters except F4 was initially assumed to follow a log-normal distribution and an exponential error model. For intraindividual (residual) variability, a combination error model (an additive error plus proportional error model) was initially tested, and then a proportional error model was tested.
(ii) Covariate modeling.
Covariate modeling to describe the effect of renal impairment on cefiderocol PK was performed based on plasma concentrations from both the healthy and renally impaired subjects in the 2 studies, excluding the data with HD for subjects requiring HD.
Based on the HS model, a 3-compartment disposition model was used as a base model. The covariate test was as follows. First, the effect of MDRD-eGFR, which was reported to be a more accurate estimate of renal function than CG-CLCR (16) and was used for categorization of renal function in the renal impairment study, was tested on CL because cefiderocol is excreted mainly via the kidneys. The effect of MDRD-eGFR on CL was incorporated using three models (a linear model, a piecewise linear model, and a power model). Next, the effect of body weight on V1 and V2 was tested by using a power model because body weight is generally an influential factor on PK from the physiological viewpoint.
For modeling to predict PK in patients with augmented renal function, the PK model developed using MDRD-eGFR was modified to incorporate CG-CLCR instead of MDRD-eGFR because there have been reports that determination of renal function by CG-CLCR is more accurate than that by MDRD-eGFR in the range of high GFR (e.g., ≥120 ml/min) (19). The same covariate test described above was conducted using CG-CLCR instead of MDRD-eGFR.
The model to describe the relationship of renal function to CL and the inclusion of body weight for V1 and V2 were selected based on the objective function value (OBJ) in NONMEM at the significance level of P < 0.01 (6.63 at a difference with one degree of freedom).
(iii) HD modeling.
The covariate model with MDRD-eGFR was modified to describe cefiderocol removal during HD. Clearance with HD (CLHD) was incorporated into total clearance as given by the equation CL = CLSUBJ + CLHD, where CL is total clearance for cefiderocol, CLSUBJ is clearance mainly via the kidneys in the subject, and CLHD is clearance by HD. The interindividual variability for CLHD was considered using the exponential error model.
The typical values of CLHD, the interindividual variability for CLHD, and the intraindividual variability were estimated from cefiderocol concentrations in plasma and dialysate for 8 subjects receiving intermittent HD. In the estimation, the other parameters were fixed to the parameter estimates of the covariate model with MDRD-eGFR.
(iv) Dose adjustment for patients with various degrees of renal function and patients requiring intermittent HD.
To establish a dose regimen for patients with normal renal function (i.e., a standard dose regimen), PTA values for 50% Tf>MIC and 75% Tf>MIC as the target Tf>MIC for bacteriostatic and bactericidal effects, respectively, from the animal infection models (5–7) were calculated by Monte Carlo simulation using the HS model with an unbound fraction (fu) of 0.422 at 1 g q8h or 2 g q8h with a 1-h or 3-h infusion. In the calculation, the MIC range was set to 0.25 to 16 μg/ml, which included 4 μg/ml, where 98% of the target pathogens were susceptible (1, 2).
Dose regimens for patients with impaired renal function were adjusted for each renal function group (mild, moderate, severe, and ESRD based on MDRD-eGFR) to provide a daily AUC comparable to that observed in the normal renal function group at 2 g q8h, which was considered to be a standard dose regimen. The AUC estimated using noncompartmental analysis in the renal impairment study (11) was used for the adjustment. The PTA for 75% Tf>MIC, maximum plasma concentration (Cmax), and AUC at the adjusted dose regimen were simulated using the covariate model with MDRD-eGFR.
For simulations of PK in patients with augmented renal function, the covariate model with CG-CLCR was used. Dose adjustment was defined for patients with augmented renal function because renal excretion of cefiderocol is likely to be enhanced in those patients. Monte Carlo simulation was performed to calculate the PTA for 75% Tf>MIC for 2 g q8h or 2 g q6h with a 3-h infusion for an MIC range of 0.25 to 16 μg/ml for patients with normal renal function (CG-CLCR of 90 to <120 ml/min) or augmented renal function (120 to <150 and 150 to 200 ml/min). In addition, simulations were also performed with IIV inflated to 40% for CL and V1 (original IIV of 10% to 20%), because inflation of PK variability has been reported for critically ill patients (13–15).
Simulations for patients requiring intermittent HD were performed with 4-h HD initiating at 1 h after the end of the regular morning infusion on days 1 and 4, assuming a three-times-a-week HD regimen. Cmax and AUC were calculated on the nondialysis day (day 3) and the dialysis day (day 4), and Tf>MIC was calculated for the period of 0 to 12 h after the morning dose on both the nondialysis day and the dialysis day. The dose regimen of 0.75 g q12h with a 3-h infusion was tested with or without a supplemental dose of 0.75 g infused immediately after the HD session.
In the Monte Carlo simulation, 1,000 virtual patients were simulated for each scenario. PK steady state was assumed in the simulations. Body weight was assumed to be log-normally distributed with a geometric mean of 70 kg and a coefficient of variation (CV) of 20%. The protein binding rates in plasma at 1 and 8 h after the start of infusion were comparable among different renal function groups in the renal impairment study (11). Therefore, the change of the unbound fraction with varying renal function was not considered for the simulations.
Model evaluation.
All PK models were evaluated based on goodness-of-fit plots. A visual predictive check (VPC) (24) was performed to evaluate selected models.
Software.
NONMEM version 7.3 (25) was used to estimate population PK parameters by the first-order conditional estimation with interaction and to execute simulations. Perl-speaks NONMEM version 4.2.0 (26) was used to execute the NONMEM run. R version 3.0.2 (27) was used to calculate PTA for Tf>MIC, Cmax, and AUC based on simulated plasma concentrations and to create graphics.
Supplementary Material
ACKNOWLEDGMENTS
This study was supported by Shionogi.
T.K., T.W., and T.I. are employees of Shionogi & Co., Ltd. J.C.A.F. is an employee of Shionogi Inc. R.E. is a consultant to Shionogi.
Footnotes
Supplemental material for this article may be found at https://doi.org/10.1128/AAC.01381-16.
REFERENCES
- 1.Ito A, Kohira N, Bouchillon SK, West J, Rittenhouse S, Sader HS, Rhomberg PR, Jones RN, Yoshizawa H, Nakamura R, Tsuji M, Yamano Y. 2016. In vitro antimicrobial activity of S-649266, a catechol substituted siderophore cephalosporin, when tested against non-fermenting gram-negative bacteria. J Antimicrob Chemother 71:1–12. doi: 10.1093/jac/dkv402. [DOI] [PubMed] [Google Scholar]
- 2.Kohira N, West J, Ito A, Ito-Horiyama T, Nakamura R, Sato T, Rittenhouse S, Tsuji M, Yamano Y. 2015. In vitro antimicrobial activity of a siderophore cephalosporin, S-649266, against Enterobacteriaceae clinical isolates, including carbapenem-resistant strains. Antimicrob Agents Chemother 60:729–734. doi: 10.1128/AAC.01695-15. [DOI] [PMC free article] [PubMed] [Google Scholar]
- 3.Ito A, Toba S, Nishikawa T, Oota M, Kanazawa S, Fukuhara N, Yamaguchi T, Nakamura R, Tsuji M, Yamano Y. 2015. S-649266, a novel siderophore cephalosporin: binding affinity to PBP and in vitro bactericidal activity, abstr ECCMID-1871 Abstr 25th Eur Cong Clin Microbiol Infect Dis. [Google Scholar]
- 4.Nakamura R, Toba S, Tsuji M, Yamano Y, Shimada J. 2014. A novel siderophore cephalosporin. IV. In vivo efficacy in various murine infection models, abstr F-1558 Abstr 54th Intersci Conf Antimicrob Agents Chemother. [Google Scholar]
- 5.Nakamura R, Toba S, Ito A, Tsuji M, Yamano Y, Shimada J. 2014. A novel siderophore cephalosporin. V. Pharmacodynamic assessment in murine thigh infection models, abstr F-1559 Abstr 54th Intersci Conf Antimicrob Agents Chemother. [DOI] [PMC free article] [PubMed] [Google Scholar]
- 6.Horiyama T, Toba S, Nakamura R, Tsuji M, Yamano Y, Shimada J. 2014. A novel siderophore cephalosporin. VI. Magnitude of PK/PD parameter required for efficacy in murine lung infection model, abstr F-1560 Abstr 54th Intersci Conf Antimicrob Agents Chemother. [Google Scholar]
- 7.Horiyama T, Toba S, Nakamura R, Tsuji M, Yamano Y, Shimada J. 2014. A novel siderophore cephalosporin. VII. Magnitude of PK/PD parameter required for efficacy in murine thigh infection model, abstr F-1561 Abstr 54th Intersci Conf Antimicrob Agents Chemother. [Google Scholar]
- 8.Craig WA. 1995. Interrelationship between pharmacokinetics and pharmacodynamics in determining dosage regimens for broad-spectrum cephalosporins. Diagn Microbiol Infect Dis 22:89–96. doi: 10.1016/0732-8893(95)00053-D. [DOI] [PubMed] [Google Scholar]
- 9.Craig WA. 1998. Pharmacokinetic/pharmacodynamic parameters: rationale for antibacterial dosing of mice and men. Clin Infect Dis 26:1–12. doi: 10.1086/516284. [DOI] [PubMed] [Google Scholar]
- 10.Shimada J, Saisho Y, Katsube T, White S, Fukase H. 2014. S-649266, a novel siderophore cephalosporin for gram negative bacterial infections: pharmacokinetics, safety and tolerability in healthy subjects, abstr F-1564 Abstr 54th Intersci Conf Antimicrob Agents Chemother. [DOI] [PMC free article] [PubMed] [Google Scholar]
- 11.Echols R, Katsube T, Arjona Ferreira JC, Krenz HK. 2015. S-649266, a siderophore cephalosporin for gram negative bacterial infection: pharmacokinetics and safety in subjects with renal impairment, abstr ECCMD-1174. Abstr 25th Eur Cong Clin Microbiol Infect Dis. [DOI] [PMC free article] [PubMed] [Google Scholar]
- 12.Roberts JA, Abdul-Aziz MH, Lipman J, Mouton JW, Vinks AA, Felton TW, Hope WW, Farkas A, Neely MN, Schentag JJ, Drusano G, Frey OR, Theuretzbacher U, Kuti JL, International Society of Anti-Infective Pharmacology and the Pharmacokinetics and Pharmacodynamics Study Group of the European Society of Clinical Microbiology and Infectious Diseases. 2014. Individualised antibiotic dosing for patients who are critically ill: challenges and potential solutions. Lancet Infect Dis 14:498–509. doi: 10.1016/S1473-3099(14)70036-2. [DOI] [PMC free article] [PubMed] [Google Scholar]
- 13.Nandy P, Samtani MN, Lin R. 2010. Population pharmacokinetics of doripenem based on data from phase 1 studies with healthy volunteers and phase 2 and 3 studies with critically ill patients. Antimicrob Agents Chemother 54:2354–2359. doi: 10.1128/AAC.01649-09. [DOI] [PMC free article] [PubMed] [Google Scholar]
- 14.Georges B, Conil JM, Seguin T, Dieye E, Cougot P, Decun JF, Lavit M, Samii K, Houin G, Saivin S. 2008. Cefepime in intensive care unit patients: validation of a population pharmacokinetic approach and influence of covariables. Int J Clin Pharmacol Ther 46:157–164. doi: 10.5414/CPP46157. [DOI] [PubMed] [Google Scholar]
- 15.Georges B, Conil JM, Seguin T, Ruiz S, Minville V, Cougot P, Decun JF, Gonzalez H, Houin G, Fourcade O, Saivin S. 2009. Population pharmacokinetics of ceftazidime in intensive care unit patients: influence of glomerular filtration rate, mechanical ventilation, and reason for admission. Antimicrob Agents Chemother 53:4483–4489. doi: 10.1128/AAC.00430-09. [DOI] [PMC free article] [PubMed] [Google Scholar]
- 16.Levey AS, Coresh J, Greene T, Stevens LA, Zhang YL, Hendriksen S, Kusek JW, Van Lente F, Chronic Kidney Disease Epidemiology Collaboration. 2006. Using standardized serum creatinine values in the modification of diet in renal disease study equation for estimating glomerular filtration rate. Ann Intern Med 145:247–254. doi: 10.7326/0003-4819-145-4-200608150-00004. [DOI] [PubMed] [Google Scholar]
- 17.Lin J, Knight EL, Hogan ML, Singh AK. 2003. A comparison of prediction equations for estimating glomerular filtration rate in adults without kidney disease. J Am Soc Nephrol 14:2573–2580. doi: 10.1097/01.ASN.0000088721.98173.4B. [DOI] [PubMed] [Google Scholar]
- 18.Stevens LA, Nolin TD, Richardson MM, Feldman HI, Lewis JB, Rodby R, Townsend R, Okparavero A, Zhang YL, Schmid CH, Levey AS, Chronic Kidney Disease Epidemiology Collaboration. 2009. Comparison of drug dosing recommendations based on measured GFR and kidney function estimating equations. Am J Kidney Dis 54:33–42. doi: 10.1053/j.ajkd.2009.03.008. [DOI] [PMC free article] [PubMed] [Google Scholar]
- 19.Baptista JP, Udy AA, Sousa E, Pimentel J, Wang L, Roberts JA, Lipman J. 2011. A comparison of estimates of glomerular filtration in critically ill patients with augmented renal clearance. Crit Care 15:R139. doi: 10.1186/cc10262. [DOI] [PMC free article] [PubMed] [Google Scholar]
- 20.Mosteller RD. 1987. Simplified calculation of body-surface area. N Engl J Med 317:1098. [DOI] [PubMed] [Google Scholar]
- 21.U.S. FDA. Teflaro (ceftaroline fosamil) for injection: US prescribing information. FDA, Washington, DC. [Google Scholar]
- 22.U.S. FDA. Zerbaxa (ceftolozane/tazobactam) for injection: US prescribing information. FDA, Washington, DC. [Google Scholar]
- 23.Cockcroft DW, Gault MH. 1976. Prediction of creatinine clearance from serum creatinine. Nephron 16:31–41. doi: 10.1159/000180580. [DOI] [PubMed] [Google Scholar]
- 24.Holford NH. 2005. The visual predictive check—superiority to standard diagnostic (Rorschach) plots, abstr 738. PAGE 14 www.page-meeting.org/?abstr=738.
- 25.Beal SL, Sheiner LB, Boeckmann AJ. 1989-2006. NONMEM users guide. Icon Development Solutions, Ellicott City, MD. [Google Scholar]
- 26.Lindbom L, Pihlgren P, Jonsson EN. 2005. PsN-Toolkit—a collection of computer intensive statistical methods for non-linear mixed effect modeling using NONMEM. Comput Methods Programs Biomed 79:241–257. doi: 10.1016/j.cmpb.2005.04.005. [DOI] [PubMed] [Google Scholar]
- 27.R Core Team. 2013. R: a language and environment for statistical computing. R Foundation for Statistical Computing, Vienna, Austria. [Google Scholar]
Associated Data
This section collects any data citations, data availability statements, or supplementary materials included in this article.