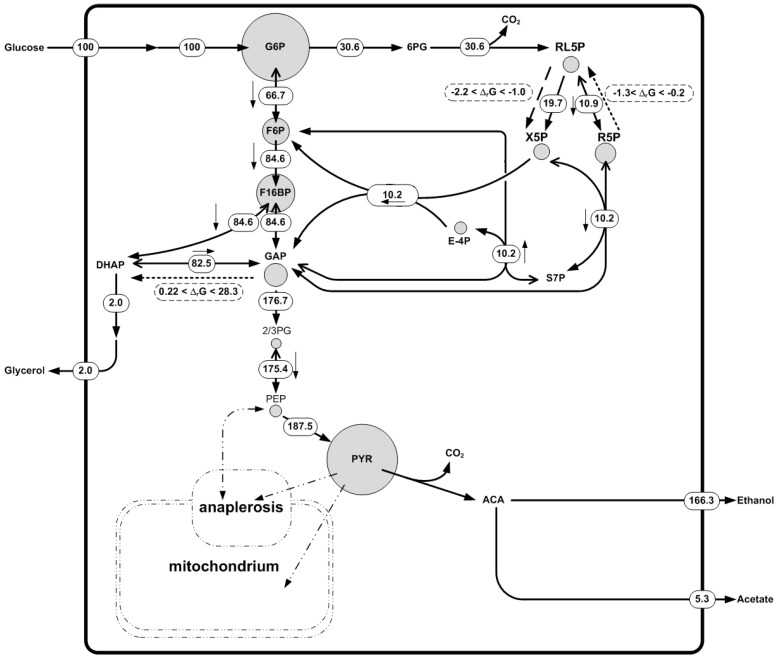
Figure 5.
Intracellular metabolite concentrations and metabolic fluxes in Saccharomyces cerevisiae S288C during growth on glucose and glutamate as carbon sources in continuous culture. The dilution rate is 0.29. Metabolite concentrations are represented as circles corresponding to their concentration in [μmol/gCDW]. Concentrations were set equal to mm2. After back-calculating to the radius of the circle, the 10-fold radius was used to create the circles in the figure. Net fluxes are presented. In the case of reversible reactions, depicted by a double arrow, the net direction is indicated with a small arrow next to the flux value. ΔrG values were predicted by using NExT. Dashed lines indicate flux direction based on thermodynamic modelling. Dotted lines show the predicted flux direction by the thermodynamic modelling contradicted by 13C fluxomics where ΔrG is close to zero. For simplification, only a small section of the network is shown and for clarity some fluxes are omitted. Each metabolite node is balanced in the full network.

