

Abstract
Albumin concentration and body weight are altered in patients with multidrug‐resistant tuberculosis (MDR‐TB) and change during the long treatment period, potentially affecting drug disposition. We here describe the pharmacokinetics (PKs) of the novel anti‐TB drug bedaquiline and its metabolite M2 in 335 patients with MDR‐TB receiving 24 weeks of bedaquiline on top of a longer individualized background regimen. Semiphysiological models were developed to characterize the changes in weight and albumin over time. Bedaquiline and M2 disposition were well described by three and one‐compartment models, respectively. Weight and albumin were correlated, typically increasing after the start of treatment, and significantly affected bedaquiline and M2 plasma disposition. Additionally, age and race were significant covariates, whereas concomitant human immunodeficiency virus (HIV) infection, sex, or having extensively drug‐resistant TB was not. This is the first population model simultaneously characterizing bedaquiline and M2 PKs in its intended use population. The developed model will be used for efficacy and safety exposure‐response analyses.
Study Highlights.
WHAT IS THE CURRENT KNOWLEDGE ON THE TOPIC?
☑ Population PKs of bedaquiline, a highly protein bound anti‐TB drug, has previously been described.
WHAT QUESTION DID THIS STUDY ADDRESS?
☑ How can the population PKs of bedaquiline's M2 metabolite be described in patients with MDR‐TB? ☑ How does body weight and albumin concentration change after initiation of anti‐TB treatment and how does this impact bedaquiline and M2 PKs? ☑ What other covariates are relevant for bedaquiline and/or M2 PKs?
WHAT THIS STUDY ADDS TO OUR KNOWLEDGE
☑ The first characterization of M2 population PKs in patients with MDR‐TB. ☑ Knowledge of the dynamics of body weight and albumin over time after the start of anti‐TB treatment, which should be considered also for other anti‐TB drugs. ☑ Characterization of the impact of covariates on bedaquiline and M2 PKs.
HOW MIGHT THIS CHANGE DRUG DISCOVERY, DEVELOPMENT, AND/OR THERAPEUTICS?
☑ The model enables exposure‐response analysis for bedaquiline's effect on the TB infection and M2's suspected effect on QT‐prolongation. Once exposure‐response relationships are established, dosing can be optimized.
Bedaquiline has recently gained regulatory approval for treatment of multidrug‐resistant tuberculosis (MDR‐TB) based on results from phase II trials.1 Although much remains to be shown regarding its safety and optimal use,2 the approval of bedaquiline is a very welcome event as new treatment options are urgently needed. During the preceding 4 decades, no new classes of anti‐tuberculosis (TB) drugs were introduced and, in the same time period, the alarming increase of drug‐resistant TB strains took off. In the year 2000, the estimated number of new MDR‐TB cases, defined as cases with Mycobacterium tuberculosis strains resistant to at least rifampicin and isoniazid, important components of the old but efficient first‐line TB treatment, was 273,000 globally,3 whereas, in 2014, it had increased to 480,000.4 The current second‐line TB therapy used for MDR‐TB is exceedingly long (commonly 18–24 months), has serious side effects,5 and unacceptable low success rates; on average 50%.4
Bedaquiline is a diarylquinoline with a novel mechanism of action inhibiting the mycobacterial adenosine triphosphate synthase and thereby disrupting the bacteria's energy metabolism.6, 7 Phase II trials with bedaquiline added to a background regimen of second‐line TB drugs demonstrated that bedaquiline significantly decreased the time to sputum culture conversion and increased the proportion of patients with negative cultures at 120 weeks.8, 9, 10 Safety concerns regarding bedaquiline include its ability to cause moderate QT‐prolongation and the unexplained increase in late mortality observed in one randomized phase II trial.1, 11 The approved regimen of bedaquiline consists of a 2‐week loading phase of 400 mg daily, and thereafter 200 mg three times weekly until week 24.12
The pharmacokinetic (PK) profile of bedaquiline is characterized by extensive tissue distribution and an extremely long terminal half‐life of >5 months.13 Bedaquiline primarily undergoes N‐demethylation catalyzed by the cytochrome P450 (CYP) 3A4 enzyme and forms a three to sixfold less active metabolite, M2.10, 14 M2 circulates at 10‐fold lower concentrations than bedaquiline but may have a higher risk of causing toxicity and is, therefore, important to describe.15, 16, 17 In preclinical tests, M2 was found to be a stronger inducer of phospholipidosis and more cytotoxic than bedaquiline.15 M2 concentrations have also been associated with QT‐prolongation.17 M2 is further N‐demethylated, likely primarily by the same enzyme.10, 18 The renal excretion of bedaquiline has been shown to be negligible, but fecal excretion occurs.13 Both bedaquiline and M2 are highly protein bound, >99.9% and >99.7%, respectively.13
An overview of existing knowledge on bedaquiline PKs was recently published,13 and two population PK models are currently available. The first model was developed to characterize the interaction effect of the antiretroviral efavirenz on bedaquiline, M2, and M3 PKs based on single‐dose data from a phase I trial in healthy volunteers,18 and the same model has also been applied for characterization of other drug‐drug interactions.19, 20 The second model describes bedaquiline PKs and was developed on combined data from a large number of phase I and II trials, including several drug formulations, healthy volunteers, and patients with drug‐sensitive‐TB, and MDR‐TB, and multiple centers globally.21 The exposure‐response relationships for bedaquiline and M2 are generally poorly characterized. The aim of the current analysis was to alleviate the lack of a population PK model describing both bedaquiline and M2 in patients with MDR‐TB during long‐term treatment, and to perform a comprehensive covariate analysis specifically within the MDR‐TB patient population intended to use bedaquiline. The model should be applicable for PK‐pharmacodynamic analyses of efficacy as well as safety, and for clinical trial simulations of pediatric studies.
METHODS
Patient population and study design
Data were obtained from two phase IIb studies called C208 and C209 (TMC207‐C208, ClinicalTrials.gov number NCT00449644 and TMC207‐C209, ClinicalTrials.gov number NCT00910871) shared to the PreDiCT‐TB consortium. The bedaquiline data from both studies were included in the database used in the development of one of the published bedaquiline PK models,21 and the treatment outcomes have been presented elsewhere.8, 9, 22
C208 was a randomized, double‐blind, placebo‐controlled study enrolling newly diagnosed patients with pulmonary MDR‐TB between 18 and 65 years of age. Subjects with human immunodeficiency virus (HIV) infection having a CD4+ count bellow 300 cells/µl or receiving antiretroviral therapy were excluded from the study. The study was divided into two groups encompassing 8 weeks (stage 1) or 24 weeks (stage 2) of interventional treatment. Patients were randomized to receive either bedaquiline or placebo on top of a preferred background regimen of five second‐line anti‐TB drugs.9 Bedaquiline was administered orally and the regimen consisted of 400 mg daily during the first 2 weeks, thereafter 200 mg three times per week. Blood samples for full PK profiles (predose and 1, 3, 5, 6, 8, 12, and 24 hours after dose) were drawn after the last doses of weeks 2 and 8 for all patients in stage 1 and after the last doses of weeks 2 and 24 for a subset of patients in stage 2. Additional predose samples were collected five to seven times throughout the treatment period and samples were also collected during the follow‐up period, which lasted 96 weeks after the end of bedaquiline/placebo treatment. Body weight and albumin concentrations were measured every second week during the treatment period, every fourth week until week 36 after the start of treatment, and thereafter every third month until the end of the follow‐up period.
C209 was an open‐label study enrolling newly diagnosed adult patients with pulmonary MDR‐TB or extensively drug‐resistant‐TB. Subjects with HIV infection were allowed to participate if their CD4+ count was above 250 cells/µl and met the requirement regarding allowed antiretroviral treatment specified in the protocol. The patients received 24 weeks of bedaquiline treatment on top of an individualized background and with the same dosing regimen as in C208. The patients could have started the background therapy earlier than the bedaquiline treatment. Blood samples were drawn 1 hour before intake of bedaquiline at weeks 2, 12, and 24 of treatment. Body weight and albumin concentrations were measured at the start of treatment, at weeks 4, 12, and 24 after the start of treatment, and every third month during the 96‐week follow‐up period.
Patients were asked to take their medication together with water after breakfast and intake was supervised with directly observed therapy, according to national guidelines. Concomitant medications with potential to induce or inhibit CYP3A4 were not permitted. The trials were conducted in accordance with the Good Clinical Practice standards and received ethical approval from the appropriate local authorities.
Chemical analysis
Bedaquiline and M2 were quantified with a validated liquid chromatography‐tandem mass spectrometry methodology.21 The lower limit of quantification was 1 ng/mL for both bedaquiline and M2.
PK modeling
Nonlinear mixed‐effects models consisting of structural components describing the typical PK characteristics and stochastic components describing the random variability in the population were utilized. Bedaquiline and M2 PK observations from C208 and C209 were modeled simultaneously. The observed concentrations were converted to molar units and log‐transformed. To describe bedaquiline absorption, the following models were evaluated: a dynamic transit‐compartment model,23 a model with dual zero‐order input function,21 and models with one or two transit compartments. Structural models considered for disposition were two, three, and four‐compartment models for bedaquiline and one and two‐compartment models for M2. The typical values for bioavailability (F) and the fraction of bedaquiline metabolized to M2 (fm) were fixed to one, hence, the disposition parameters estimated were relative to F for bedaquiline and relative to F times fm for M2. The stochastic model included between‐subject variability (BSV), between‐occasion variability, and residual variability. Individual parameters were assumed to be log‐normally distributed.
Modeling of body weight and albumin concentrations
Models of the time‐course of body weight and albumin were developed based on the observed data. Evaluated functions included linear and sigmoid maximum effect models, a previously described semimechanistic model (only for albumin),24 and a self‐limiting logistic model. The models of body weight and albumin were developed separately from the structural PK model, but fitted simultaneously with the PK model in the covariate analysis.
Covariate selection
Seven covariates were considered in the covariate analysis: body weight, age, race, HIV status, sex, TB type, and albumin. The covariate model‐building process included a mechanism‐based evaluation and an exploratory search. The mechanism‐based process tested expected effects of (time‐varying) body weight (allometric scaling25) and albumin (for protein binding and hepatic function) expressed as power‐function models. Simultaneous incorporation was necessary due to the observed positive correlation between body weight and albumin concentrations at baseline and the opposite effect these covariates are expected to have on disposition parameters. The theory and assumptions for the link between albumin concentrations and protein binding is explained in detail in the Supplementary Material.
The exploratory search included covariate‐parameter relationships earlier detected for bedaquiline,21 and scientifically plausible effects of age, HIV, and TB type. The decision to include a relationship was based on the likelihood ratio test. The additional exploratory search started with univariate analysis, after which relationships were added in a stepwise manner starting from the one with the largest impact and tested both with the same and separate effects on bedaquiline and M2 parameters. Continuous covariates were normalized to the median value in the population and included in a linear manner using Eq. (1).
| (1) |
Model selection and evaluation
A significance level of P < 0.01 in a likelihood ratio test was used to accept model extensions. Evaluation of models was based on scientific plausibility and graphical analysis of goodness‐of‐fit plots. The goodness‐of‐fit plots used included population and individual predictions vs. observations, conditional weighted residuals vs. time after dose and vs. individual predictions as well as visual predictive checks (1,000 simulations). Prediction and variability corrected visual predictive checks were used when needed.26 Precision in parameter estimates was obtained with the sampling importance resampling (SIR) procedure27, 28, 29 (details are provided in the Supplementary Material).
Software
The pharmacometric analysis was carried out with the first‐order conditional estimation method with interaction in the software NONMEM 7.3,30 aided by functionalities implemented in PsN.31 Graphical analysis was conducted with Xpose4.32 Pirana was used for documentation of the development process and as an interface between the above‐mentioned programs.33
RESULTS
Data and structural PK model
Data from 335 patients (23 from study C208 stage 1, 79 from study C208 stage 2, and 233 from study C209) were included in the analysis. The total number of PK observations was 2,843 for bedaquiline and 2,873 for M2. Ten of the 335 patients were missing PK observations. There were <0.6% of PK observations below the limit of quantification for each compound, which were excluded from the analysis. Demographic information per study is summarized in Table 1.
Table 1.
Summary of demographic information collected at start of study, if not otherwise mentioned, presented as the median (range) or number of subjects (%)
| Study | C208 (n = 102) | C209 (n = 233) |
|---|---|---|
| Age, years | 31 (18–63) | 32 (18–68) |
| Female sex | 31 (31.6) | 81 (35.7) |
| HIV coinfection | 11 (11.5) | 11 (5.0) |
| Weight, kg | ||
| Day before start of treatment | 55 (37–81) | 57 (30–113) |
| Last observation, median week 120 | 59 (29–92) | 60 (27–125) |
| Albumin, g/dL | ||
| Day before start of treatment | 3.4 (1.5–4.9) | 3.8 (1.7–4.9) |
| Last observation, median week 120 | 3.9 (1.3–4.7) | 4.1 (1.1–5.3) |
| TB type | ||
| DS | 3 (2.94) | 3 (1.3) |
| MDR | 70 (68.6) | 90 (38.6) |
| Pre‐XDR | 17 (16.7%) | 43 (18.5%) |
| XDR | 3 (2.9%) | 37 (15.9%) |
| Missing | 9 (8.8%) | 60 (25.8%) |
| Race | ||
| White | 8 (7.8) | 56 (24.0) |
| Black | 40 (39.2) | 74 (31.8) |
| Hispanic | 13 (12.7) | 0 (0) |
| Asian | 9 (8.8) | 89 (38.2) |
| Other | 28 (27.5) | 8 (3.4) |
| Missing | 4 (3.9) | 6 (2.6) |
TB, tuberculosis; DS, drug sensitive; HIV, human immunodeficiency virus; MDR, multidrug resistant; Pre‐XDR, Pre‐extensively drug resistant; XDR, extensively drug resistant.
The final structural model (Supplementary Figure S1) included three compartments for bedaquiline and one for M2. The data did not show apparent dual absorption peaks, hence, the simpler absorption model included two transit compartments was used. A 6‐hour upper limit for the time to 90% completion of absorption was used to avoid implausible long delay times, as initially estimated with the dynamic transit absorption model. The limit was based on the typical small intestine transit time.34 Estimated parameters were the mean absorption time (MAT; i.e., typical time to 90% complete absorption) and the fraction of MAT, which consisted of delay in the transit compartments or first‐order absorption, respectively (see model code in Supplementary Material). Correlations were significant between the BSV in the clearances (CLs) and in the residual variabilities of bedaquiline and M2, respectively. Residual variability was additive on log‐scale and a positive correlation between bedaquiline and M2 observations at the same timepoint (same blood sample) was significant.
Model of body weight and albumin concentrations
A total of 5,438 body weight observations and 4,684 albumin concentrations obtained from screening to last follow‐up visit were available from both studies (except stage 1 in study C208 in which body weight observations were only available from baseline). A linear model was found sufficient to describe body weights. Albumin was best fitted with the self‐limiting logistic model (Eq. (2), where A(t) is the time dependent albumin concentrations, ASS is the steady‐state concentrations of albumin expected after treatment and T½return is the half‐life of the return towards ASS).
| (2) |
BSV was significant on all parameters. The description of the outer data percentiles was improved when using Box‐Cox distributions35 of the BSV for parameters describing albumin at start of treatment (A0) and at steady state (Ass) as well as body weight at 120 weeks after the start of treatment (WT120). Correlations were found between all BSV parameters of the two models. Proportional residual error models were used for both weight and albumin. Estimated model parameters with associated precision are given in Table 2. Selected goodness‐of‐fit plots are presented in Figures 1 and 2. Figure 1 displays a visual predictive check of the final models. Figure 2 shows individual fits for three patients who were selected to reflect the diversity of encountered time profiles.
Table 2.
Final parameters for the model of body weight and albumin concentrations over time on anti‐TB treatment in MDR‐TB patients fitted simultaneously with the PKs
| Fixed effects | Estimate (SIR 95% CI) | ||||
|---|---|---|---|---|---|
| A0, g/dL | 3.65 (3.61–3.7) | ||||
| Ass, g/dL | 4.04 (4.01–4.07) | ||||
| T½return, weeks | 20.4 (17.7–23) | ||||
| WT0, kg | 56.6 (55.8–57.5) | ||||
| WT120, kg | 62.6 (61.4–63.8) | ||||
| Shape Box‐Cox BSV A0 | −2.44 (−2.70 to −2.17) | ||||
| Shape Box‐Cox BSV ASS | −5.38 (−6.08 to −4.71) | ||||
| Shape Box‐Cox BSV WT120 | −0.42 (−0.64 to −0.19) | ||||
| Random effects (CV [%] and correlations [%]) | Estimate (SIR 95% CI) | ||||
| BSV A0 | 16.0 (15.3–16.7) | ||||
| BSV ASS | 50.3 (44.9–56.3) | 9.9 (9.4–10.4) | |||
| BSV R | −52.7 (−60.4 to −44.1) | 9.1 (3.4–13.9) | 129 (112–156) | ||
| BSV WT0 | 36.1 (32.3–40.7) | 24.7 (19.7–29.0) | −18.7 (−24.5 to −10.2) | 20.7 (19.9–21.6) | |
| BSV WT120 | 15.8 (12.4–20.8) | 29.7 (24.6–36.3) | −1.0 (−4.8 to 2.3) | 81.1 (77.5–84.0) | 22.5 (21.6–23.6) |
| Prop. error albumin | 7.08 (6.89–7.29) | ||||
| Prop. error body weight | 3.47 (3.30–3.47) | ||||
A0 and Ass, albumin concentration at start of treatment and steady state; BSV, between subject variability; CI, confidence interval; CV, coefficient of variance; MDR, multidrug‐resistant; PKs, pharmacokinetics; prop. error, proportional residual error; SIR, sampling importance resampling; T½return, half‐life of the return toward ASS; TB, tuberculosis; WT0 and WT120, body weight at start of treatment and 120 weeks after start of treatment.
Figure 1.
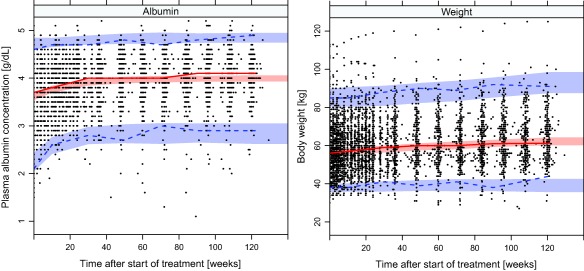
Visual predictive check showing the 2.5th, 50th, and 97.5th percentiles (lines) of observed albumin concentration and body weights (dots) and the 95% confidence intervals (shaded areas) of the same percentiles from model‐simulated data.
Figure 2.
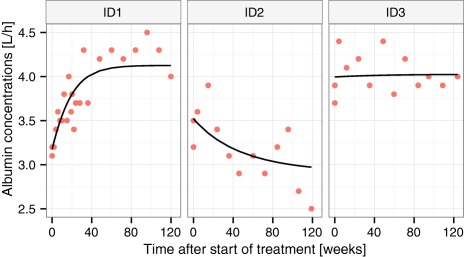
Examples of individual fits from three patients with distinctly different profiles: typical increase (ID1), less common decrease (ID2), or relatively constant (ID3) albumin concentrations.
Covariate model
The mechanism‐guided covariate modeling resulted in inclusion of the following relationships: (i) time‐varying predicted body weight on CLs and volumes using allometric scaling with estimated coefficients for CLs and coefficients fixed to one for volumes; (ii) time‐varying predicted albumin concentrations on all disposition parameters using power models with coefficient fixed to one; and (iii) change in time‐varying predicted albumin concentrations as a marker of hepatic function on bedaquiline and M2 CL and fm. The total difference in objective function value (ΔOFV) after inclusion of these relationships with two parameters fixed to theoretical values and two estimated parameters was −320 points. The exploratory covariate search detected patients of black race to have a significantly higher CL of bedaquiline and M2 (ΔOFV −98.7), and increasing age giving a linear decrease in CL of bedaquiline and M2 (ΔOFV −22.9). Covariate model code is available in the Supplementary Material. Adding effects of sex on volume, black race on F or HIV or TB type on CL or F did not improve the fit significantly. The included covariates jointly decreased the BSV in apparent bedaquiline and M2 CL from 62% to 48% and 72% to 60%. Parameter estimates and their 95% confidence intervals (CIs) for the final model are listed in Table 3. The estimated typical MAT and fraction of MAT which consisted of delay in the transit compartments corresponds to a first‐order absorption rate of 1.1 h−1 and mean transit time of 1.9 hours. The model's good fit to the data is demonstrated for different time periods in the visual predictive checks presented in Figure 3.
Table 3.
Parameter estimates with uncertainty of the final PK model of bedaquiline and M2 including covariates and estimated simultaneously with the albumin‐weight model
| Fixed effects | Estimate (SIR 95% CI) |
|---|---|
| MAT, fraction of 6 hours | 0.66 (0.62–0.71) |
| FR | 0.47 (0.42–0.54) |
| CL/F, L/h | 2.62 (2.49–2.75) |
| V/F, L/70 kg | 198 (184–215) |
| Q1/F, L/h | 3.66 (3.35–3.97) |
| VP1/F, L/70 kg | 8,550 (7,940–9,230) |
| Q2/F, L/h | 7.34 (6.8–7.84) |
| VP2/F, L/70 kg | 2,690 (2,390–2,980) |
| CLM2/(F × fm), L/h | 10.0 (9.5–10.6) |
| VM2/(F × fm), L/70 kg | 2,200 (2,060–2,370) |
| Allometric scaling clearances b | 0.18 (0.07–0.29) |
| Time varying effect of protein binding on disposition b | 1 Fix |
| Individual time varying effect of albumin CL/CLM2/ | 1.64 (1.46–1.81) |
| Effect of black race on CL/CM2 b | 0.84 (0.70–0.99) |
| Age effect on CL/CLM2 b | 0.0088 (0.0074–0.0114) |
| Random effects | Estimate (SIR 95% CI) |
| BOV a F, CV% | 19.7 (16.0–24.8) |
| BOV a MAT, CV% | 148 (101–265) |
| BSV F, CV% | 28.9 (24.5–32.3) |
| BSV CL, CV% | 40.7 (37.2–45.4) |
| BSV CLM2, CV% | 48.6 (44.1–52.8) |
| Correlation BSV CL‐CLM2, % | 75.0 (69.5–80.9) |
| BSV V, CV% | 43.3 (35.0–52.5) |
| BSV Q1, CV% | 44.5 (34.9–55.0) |
| BSV VM2, CV% | 40.2 (35.6–48.2) |
| BSV RUVBDQ, CV% | 23.5 (19.5–27.6) |
| BSV RUVM2, CV% | 23.2 (19.9–26.7) |
| Correlation BSV RUVBDQ‐RUVM2, % | 55.6 (32.0–77.8) |
| Proportional residual error BDQ, CV% | 23.1 (22.0–24.2) |
| Proportional residual error M2, CV% | 19.3 (18.2–20.4) |
| Correlation BDQ‐M2 residual error, % | 43.3 (38.0–47.5) |
The parameters listed are applicable for a non‐black patient of 70 kg with median age (32 years) and albumin concentrations as typical at steady state (4.04 g/dL). BDQ, bedaquiline; BOV, between occasion variability; BSV, between subject variability; CI, confidence interval; CL, clearance; CV, coefficient of variation calculated with sqrt(exp(OMEGA)−1) where OMEGA is the estimated variance; F, bioavailability; fm, fraction bedaquiline metabolized to M2; FR, fraction of MAT which is delay in the transit compartments; MAT, mean absorption time; PK, pharmacokinetic; Q, intercompartmental clearance; RUV, residual unexplained variability; SIR, sampling importance resampling; V, volume of distribution central compartment; VP, volume of distribution peripheral compartment.
aStudy C208 was divided in two occasions; one for each period of rich PK sampling. Study C209, in which only single samples were drawn, was regarded as one occasion.bSee parametrization of covariate effects in the model code provided in the Supplementary Material.
Figure 3.
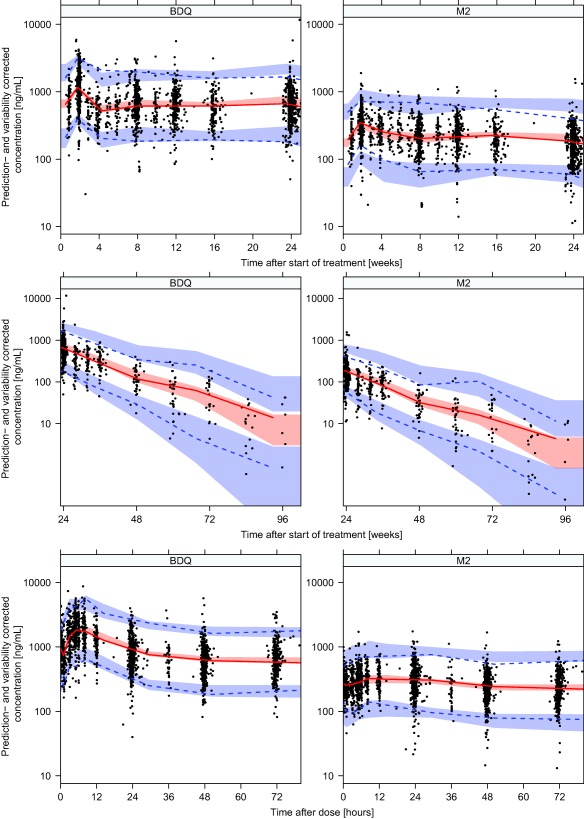
Prediction and variability corrected visual predictive checks showing the 2.5th, 50th, and 97.5th percentiles (lines) for observed bedaquiline (BDQ) and M2 concentrations and the 95% confidence intervals (shaded areas) of the same percentiles from model‐simulated data over time after the start of treatment (upper panel 0–24 weeks and middle panel 24–96 weeks) and over time after dose (lower panel).
DISCUSSION
A population model describing bedaquiline and M2 PKs, body weights, and albumin concentrations simultaneously in patients with MDR‐TB was successfully developed. PKs in patients with MDR‐TB is expected to differ from PKs in healthy volunteers,21 and this is the first model developed on patient data that also characterizes M2 PKs. M2 is less active than bedaquiline in vitro and not expected to contribute meaningfully to the clinical efficacy on M. tuberculosis, but remains important due to safety concerns. Besides the interest in M2 PKs itself, inclusion of metabolite data has the advantages of improving the ability to characterize bedaquiline PKs, including its covariate relations, with good precision.36
The measurements of plasma albumin concentration and body weight over time on treatment showed that both gradually changed over the course of treatment, typically increasing by around 10% between baseline and the end of the study (Figure 1). In several individuals, body weight changed by >10 kg and albumin concentrations increased by >50% over the 24 weeks of bedaquiline treatment. It has previously been observed that albumin concentrations in patients with pulmonary TB are lower compared with healthy controls,37 and that albumin concentrations increase over time on treatment,38 likely reflecting a general improvement of health when the TB infection is cleared. The improved health status may also explain the weight increase. As both bedaquiline and M2 are highly protein bound (>99.9% and 99.7%, respectively13), changes in unbound fraction in plasma are expected to impact the PKs disposition properties because the compounds' extraction ratio is low and the volume of distribution is large.39 Scaling disposition parameters with relative unbound fraction in plasma (calculated based on individually predicted time‐varying albumin concentrations and the typical albumin concentration at steady state) improved the fit of the model, which points toward the fact that albumin is important for protein binding. The impact of albumin concentrations on bedaquiline CL and central volume of distribution (V) is demonstrated in Figure 4. Varying protein binding is rarely of clinical relevance because the unbound plasma concentration, which usually generates the pharmacological effect, is independent of unbound fraction in plasma,39 hence, dose adjustments based on albumin concentrations would not need to be considered. However, due to the complex pathophysiology of TB and bedaquiline's extensive distribution it is difficult to predict the relationship between plasma concentrations and the unbound concentration at the site(s) of action. Nonetheless, the unbound fraction in plasma does impact PK parameters under given conditions,39 and must, therefore, be accounted for to describe observed concentration‐time profiles and accurately explain variability. For example, typical CL (and all other disposition parameters) is predicted to be 3.3 times higher in a patient with the lowest observed albumin concentration at the start of treatment compared to a patient with the highest observed concentration.
Figure 4.
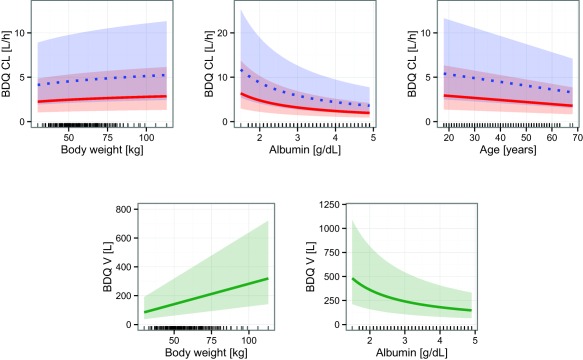
Illustration of covariate relationships included on bedaquiline (BDQ) clearance (CL) and central volume of distribution (V) in the final model. For CL the solid and dotted lines represent the typical values for non‐black and black patients, respectively. For V, the solid line is the typical value. The shaded areas are the 95% confidence interval of the interindividual variability. The lines at the bottom of the graphs represent observed covariate values at the start of treatment.
A previous analysis did not find any effects of body size on bedaquiline disposition,21 which may be due to (i) the positive correlation between body weight and albumin (36% and 30% at the start and end of the treatment period); (ii) the use of baseline instead of time‐varying values; and (iii) the absence of metabolite data. With weight included in the model, the previously observed effect of sex on volume of distribution was not needed. The coefficient for allometric scaling of volumes with body weight were found to not differ significantly from the theoretical value of one, whereas the coefficient for scaling of CLs were significantly lower than the theoretical value of 0.75. The characterization of the effect of body weight on PKs was important to enable use of the model in clinical trial simulations of future pediatric studies. Uncertainty in the estimated coefficient and the potential correlations with disease recovery should be considered in such simulations and in calculations of pediatric doses.
Individual changes in albumin concentrations were found to describe changes in individual CL of bedaquiline, M2, and fm over time. It can be hypothesized that the hepatic capacity to metabolize bedaquiline and M2 is increasing as the general health status of the patients increase over time on treatment. Improved hepatic function is reflected in the increased albumin concentrations because albumin is synthesized in the liver,24 and leads to increased CLs. However, fm is also decreasing, which may then be explained by the fact that the increased hepatic capacity leads to a larger fraction sequential metabolism (i.e., bedaquiline metabolized to M2 and M2 directly metabolized to M3 without exiting the hepatocyte), and thereby decreasing fm.
The mechanism‐based parameter‐covariate relationships distinctly improved the description of observed bedaquiline and M2 concentrations (ΔOFV −320). The pattern of changes over time in different parameters is complex as weight and albumin are positively correlated but may trigger opposite effects, as illustrated in Supplementary Figure S2, for the typical change in body weight and albumin concentrations. Specific individual weight and albumin dynamics yields different total effects on the PK parameters, which can be notably stronger than the typical or even go in the opposite direction.
Increasing age was found to decrease CL of bedaquiline and M2 linearly with 0.9% (95% CI = 0.8–1.0%) per year and patients of black race were estimated to have 84% (95% CI = 75–94%) higher typical CL of bedaquiline and M2 compared to non‐black subjects. Estimating separate effects for bedaquiline and M2 CL did not improve the description, which is expected because the main CL path is thought to be the same. The age effect should not be extrapolated outside the currently investigated age range. For pediatric studies, we instead suggest to account for age with previously described maturation functions for CYP3A4.40 The activity of CYP3A4, which is the main enzyme responsible for bedaquiline and M2 metabolism, is known to vary substantially and relationships with age and genetic polymorphisms has been reported.41 The effect of black race on CL estimated here (+84%) is slightly stronger than the previously reported effect (+52%).21 The physiological rationale for this effect is unclear and should, therefore, be interpreted with caution. It should be noted that the race categories overlap with study site and all but two of the black patients were included at South African sites. It has been suggested that the effect could be linked to regional differences in diet changing the bioavailability, which could be picked up as an effect on apparent CL.13 However, this hypothesis was not supported by our work since assigning the effect of black race to F instead of CL resulted in a significantly worse data fit. Another potential explanation could be regional differences in genetic makeup. Substantial genetic variation in CYP3A4 has been documented; however, there are, to our knowledge, no CYP3A4 polymorphisms with significant impact on metabolizing efficiency described.41
The estimates of apparent CL and central V for bedaquiline were similar to earlier presented estimates obtained partly from the same data (2.62 L/h and 198 L compared to 2.78 L/h and 164 L21). The extensive distribution and long terminal half‐life of both bedaquiline and M2 were confirmed and are thought to be related to the cationic amphiphilic properties of the compounds, causing them to bind to intracellular structures and thereby accumulate in tissues.13 Our structural bedaquiline model is more parsimonious (one distribution compartment less and simpler absorption model) compared to the previously presented model and describes the bedaquiline observations better (ΔOFV −456). The improvements could be achieved by narrowing the scope to only data from patients with TB on treatment with the approved formulation, and the inclusion of time‐varying covariates. The model predicts both bedaquiline and M2 concentrations to be highest in the end of the initial 2 weeks with daily dosing of 400 mg. When the thrice weekly dosing of 200 mg is initialized, the concentrations drops and thereafter a slow accumulation occurs throughout the treatment period but without reaching actual steady state levels. A summary of individual model‐predicted exposures of bedaquiline and M2 at different timepoints is provided in Supplementary Table S3. Treatment with bedaquiline may cause QT‐prolongation,9, 13 and a positive relationship between M2 concentrations and QT‐prolongation has been detected.17 Because QT‐prolongation is commonly regarded to be a direct effect, we recommend future studies investigating the link between bedaquiline and/or M2 exposure and QT‐prolongation to focus on the time‐period when the concentrations are expected to be the highest (i.e., by the end of the second week of daily dosing 400 mg).
The limitations of this model include the extremely long run‐times for parameter estimation due to the complex differential equation system and the many observations over a long time‐period. The estimated increase in albumin and weight after the start of treatment might be biased downward by the fact that part of the patients in study C209 had started the background therapy earlier than they started bedaquiline therapy, which the model did not account for. Making full use of the model in analysis of other datasets may be limited by the lack of observations of albumin concentrations and weights over time on treatment because this is not routinely recorded. However, since these covariates were modeled and correlations estimated, the full model can be applied as long as there is at least one observation of either weight or albumin concentration per individual. The usefulness of individual model‐derived secondary PK metrics for exposure‐response analysis in this dataset might be compromised by the fact that all patients had the same bedaquiline dosing regimen; resulting in a relatively small interindividual spread in the exposures. Another limitation is the unclear physiological rationale for the effect of black race, making interpretation difficult.
In conclusion, a population model describing the accumulation of bedaquiline and M2 during the 24‐week treatment period as well as the slow elimination from the body after the end of treatment was successfully developed. The model also describes the dynamic changes of important characteristics, such as body weight and albumin concentrations in patients with MDR‐TB. The model can be used in clinical trial simulations for pediatric trials with bedaquiline, in studies designed to confirm in patients the PK drug‐drug interactions quantified in healthy volunteers,42 and in model‐based PK‐pharmacodynamic analysis aiming at learning more about the concentration‐response relationships for bedaquiline and M2.43
Supporting information
Supporting Information
Supporting Information
Supporting Information
Supporting Information
Acknowledgments
This work was supported by the Swedish Research Council (grant number 521‐2011‐3442) and the Innovative Medicines Initiative Joint Undertaking (www.imi.europa.eu) for the PreDiCT‐TB consortium (grant agreement 115337), resources of which are composed of financial contribution from the European Union's Seventh Framework Programme (FP7/2007‐2013) and EFPIA companies' in‐kind contribution.
Conflict of Interest
M.O.K. has received research grants from Janssen Pharmaceuticals. The data were shared to the authors by Janssen Pharmaceuticals through the PreDiCT‐TB consortium. E.S. and A.‐G.D. declared no conflict of interest.
Author Contributions
E.S. wrote the manuscript. E.S. and M.O.K. designed the research. E.S. analyzed the data. A.‐G.D. contributed new reagents/analytical tools.
References
- 1. European Medicines Agency CHMP assessment report: SIRTURO . <http://www.ema.europa.eu/docs/en_GB/document_library/Summary_of_opinion_-_Initial_authorisation/human/002614/WC500158728.pdf>.
- 2. Kakkar, A.K. & Dahiya, N. Bedaquiline for the treatment of resistant tuberculosis: promises and pitfalls. Tuberculosis (Edinb). 94, 357–362 (2014). [DOI] [PubMed] [Google Scholar]
- 3. Zignol, M. et al Global incidence of multidrug‐resistant tuberculosis. J. Infect. Dis. 194, 479–485 (2006). [DOI] [PubMed] [Google Scholar]
- 4. World Health Organization Global Tuberculosis Report 2015 . 20th ed. (World Health Organization, Geneva, Switzerland, 2015).
- 5. Wu, S. et al Adverse events associated with the treatment of multidrug‐resistant tuberculosis: a systematic review and meta‐analysis. Am. J. Ther. 23, e521–e530 (2016). [DOI] [PubMed] [Google Scholar]
- 6. Andries, K. et al A diarylquinoline drug active on the ATP synthase of Mycobacterium tuberculosis. Science 307, 223–227 (2005). [DOI] [PubMed] [Google Scholar]
- 7. Koul, A. et al Diarylquinolines target subunit c of mycobacterial ATP synthase. Nat. Chem. Biol. 3, 323–324 (2007). [DOI] [PubMed] [Google Scholar]
- 8. Diacon, A.H. et al Randomized pilot trial of eight weeks of bedaquiline (TMC207) treatment for multidrug‐resistant tuberculosis: long‐term outcome, tolerability, and effect on emergence of drug resistance. Antimicrob. Agents Chemother. 56, 3271–3276 (2012). [DOI] [PMC free article] [PubMed] [Google Scholar]
- 9. Diacon, A.H. et al Multidrug‐resistant tuberculosis and culture conversion with bedaquiline. N. Engl. J. Med. 371, 723–732 (2014). [DOI] [PubMed] [Google Scholar]
- 10. FDA Office of Antimicrobial Products Briefing package , NDA 204‐384, SirturoTM, (bedaquiline 100 mg tablets), for the treatment of adults (≥18 years) as part of combination therapy of pulmonary multi‐drug resistant tuberculosis (MDRTB). <http://www.fda.gov/downloads/AdvisoryCommittees/CommitteesMeetingMaterials/Drugs/Anti-InfectiveDrugsAdvisoryCommittee/UCM329258.pdf>. Accessed 13 March 2014.
- 11. Diacon, A.H. et al Final 120‐week results of a phase II randomised, double‐blind, placebo‐controlled study of 24‐weeks bedaquiline treatment for MDR‐TB (C208). Int. J. Tuberc. Lung Dis. 17, S234–S235 (abstract OP–176–02) (2013). [Google Scholar]
- 12. Janssen Pharmaceuticals Sirturo , United States product insert. <http://www.sirturo.com/sites/default/files/pdf/sirturo-pi.pdf>. Accessed 13 March 2014.
- 13. van Heeswijk, R.P. , Dannemann, B. & Hoetelmans, R.M. Bedaquiline: a review of human pharmacokinetics and drug‐drug interactions. J. Antimicrob. Chemother. 69, 2310–2318 (2014). [DOI] [PubMed] [Google Scholar]
- 14. Liu, K. et al Bedaquiline metabolism: enzymes and novel metabolites. Drug Metab. Dispos. 42, 863–866 (2014). [DOI] [PMC free article] [PubMed] [Google Scholar]
- 15. Mesens, N. , Verbeeck, J. & Rouan, M. Elucidating the role of M2 in the preclinical safety profile of TMC207 (38th Union World Conference on Lung Health, PS‐71358‐11, p. S167. Cape Town, South Africa, 2007).
- 16. van Heeswijk, R. et al The effect of CYP3A4 inhibition on the clinical pharmacokinetics of TMC207 (38th Union World Conference on Lung Health, PS‐71358‐1, Cape Town, South Africa, 2007).
- 17. US Food and Drug Administration Center for drug evaluation and research . Application number 204384Orig1s000, Clinical Pharmacology and Biopharmaceutics review(s). <http://www.accessdata.fda.gov/drugsatfda_docs/nda/2012/204384Orig1s000MedR_.pdf>.
- 18. Svensson, E.M. , Aweeka, F. , Park, J.G. , Marzan, F. , Dooley, K.E. & Karlsson, M.O. Model‐based estimates of the effects of efavirenz on bedaquiline pharmacokinetics and suggested dose adjustments for patients coinfected with HIV and tuberculosis. Antimicrob. Agents Chemother. 57, 2780–2787 (2013). [DOI] [PMC free article] [PubMed] [Google Scholar]
- 19. Svensson, E.M. , Dooley, K.E. & Karlsson, M.O. Impact of lopinavir‐ritonavir or nevirapine on bedaquiline exposures and potential implications for patients with tuberculosis‐HIV coinfection. Antimicrob. Agents Chemother. 58, 6406–6412 (2014). [DOI] [PMC free article] [PubMed] [Google Scholar]
- 20. Svensson, E.M. , Murray, S. , Karlsson, M.O. & Dooley, K.E. Rifampicin and rifapentine significantly reduce concentrations of bedaquiline, a new anti‐TB drug. J. Antimicrob. Chemother. 70, 1106–1114 (2015). [DOI] [PMC free article] [PubMed] [Google Scholar]
- 21. McLeay, S C. , Vis, P. , van Heeswijk, R.P. & Green, B. Population pharmacokinetics of bedaquiline (TMC207), a novel antituberculosis drug. Antimicrob. Agents Chemother. 58, 5315–5324 (2014). [DOI] [PMC free article] [PubMed] [Google Scholar]
- 22. Pym, A.S. et al Bedaquiline in the treatment of multidrug‐ and extensively drug‐resistant tuberculosis. Eur. Respir. J. 47, 564–574 (2016). [DOI] [PubMed] [Google Scholar]
- 23. Savic, R.M. , Jonker, D.M. , Kerbusch, T. & Karlsson, M.O. Implementation of a transit compartment model for describing drug absorption in pharmacokinetic studies. J. Pharmacokinet. Pharmacodyn. 34, 711–726 (2007). [DOI] [PubMed] [Google Scholar]
- 24. Bisaso, K.R. et al Characterizing plasma albumin concentration changes in TB/HIV patients on anti retroviral and anti‐tuberculosis therapy. In Silico Pharmacol. 2, 3 (2014). [DOI] [PMC free article] [PubMed] [Google Scholar]
- 25. Anderson, B.J. & Holford, N.H. Mechanism‐based concepts of size and maturity in pharmacokinetics. Annu. Rev. Pharmacol. Toxicol. 48, 303–332 (2008). [DOI] [PubMed] [Google Scholar]
- 26. Bergstrand, M. , Hooker, A.C. , Wallin, J.E. & Karlsson, M.O. Prediction‐corrected visual predictive checks for diagnosing nonlinear mixed‐effects models. AAPS J. 13, 143–151 (2011). [DOI] [PMC free article] [PubMed] [Google Scholar]
- 27. Dosne, A.‐G. , Bergstrand, M. & Karlsson, M.O. Application of sampling importance resampling to estimate parameter uncertainty distributions. Abstracts of the Annual Meeting of the Population Approach in Europe. (p 22, Abstract 2907, Glasgow, Scotland, 2013).
- 28. Dosne, A.‐G. , Bergstrand, M. & Karlsson, M.O. Determination of appropriate settings in the assessment of parameter uncertainty distributions using sampling importance resampling (SIR). Abstracts of the Annual Meeting of the Population Approach in Europe. (p 24, Abstract 3546, Crete, Greece, 2015).
- 29. Dosne, A.G. , Bergstrand, M. , Harling, K. & Karlsson, M.O. Improving the estimation of parameter uncertainty distributions in nonlinear mixed effects models using sampling importance resampling. J. Pharmacokinet. Pharmacodyn. (2016); e‐pub ahead of print. [DOI] [PMC free article] [PubMed] [Google Scholar]
- 30. Beal, S. , Sheiner, L.B. , Boeckmann, A. & Bauer, R.J. NONMEM user's guides (1989–2013) (Icon Development Solutions, Ellicott City, MD, 2013).
- 31. Lindbom, L. , Pihlgren, P. & Jonsson, E.N. PsN‐Toolkit–a collection of computer intensive statistical methods for non‐linear mixed effect modeling using NONMEM. Comput. Methods Programs Biomed. 79, 241–257 (2005). [DOI] [PubMed] [Google Scholar]
- 32. Jonsson, E.N. & Karlsson, M.O. Xpose–an S‐PLUS based population pharmacokinetic/pharmacodynamic model building aid for NONMEM. Comput. Methods Programs Biomed. 58, 51–64 (1999). [DOI] [PubMed] [Google Scholar]
- 33. Keizer, R.J. , Karlsson, M.O. & Hooker, A. Modeling and simulation workbench for NONMEM: tutorial on Pirana, PsN, and Xpose. CPT Pharmacometrics Syst. Pharmacol. 2, e50 (2013). [DOI] [PMC free article] [PubMed] [Google Scholar]
- 34. Bergstrand, M. Application of mixed‐effects to improve mechanistic understanding and predictability of oral absorption. University dissertation from Uppsala: Acta Universitatis Upsaliensis. <http://www.dissertations.se/dissertation/b9f925c4ae/> (2011).
- 35. Petersson, K.J. , Hanze, E. , Savic, R.M. & Karlsson, M.O. Semiparametric distributions with estimated shape parameters. Pharm. Res. 26, 2174–2185 (2009). [DOI] [PubMed] [Google Scholar]
- 36. Svensson, E.M. , Acharya, C. , Clauson, B. , Dooley, K.E. & Karlsson, M.O. Pharmacokinetic interactions for drugs with a long half‐life—evidence for the need of model‐based analysis. AAPS J. 18, 171–179 (2016). [DOI] [PMC free article] [PubMed] [Google Scholar]
- 37. Ramakrishnan, K. , Shenbagarathai, R. , Kavitha, K. , Uma, A. , Balasubramaniam, R. & Thirumalaikolundusubramanian, P. Serum zinc and albumin levels in pulmonary tuberculosis patients with and without HIV. Jpn. J. Infect. Dis. 61, 202–204 (2008). [PubMed] [Google Scholar]
- 38. Peresi, E. , Silva, S.M. , Calvi, S.A. & Marcondes‐Machado, J. Cytokines and acute phase serum proteins as markers of inflammatory regression during the treatment of pulmonary tuberculosis. J. Bras. Pneumol. 34, 942–949 (2008). [DOI] [PubMed] [Google Scholar]
- 39. Benet, L.Z. & Hoener, B.A. Changes in plasma protein binding have little clinical relevance. Clin. Pharmacol. Ther. 71, 115–121 (2002). [DOI] [PubMed] [Google Scholar]
- 40. Johnson, T.N. , Rostami‐Hodjegan, A. & Tucker, G.T. Prediction of the clearance of eleven drugs and associated variability in neonates, infants and children. Clin. Pharmacokinet. 45, 931–956 (2006). [DOI] [PubMed] [Google Scholar]
- 41. Lamba, J.K. , Lin, Y.S. , Schuetz, E.G. & Thummel, K.E. Genetic contribution to variable human CYP3A‐mediated metabolism. Adv. Drug Deliv. Rev. 54, 1271–1294 (2002). [DOI] [PubMed] [Google Scholar]
- 42. Brill, M.J. , Svensson, E.M. , Pandie, M. , Maartens, G. & Karlsson, M.O. Confirming model‐predicted pharmacokinetic interactions between bedaquiline and lopinavir/ritonavir or nevirapine in patients with HIV and drug resistant tuberculosis. Abstracts from the 25th meeting, 7–10 June 2016. (p 25, Abstract 5919, Lisboa, Portugal, 2016).
- 43. Svensson, E.M. , Rossenu, S. & Karlsson, M.O. Bedaquiline's exposure‐response relationship revealed through modeling of mycobacterial load. Abstracts from the 25th meeting, 7–10 June 2016. (p 25, Abstract 5937, Lisboa, Portugal, 2016).
Associated Data
This section collects any data citations, data availability statements, or supplementary materials included in this article.
Supplementary Materials
Supporting Information
Supporting Information
Supporting Information
Supporting Information