

Abstract
Single‐particle cryo‐electron microscopy (EM) is currently gaining attention for the ability to calculate structures that reach sub‐5 Å resolutions; however, the technique is more than just an alternative approach to X‐ray crystallography. Molecular machines work via dynamic conformational changes, making structural flexibility the hallmark of function. While the dynamic regions in molecules are essential, they are also the most challenging to structurally characterize. Single‐particle EM has the distinct advantage of being able to directly visualize purified molecules without the formation of ordered arrays of molecules locked into identical conformations. Additionally, structures determined using single‐particle EM can span resolution ranges from very low‐ to atomic‐levels (>30–1.8 Å), sometimes even in the same structure. The ability to accommodate various resolutions gives single‐particle EM the unique capacity to structurally characterize dynamic regions of biological molecules, thereby contributing essential structural information needed for the development of molecular models that explain function. Further, many important molecular machines are intrinsically dynamic and compositionally heterogeneous. Structures of these complexes may never reach sub‐5 Å resolutions due to this flexibility required for function. Thus, the biochemical quality of the sample, as well as, the calculation and interpretation of low‐ to mid‐resolution cryo‐EM structures (30–8 Å) remains critical for generating insights into the architecture of many challenging biological samples that cannot be visualized using alternative techniques.
Keywords: biochemistry, negative stain, cryo‐electron microscopy, spliceosomes
Introduction
Structural biologists use a variety of biophysical approaches to create three‐dimensional (3D) molecular snapshots with the goal of understanding how physical form translates into function. The more molecular details present in a 3D structure (i.e., the higher the resolution), the easier it is to develop a useful mechanistic model. For this reason, researchers strive to calculate the highest resolution structures possible. Traditionally X‐ray crystallography and nuclear magnetic resonance (NMR) have been considered the “go‐to” techniques for calculating atomic resolution density maps, with other approaches, including molecular electron microscopy (EM) and small‐angle X‐ray scattering (SAXS), limited to determining low‐ to mid‐resolution structures (>30–8 Å). However, the synergistic convergence of technological and computational advances has made single‐particle cryo‐EM a feasible method for determining near‐atomic to atomic resolution (∼5–2 Å) structures, elevating this technique into the structural biology pantheon of high‐resolution approaches. It is now considered routine to generate sub‐5 Å structures, when even five years ago calculating a sub‐10 Å resolution structure was an accomplishment. In many ways, this very rapid improvement in achievable resolutions seems like the spontaneous generation of a new field of structural biology;1 however, cryo‐EM's current success grows directly from deep theoretical and practical roots (reviewed in Ref. 2, 3, 4, 5). For single‐particle EM, the practical applications of the approach have finally started to catch up with its theoretical potential.
The ability to calculate near‐atomic resolution structures has dramatically expanded the appeal of single‐particle EM and has led to some grandiose, albeit “tongue in cheek” (at least one hopes), claims that cryo‐EM will soon supplant other structural methods.1 Although X‐ray crystallography, NMR, and cryo‐EM are all high‐resolution techniques, each approach has complementary strengths and weaknesses for analyzing the structures of biological molecules and complexes. The scientific questions asked, as well as the biophysical and biochemical properties of the specimen, will continue to drive the choice of method. While the cryo‐EM field is heavily focused on developing new technology and computational methods needed for calculating the highest resolution structures possible (sub‐2Å structures), it is also important to highlight the unique attributes of the approach that allow for structural characterization of dynamic biological molecules at resolutions spanning from “blobs” (∼30‐10 Å) to atoms (∼2 Å). In addition, the exciting potential of determining high‐resolution structures without crystallization often obscures the unavoidable and frustrating reality that the biochemical quality of a sample trumps all other factors. Despite the advantages of state‐of‐the‐art microscopes, cameras, and computational approaches, the maxim “garbage in, garbage out” still applies to cryo‐EM. Here we discuss the advantages and disadvantages of negative stain and vitrification, methods for improving the biochemical quality of dynamic complexes, and tools that can help dissect the molecular organization of low‐ to mid‐resolution (30–8 Å) 3D structures.
Sample Guidelines for Single‐Particle Cryo‐EM
The majority of sub‐5Å structures deposited in the electron microscopy database (EMDB) are of large (∼500 kDa and greater), structurally homogeneous specimens.6 This is not surprising since larger complexes generate higher contrast images that can be precisely aligned,7 and structural homogeneity makes it more likely that 3D structures are calculated using distinct views of only structurally similar particles. For these reasons there is a general consensus that for cryo‐EM analysis samples should be 300 kDa or larger and structurally homogenous2 (Table 1). However, these rough guidelines continue to expand as technology and computational approaches improve. For example, there have recently been near‐atomic to atomic resolution structures reported for specimens between ∼100 and 300 kDa.8, 9, 10, 11, 12, 13, 14, 15 Additionally, many samples once considered too dynamic for high‐resolution cryo‐EM analysis have now reached sub‐8Å resolutions using computational strategies that incorporate a maximum likelihood‐based 3D classification approach.16, 17 Examples of these successes include, but are not limited to, structures of spliceosomal complexes,18, 19, 20, 21, 22, 23, 24, 25 transcription complexes,26, 27, 28, 29, 30 cytoskeleton assemblies,31, 32, 33, 34 and various membrane proteins.8, 9, 11, 12, 15, 35, 36, 37, 38, 39, 40 Therefore, rather than strictly adhering to the general consensus, it is worthwhile to empirically determine whether a particular sample is amenable for study by cryo‐EM. Figure 1 depicts a flowchart of general steps taken for the structural analysis of biological molecules using single‐particle cryo‐EM. When working with either very small or extremely dynamic samples it is important that the purification is compositionally homogenous and that extreme care is taken to validate the accuracy of the resulting structure. It is possible to incorporate noise and/or model bias into single‐particle 3D reconstructions leading to the calculation of incorrect 3D density maps, a likelihood that is exacerbated when analyzing small and/or dynamic molecules.7, 41, 42
Table 1.
Comparison of Negative Stain and Cryo‐EM Techniques
| Negative stain | Cryo‐EM | |
|---|---|---|
| How is image contrast created? | Heavy metal stain | protein/nucleic acid |
| Does the technique cause preparation artifacts? | Yes | Noa |
| Molecular mass ranges b | ∼200 kDa or largerb | ∼300 kDa or largerb |
| Final concentration of sample applied to grid | ∼0.02 mg/ml | ∼0.20 mg/ml |
| Does the sample need to be structurally homogenous? | No | Noc |
| Resolution limits | ∼15 Å | ∼2 Å |
In practice, samples trapped in vitrified ice can become distorted if the ice is too thin or if the particles cluster at the ice/air interface.
The smaller the molecular mass the less image contrast is produced. This makes it harder to accurately align the particles. Although there are some high‐resolution cryo‐EM structures of molecules smaller than 300 kDa, small molecular mass samples are considered challenging specimens for imaging in either negative stain or vitrified ice.
Although computational approaches can be used to sort sample heterogeneity in silico, cryo‐EM samples still need to be more structurally homogenous than samples imaged by negative stain due to the lower contrast of the images.
Figure 1.
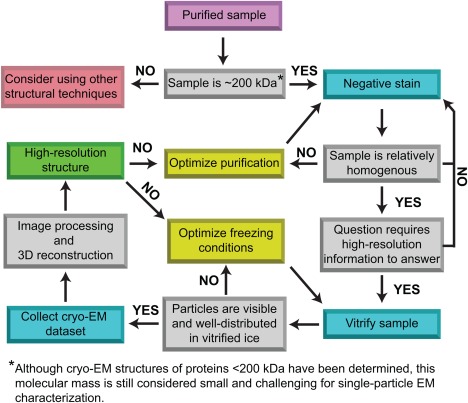
General flowchart showing the basic steps required to analyze biological samples using single‐particle electron microscopy (EM). While it is possible to structurally characterize small (<200 kDa) and dynamic samples via single‐particle cryo‐EM, larger molecular mass (>300 kDa) samples that are structurally homogenous have a better chance at reaching near‐atomic to atomic resolutions (sub‐5Å). There are many places in the process where sample optimization is critical for success. This requires biochemically improving the purification and/or finding the proper conditions to visualize the sample in vitrified ice. Unfortunately, these optimization steps involve labor‐intensive trial and error that is not hypothesis driven.
Single‐Particle EM and Sample Preparation
The most commonly used molecular EM technique is single‐particle EM.6 In this approach large numbers of two‐dimensional (2D) projections of homogenous particles are collected and used to generate a 3D structure. Images of individual particles are windowed from each micrograph to create data stacks that can contain upwards of a million particles. To amplify the signal and attenuate the noise, the windowed particles are computationally aligned and averaged. 3D information is extracted from the 2D projections using a variety of computational approaches that requires each 2D projection to be accurately assigned five orientation parameters (x‐axis, y‐axis, z‐axis, phi (ψ), and theta (θ)).16, 17, 43, 44, 45, 46, 47, 48 A number of informative reviews have recently been published describing this process in more detail (examples include 49, 50, 51, 52).
Unlike other structural techniques, single‐particle EM does not require large amounts of sample (Table 1) or the formation of ordered arrays to determine 3D structures. This significantly broadens the range of biological specimens amenable for characterization using this approach. However, biological molecules are not ideal for imaging by transmission electron microscopy (TEM). They dehydrate in the harsh vacuum of the electron microscope, are composed mainly of atoms that do not strongly scatter electrons, and are sensitive to radiation damage caused by the electron beam.2, 53 To partially overcome these limitations, biological samples are prepared for single‐particle EM using either negative stain or vitrification (Table 1). In negative stain EM, the sample is adsorbed to a continuous carbon support and then embedded in a layer of dried heavy metal solution.54 For cryo‐EM, the sample is suspended across a holey carbon grid and then rapidly plunged into cryogen, trapping the molecules in a thin layer of vitrified ice composed of the purification buffer.55 While only cryo‐EM holds the promise of generating high‐resolution structures, negative stain is often the only viable method for studying the organization of dynamic samples and/or complexes that are difficult to purify.
Negative stain provides high‐contrast structural information mainly about the outer envelope of a molecule. The approach is valuable for visualizing samples that are too small and structurally dynamic to study using cryo‐EM (Table 1). It is also useful for the initial characterization of samples before attempting more time‐intensive analysis by cryo‐EM (Fig. 1). Samples ∼200 kDa and larger can usually be imaged using negative stain; however, the smaller the sample the more important it is for the particles to be homogenous and to possess distinctive structural features that allow for accurate alignment. Importantly, negatively stained samples often sit on the grid in preferred orientations. Although this is a disadvantage in vitrified ice, it can be an advantage when trying to assess the structural homogeneity of samples or when characterizing a particularly dynamic complex. Many times even the generation of 2D class averages of negatively stained particles provides important insight into the overall architecture of a complex (examples include56, 57, 58, 59, 60). However, by combining 2D classification and 3D structural determination using random conical tilt (RCT)61 or orthogonal tilt,62 distinct conformational states can be sorted and characterized (examples include57, 63, 64, 65, 66, 67). Although unrivaled for its ability to empirically characterize the structural homogeneity of biochemical purifications, drawbacks of negative staining include the introduction of flattening artifacts due to lack of protection from dehydration in the microscope vacuum and 3D reconstructions limited to a ∼15Å resolution due to the grain size of the stain. However, when used as part of a hybrid structural approach that combines data from various biophysical, biochemical, and structural techniques, negative stain provides a way to generate molecular models of extremely dynamic and/or difficult‐to‐purify complexes that cannot be studied using other methods (examples include 56, 57, 59, 65, 68, 69, 70).
The most commonly used negative stains are uranyl formate and uranyl acetate, although there are other available stains with different chemical properties.54 The smaller grain size of uranyl formate makes it the ideal stain for use on lower molecular weight samples. While uranyl stains are acidic, they have rapid fixative properties that act on the millisecond timescale.71 This means that even pH‐sensitive samples may be protected from conformational changes when exposed to the stain. For example, staining with uranyl formate (pH 4.5) does not trigger the pH‐induced structural reorganization of the Clostridium difficile pore forming toxin TcdA that is seen when the sample is first washed with a low pH buffer (4.5) before adding stain68 [Fig. 2(A,B)], nor does it cause the low pH (∼pH 3.5) induced dissociation of Helicobacter pylori VacA oligomers into monomers [Fig. 2(C,D)].59
Figure 2.
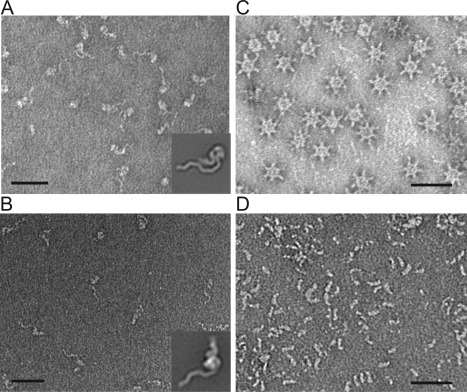
The negative stain uranyl formate does not alter the conformation of pH sensitive pore‐forming toxins. A: Clostridium difficile toxin TcdA does not change structural conformation when stained with uranyl formate. B: For pH induced structural rearrangement to occur, TcdA must first be washed with a low pH buffer (pH 4.5) before staining. Scale bars, 50 nm. Representative class averages for each condition are shown in corner. Side length of averages, 57.3 nm. Averages published in Ref. 68. C: Helicobacter pylori VacA oligomers remain oligomeric when stained with uranyl formate.59, 66 D: H. pylori VacA oligomers dissociate when incubated in a low pH buffer (pH 3.5).59, 125 Scale bars, 50 nm.
Negative stain is easy to learn, inexpensive, and fast. For these reasons, it should always be used as the first step in evaluating whether a sample is amenable for further analysis by cryo‐EM (Fig. 1). While there are some important exceptions [i.e., a complex dissociates at the lower protein concentrations used for making negatively stained grids (Table 1)], most explanations provided for why samples might not stain well are apocryphal and serve as excuses for ignoring the biochemical quality of the sample. As a general rule, if particles are not easily visible or structurally homogenous enough for negative stain analysis, time and effort is better spent towards improving the quality of the sample before moving into the more challenging, expensive, and time‐consuming approach of cryo‐EM. Finally, many important biological questions do not require atomic resolution information to answer (examples include 56, 57, 63, 68, 69, 70). If a hypothesis can be addressed using negative stain, the method should not be discounted simply because it does not yield high‐resolution data.
Cryo‐EM is not simple, inexpensive, or quick. This approach preserves samples in a near‐native state and, with the introduction of direct electron detector (DED) cameras, is now considered a high‐resolution structural technique. The sample is prepared by rapid plunging into liquid ethane, a process that embeds the molecules in a layer of vitrified (or amorphous) ice. Special equipment is required for plunging into a cryogen, and the low temperature of the sample must be maintained during its transfer into the microscope and while being imaged to preserve the vitreous ice. In addition, finding the optimal freezing conditions for a sample can be challenging. It is often necessary to experimentally optimize the buffer, sample concentration, freezing parameters, and/or type of grid support that leads to images of high contrast particles that are homogenously distributed across the holes. Options available for modifying grid supports include adding a thin layer of carbon to holey carbon grids or using graphene or gold grids (reviewed in72). The type of grids and choice of buffers used can alter the quality of the images. Figure 3 shows the difference that grid supports and buffer conditions can have on the appearance of the Schizosaccharomyces pombe U5.U2/U6 spliceosome in vitrified ice. In Figure 3(A) spliceosomes were vitrified using a holey carbon grid covered with a thin layer of carbon.73 In Figure 3(B), spliceosomes were first purified using the GraFix approach74 and then vitrified using unmodified holey carbon grids. In this example the combination of mild chemical crosslinking and altering the buffer conditions improved the ability to image spliceosomes in vitrified ice.
Figure 3.
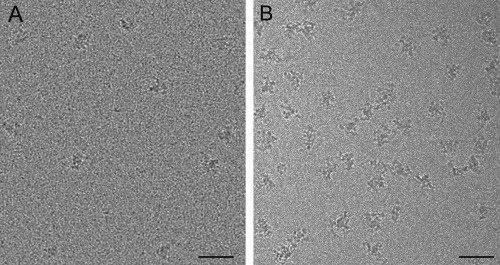
Changing the types of support grids and buffer conditions can dramatically alter the appearance of particles in vitrified ice. A: Image of S. pombe U5.U2/U6 spliceosome complexes vitrified on Quantifoil holey carbon grids covered with a thin layer of carbon using an FEI vitrobot.73 B: Image of S. pombe U5.U2/U6 spliceosome complexes that were isolated using GraFix,74 concentrated using a Millipore Microcon centrifugal filter (100 kDa cut‐off), and frozen on Quantifoil holey carbon grids using an FEI vitrobot. Scale bars, 50 nm.
Because there is no heavy atom stain added, particles visualized under cryo‐conditions have very low contrast. Cryo‐preserved particles must also be imaged using low electron doses to limit radiation damage from the electron beam,75 further reducing the contrast of the resulting images. The dual disadvantage of imaging low contrast specimens with low doses of electrons creates images with extremely low signal‐to‐noise ratios (SNR) that are difficult to accurately align. Extracting the signal from the noise in cryo‐EM images continues to be a major obstacle that must be overcome to calculate accurate, high‐resolution 3D structures.
The introduction of DED cameras represents the biggest technological breakthrough for cryo‐EM over the last decade. Collecting images using DED cameras improves image quality by reducing the number of electrons needed to generate contrast and allowing for the correction of electron beam‐induced movement of the sample (reviewed in 6, 76, 77). These advances result in cryo‐EM images that have increased SNR with decreased radiation damage. The use of DED cameras combined with automated data collection and sophisticated computational image processing approaches has led to cryo‐EM structures that now routinely reach near‐atomic to atomic resolutions (examples include, although not a comprehensive list18, 20, 33, 34, 35, 36, 78, 79, 80, 81, 82, 83, 84, 85, 86, 87, 88).
A major assumption made while working with cryo‐EM is that the images represent homogeneous particles trapped in random orientations in the amorphous ice. In practice, purifications of molecular machines are rarely structurally or even biochemically homogeneous. Additionally, particles do not always orient randomly in the ice layer. The missing views from the 2D projections create problems during 3D reconstruction. Even with the use of DED cameras, the low SNR of cryo‐EM images makes it difficult to differentiate between images of randomly‐oriented homogeneous particles and images of randomly‐oriented particles that are structurally and/or compositionally distinct. Image processing algorithms are being developed for robust in silico sorting of distinct conformational states89, 90, 91, 92, 93, 94 and programs such as RELION and Frealign have the ability to sort some conformations present in a dataset;16, 17 however, structural and compositional heterogeneity continues to complicate the ability of single‐particle EM to calculate reliable high‐resolution structures.
Improving Structural Homogeneity for Single‐Particle Analysis
While there will continue to be important advances in technology and software that improve the practicality and biological reach of single‐particle cryo‐EM, the biochemical quality of the sample is now the biggest roadblock to determining high‐resolution structures. Capturing images of large numbers of structurally homogenous particles is a serious challenge when studying flexible macromolecular machines that are physically fragile when isolated from their cellular environment. Overcoming the one‐two punch of structural and compositional heterogeneity requires careful optimization of purification conditions.
Although it is possible to recombinantly express and purify homogeneous multi‐protein complexes suitable for high‐resolution structural analysis using Escherichia coli, mammalian cells, or baculovirus expression vectors (reviewed in95), these recombinant systems are not practical for building protein‐nucleic acid complexes or complexes containing more than approximately ten components. Thus, most purifications are isolated directly from the endogenous source using basic biochemical approaches. While the biochemical homogeneity of purifications is usually assessed by gel filtration, SDS‐PAGE analysis, mass spectrometry, and/or functional assays, none of these techniques address the conformational homogeneity of the sample. Thus, even if a purification appears to be compositionally pure, it is rarely structurally homogeneous when examined by single‐particle EM. For example, particles examined from a single peak off a size exclusion column can adopt various structural conformations.96
Improving the compositional purity and/or stability of a sample falls under the dominion of biochemistry. As such, there are many classic strategies for protein purification already available. However, many commonly employed approaches, such as adding sucrose, glucose, or glycerol to stabilize the sample, are not suited for single‐particle cryo‐EM because they reduce the image contrast of the particles. When complex stability is an issue, the first and easiest correction is to simply prepare the grids immediately following purification. The sample should not be frozen, stored, or even analyzed for quality (for example, by SDS‐PAGE analysis) before making grids. By moving quickly, complexes may remain intact long enough to make both negatively stained and cryo‐EM grids that are suitable for structural analysis. Another option to improve stability of a sample is to add mild chemical fixatives, such as glutaraldehyde, formaldehyde, or BS3 (bis(sulfosuccinimidyl)suberate). The type and amount of fixative, as well as the timing of the fixation reaction must all be experimentally determined to find the optimal conditions that mildly stabilize the complex while not significantly altering structure. Figure 4(B) shows an example where spliceosome particles have been incubated for 1.5 hours at 4°C with 0.1% glutaraldehyde and subsequently quenched with glycine. As seen by the images and 2D class averages (Fig. 4), these fixation conditions do not lead to major sample aggregation (i.e., inter‐molecular cross‐links) or gross structural alterations.
Figure 4.
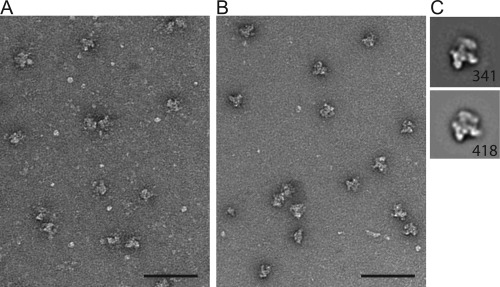
Crosslinking improves the homogeneity of a U5.U2/U6 spliceosome complex. Image of S. pombe U5.U2/U6 complexes before (A) or after (B) crosslinking for 1.5 hours with 0.1% glutaraldehyde at 4°C. Scale bars, 100 nm. (C) Averages representing a common spliceosome view found when negatively stained. No crosslinking (upper), crosslinking (lower). Number of particles, lower right corner. Side length of panel, 56 nm. Averages were generated using the program Spider47.
Taking a more sophisticated approach towards improving sample quality, the laboratory of Holger Stark has introduced two techniques to improve complex stability called GraFix and ProteoPlex.74, 97 GraFix uses density gradient centrifugation combined with chemical crosslinking to isolate homogenous complexes.74 The fractions containing the complex are collected and the sucrose or glycerol is removed using desalting columns, allowing the sample to be visualized by cryo‐EM without reduced contrast. The approach combines size fractionation and mild‐fixation, a combination that has the potential to improve both the compositional and structural homogeneity of samples. Figure 5 shows an example of a U5.U2/U6 spliceosome complex isolated using GraFix. Although individual fractions collected from the GraFix gradient are often too dilute for vitrification [Fig. 5(B)], an advantage of the approach is that particles isolated from the gradient can often be concentrated without aggregating, as is the case with the spliceosome complex [Fig. 5(C)]. ProteoPlex is a high‐throughput method that systematically tests the stability of a complex in various buffer conditions. The approach uses a dye that fluoresces in apolar environments created when proteins unfold.97 The lower the fluorescent signal in this assay, the more stable the complex. The ability to screen numerous buffer conditions simultaneously without having to image by EM provides the first systematic approach for rapidly finding ideal buffer conditions that improve sample stability. This method also accommodates the addition of small molecules, inhibitors, ligands, agonists, or antibodies to directly screen for their ability to alter conformational stability.
Figure 5.
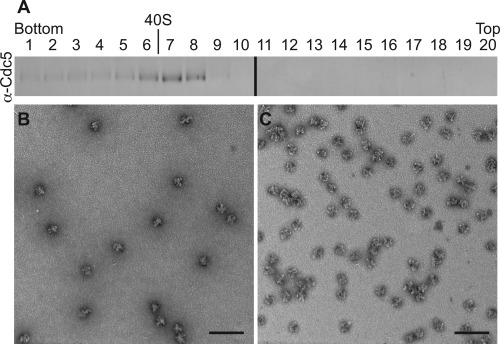
GraFix can be used to improve both the compositional and structural homogeneity of purifications.74 A: A S. pombe U5.U2/U6 spliceosome purification was resolved in a 10–30% glycerol gradient. Immunoblot of fractions collected from bottom (30%) to top (10%) of gradient and probed with anti‐Cdc5 antibodies. The migration of fatty acid synthase (40S) collected from parallel gradients is indicated. B: Negatively stained image of spliceosomes found in fraction 7 collected from a 10–30% GraFix glycerol gradient that contains a 0–0.15% glutaraldehyde gradient. C: Negatively stained image of spliceosome particles pooled from fractions 6, 7, and 8 from the GraFix gradient described in B, buffer exchanged to remove glycerol, and concentrated using a Millipore Microcon centrifugal filter (100 kDa cut‐off). Estimated glutaraldehyde concentration in fractions 6‐8 is ∼0.1%. Scale bar, 100 nm.
Using Computational Approaches to Sort Conformational Flexibility in Complexes
While there are numerous biochemical approaches that may lead to improved sample homogeneity, the optimization of purification conditions can be a time‐ and labor‐intensive process with no set finish line. Because single‐particle EM can directly visualize samples in various conformational states, the dream of every structural biologist is to collect cryo‐EM images of structurally dynamic macromolecular machines and rely on computational approaches to recognize and sort the multiple conformations found in the purification. Although this remains a dream and not reality, the ability of cryo‐EM to classify structurally diverse data sets, sometimes referred to as in silico purification, continues to improve. The incorporation of the maximum‐likelihood approach in 3D calculations16, 17 has made it possible in some situations to determine multiple structures of a dynamic complex using one cryo‐EM dataset (examples include23, 25). However, the success of this conformational sorting requires the collection of very large datasets and the expertise to carefully assess the accuracy of the resulting 3D structures.
Additionally, it is now possible to focus image alignment on areas of interest in the 3D density map by masking specific regions during image processing.52 This strategy can improve the resolution of both dynamic and stable regions of complexes by focusing on each region independently of the other. Although it requires stitching together multiple 3D structural calculations often at different resolutions, focused alignment is helpful for maximizing the structural information gleaned from the images of flexible and dynamic machines (examples include 21, 88, 98).
Using Labeling Techniques to Localize Individual Components and Domains in Anisotropic and Low‐ to Mid‐Resolution (∼30‐8Å) Structures
The inherent flexibility of macromolecular machines ensures that even when working with compositionally homogeneous samples many structures will never reach the resolutions (∼3.5 Å) necessary to build de novo molecular models. In addition, the 3D maps of many structures will have anistropic resolutions because of the difficulty in precisely aligning flexible regions of the molecule. This means that while the more stable portions of the 3D density map may be near‐atomic resolution, the dynamic regions could have resolutions as low as 30 Å. It is possible to trace secondary structural elements, such as α‐helices, in ∼5‐10 Å 3D density maps. However, at lower resolutions (sub‐10Å) the structures resemble 3D blobs. Although lacking the molecular details found in high‐resolution structures, these “blobby” maps can be used to gain structural insight into the molecular organization of dynamic molecular machines.
When faced with mid‐ to low‐resolution 3D density maps of an entire complex—or regions of an otherwise high‐resolution structure—there are a number of labeling techniques that can be used to confirm the location(s) of various components in the density maps. Samples purified from either genetic model organisms, such as yeasts, or recombinant expression systems, can be endogenously labeled with specific protein tags that appear as extra density in 2D projections and/or 3D structures. The criteria for choosing the appropriate tag are that (1) it cannot disrupt the overall structure of the complex and yet (2) it has to be large and structurally stable enough to be detectable in the 2D projections and/or in the 3D density map using difference mapping. Finding the correct tag and the right location to put the tag is an experimental process of trial and error. Endogenous tags that have been successfully used to localize individual components in complexes include Maltose Binding Protein (MBP),99, 100, 101 fluorescent proteins (CFP/GFP/YFP),100, 102, 103, 104 streptavidin,105 the DID‐Dyn2 tag,106 and an actin filament label.107 Labeling can also be done using Ni‐NTA‐gold clusters to localize histidine‐tags,108, 109, 110, 111, 112 although the successful use of this reagent appears to be low possibly due to the difficulties in limiting nonspecific binding. Figure 6 shows negatively stained images of S. pombe spliceosome components endogenously labeled with the DID tag. The rod‐shaped DID‐Dyn2 is clearly visible extending from the particles. One major advantage of using endogenous tags is that there is no doubt that all complexes contain the label and no worries about non‐specific binding.
Figure 6.
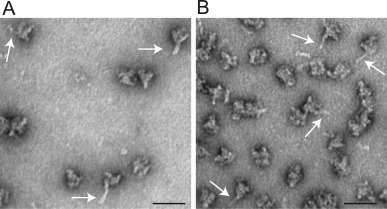
DID‐Dyn2 labels are clearly visible in DID‐labeled S. pombe spliceosome complexes. (A‐B) Negatively stained images of S. pombe U5.U2/U6 spliceosome labeled with DID‐Dyn2.106 U5.U2/U6 particles tagged with Lea1‐DID1 (A) and Smg1‐DID1 (B). The rod‐shapes of the DID‐Dyn2 tag are easily visible in the raw images. White arrows highlight the position of a few of the DID‐Dyn2 rods. Scale bar, 50 nm.
Another labeling approach is the use of antibodies that recognize either individual complex components or an endogenous tag. If there are already specific antibodies available this can be a relatively quick way to localize individual components and/or domains in 2D projections or 3D structures. Antibodies (or the isolated Fab fragments) have a very distinctive shape, making the position of the antibody (or Fab fragment) easily recognizable in raw images, 2D projections, and 3D structures. There are a number of examples where antibodies, either by themselves or bound to gold clusters, have been used to localize the position of individual complex components or domains in the context of larger structures.113, 114, 115, 116, 117, 118, 119, 120, 121, 122 Finally, approaches have also been developed for localizing nucleic acids in complexes. These include biotin labeled antisense oligonucleotides123 and a doughnut shaped protein tag that binds a specific RNA sequence.124
Summary
The rapid improvements in the technologies associated with cryo‐EM make this an exciting time in structural biology. Single‐particle cryo‐EM has unequivocally joined NMR spectroscopy and X‐ray crystallography as a high‐resolution approach. It is now finally possible to structurally characterize many essential dynamic machines that have been reticent to crystallization. For the field of cryo‐EM, having dealt with the dreaded moniker “blobologists” for decades, the ability to build atomic models directly from cryo‐EM structures can feel like the beginning of a new era of structural biology where single‐particle EM finally takes its rightful place at the top.1
However, as it becomes more common to achieve atomic‐resolutions using cryo‐EM, the emphasis will once again shift more towards addressing outstanding biological questions rather than focusing on which methodology is being used. Answering these riddles will often involve isolating challenging complexes that, while ideal for visualizing using single particle EM, will not be ideal for generating near‐atomic resolution structures. Biochemistry, as it always has, will continue to make the final ruling on which structures reach high‐resolutions. The biochemical quality of samples outranks the best microscopes, cameras, and computational advances.
Improving methods for isolating fragile complexes and developing additional tools for dissecting the molecular organization of low‐ to mid‐resolution 3D density maps will be vital for studying dynamic molecular machines that cannot be characterized using other structural approaches. In addition, carefully taking into account the strengths and weakness of single particle EM will help ensure that data is not over interpreted to calculate incorrect structures. Finally, the unique ability of single‐particle EM to characterize biological molecules over a wide range of resolutions should be fully embraced. The capacity of this approach to visualize “blobs” to atoms creates a bridge between the fields of structural and cell biology. The current renaissance occurring in both high‐resolution electron and light microscopy opens the possibility that we will soon be able to piece together how the molecular organization of dynamic complexes directly translates into function within the context of living cells.
Acknowledgments
The authors thank Nora Foegeding, Pallavi Manral, and Scott Collier for critical reading of the manuscript and Dr. Borden Lacy for the C. difficile TcdA sample.
References
- 1. Callaway E (2015) The revolution will not be crystallized: a new method sweeps through structural biology. Nature 525:172–174. [DOI] [PubMed] [Google Scholar]
- 2. Henderson R (1995) The potential and limitations of neutrons, electrons and X‐rays for atomic resolution microscopy of unstained biological molecules. Q Rev Biophys 28:171–193. [DOI] [PubMed] [Google Scholar]
- 3. Dubochet J (2012) Cryo‐EM–the first thirty years. J Microsc 245:221–224. [DOI] [PubMed] [Google Scholar]
- 4. Frank J (2016) Generalized single‐particle cryo‐EM—a historical perspective. Microscopy 65:3–8. [DOI] [PMC free article] [PubMed] [Google Scholar]
- 5. Egelman EH (2016) The current revolution in cryo‐EM. Biophys J 110:1008–1012. [DOI] [PMC free article] [PubMed] [Google Scholar]
- 6. Binshtein E, Ohi MD (2015) Cryo‐electron microscopy and the amazing race to atomic resolution. Biochemistry 54:3133–3141. [DOI] [PubMed] [Google Scholar]
- 7. Henderson R, Chen S, Chen JZ, Grigorieff N, Passmore LA, Ciccarelli L, Rubinstein JL, Crowther RA, Stewart PL, Rosenthal PB (2011) Tilt‐pair analysis of images from a range of different specimens in single‐particle electron cryomicroscopy. J Mol Biol 413:1028–1046. [DOI] [PMC free article] [PubMed] [Google Scholar]
- 8. Cao E, Liao M, Cheng Y, Julius D (2013) TRPV1 structures in distinct conformations reveal activation mechanisms. Nature 504:113–118. [DOI] [PMC free article] [PubMed] [Google Scholar]
- 9. Lu P, Bai XC, Ma D, Xie T, Yan C, Sun L, Yang G, Zhao Y, Zhou R, Scheres SH, Shi Y (2014) Three‐dimensional structure of human gamma‐secretase. Nature 512:166–170. [DOI] [PMC free article] [PubMed] [Google Scholar]
- 10. Merk A, Bartesaghi A, Banerjee S, Falconieri V, Rao P, Davis MI, Pragani R, Boxer MB, Earl LA, Milne JL, Subramaniam S (2016) Breaking cryo‐EM resolution barriers to facilitate drug discovery. Cell 165:1698–1707. [DOI] [PMC free article] [PubMed] [Google Scholar]
- 11. Matthies D, Dalmas O, Borgnia MJ, Dominik PK, Merk A, Rao P, Reddy BG, Islam S, Bartesaghi A, Perozo E, Subramaniam S (2016) Cryo‐EM structures of the magnesium channel CorA reveal symmetry break upon gating. Cell 164:747–756. [DOI] [PMC free article] [PubMed] [Google Scholar]
- 12. Bai XC, Yan C, Yang G, Lu P, Ma D, Sun L, Zhou R, Scheres SH, Shi Y (2015) An atomic structure of human gamma‐secretase. Nature 525:212–217. [DOI] [PMC free article] [PubMed] [Google Scholar]
- 13. Jiang F, Taylor DW, Chen JS, Kornfeld JE, Zhou K, Thompson AJ, Nogales E, Doudna JA (2016) Structures of a CRISPR‐Cas9 R‐loop complex primed for DNA cleavage. Science 351:867–871. [DOI] [PMC free article] [PubMed] [Google Scholar]
- 14. Verba KA, Wang RY, Arakawa A, Liu Y, Shirouzu M, Yokoyama S, Agard DA (2016) Atomic structure of Hsp90‐Cdc37‐Cdk4 reveals that Hsp90 traps and stabilizes an unfolded kinase. Science 352:1542–1547. [DOI] [PMC free article] [PubMed] [Google Scholar]
- 15. Gao Y, Cao E, Julius D, Cheng Y (2016) TRPV1 structures in nanodiscs reveal mechanisms of ligand and lipid action. Nature 534:347–351. [DOI] [PMC free article] [PubMed] [Google Scholar]
- 16. Scheres SH (2012) RELION: implementation of a Bayesian approach to cryo‐EM structure determination. J Struct Biol 180:519–530. [DOI] [PMC free article] [PubMed] [Google Scholar]
- 17. Lyumkis D, Brilot AF, Theobald DL, Grigorieff N (2013) Likelihood‐based classification of cryo‐EM images using FREALIGN. J Struct Biol 183:377–388. [DOI] [PMC free article] [PubMed] [Google Scholar]
- 18. Agafonov DE, Kastner B, Dybkov O, Hofele RV, Liu WT, Urlaub H, Luhrmann R, Stark H (2016) Molecular architecture of the human U4/U6.U5 tri‐snRNP. Science 351:1416–1420. [DOI] [PubMed] [Google Scholar]
- 19. Hang J, Wan R, Yan C, Shi Y (2015) Structural basis of pre‐mRNA splicing. Science 349:1191–1198. [DOI] [PubMed] [Google Scholar]
- 20. Nguyen TH, Galej WP, Bai XC, Oubridge C, Newman AJ, Scheres SH, Nagai K (2016) Cryo‐EM structure of the yeast U4/U6.U5 tri‐snRNP at 3.7 A resolution. Nature 530:298–302. [DOI] [PMC free article] [PubMed] [Google Scholar]
- 21. Nguyen TH, Galej WP, Bai XC, Savva CG, Newman AJ, Scheres SH, Nagai K (2015) The architecture of the spliceosomal U4/U6.U5 tri‐snRNP. Nature 523:47–52. [DOI] [PMC free article] [PubMed] [Google Scholar]
- 22. Yan C, Hang J, Wan R, Huang M, Wong CC, Shi Y (2015) Structure of a yeast spliceosome at 3.6‐angstrom resolution. Science 349:1182–1191. [DOI] [PubMed] [Google Scholar]
- 23. Wan R, Yan C, Bai R, Huang G, Shi Y (2016) Structure of a yeast catalytic step I spliceosome at 3.4 A resolution. Science 353:895–904. [DOI] [PubMed] [Google Scholar]
- 24. Wan R, Yan C, Bai R, Wang L, Huang M, Wong CC, Shi Y (2016) The 3.8 A structure of the U4/U6.U5 tri‐snRNP: Insights into spliceosome assembly and catalysis. Science 351:466–475. [DOI] [PubMed] [Google Scholar]
- 25. Yan C, Wan R, Bai R, Huang G, Shi Y (2016) Structure of a yeast activated spliceosome at 3.5 A resolution. Science 353:904–911. [DOI] [PubMed] [Google Scholar]
- 26. He Y, Yan C, Fang J, Inouye C, Tjian R, Ivanov I, Nogales E (2016) Near‐atomic resolution visualization of human transcription promoter opening. Nature 533:359–365. [DOI] [PMC free article] [PubMed] [Google Scholar]
- 27. Pilsl M, Crucifix C, Papai G, Krupp F, Steinbauer R, Griesenbeck J, Milkereit P, Tschochner H, Schultz P (2016) Structure of the initiation‐competent RNA polymerase I and its implication for transcription. Nat Commun 7:12126. [DOI] [PMC free article] [PubMed] [Google Scholar]
- 28. Bernecky C, Herzog F, Baumeister W, Plitzko JM, Cramer P (2016) Structure of transcribing mammalian RNA polymerase II. Nature 529:551–554. [DOI] [PubMed] [Google Scholar]
- 29. Engel C, Plitzko J, Cramer P (2016) RNA polymerase I‐Rrn3 complex at 4.8 A resolution. Nat Commun 7:12129. [DOI] [PMC free article] [PubMed] [Google Scholar]
- 30. Plaschka C, Hantsche M, Dienemann C, Burzinski C, Plitzko J, Cramer P (2016) Transcription initiation complex structures elucidate DNA opening. Nature 533:353–358. [DOI] [PubMed] [Google Scholar]
- 31. Urnavicius L, Zhang K, Diamant AG, Motz C, Schlager MA, Yu M, Patel NA, Robinson CV, Carter AP (2015) The structure of the dynactin complex and its interaction with dynein. Science 347:1441–1446. [DOI] [PMC free article] [PubMed] [Google Scholar]
- 32. Shang Z, Zhou K, Xu C, Csencsits R, Cochran JC, Sindelar CV (2014) High‐resolution structures of kinesin on microtubules provide a basis for nucleotide‐gated force‐generation. Elife 3:e04686. [DOI] [PMC free article] [PubMed] [Google Scholar]
- 33. von der Ecken J, Heissler SM, Pathan‐Chhatbar S, Manstein DJ, Raunser S (2016) Cryo‐EM structure of a human cytoplasmic actomyosin complex at near‐atomic resolution. Nature 534:724–728. [DOI] [PubMed] [Google Scholar]
- 34. Kellogg EH, Howes S, Ti SC, Ramirez‐Aportela E, Kapoor TM, Chacon P, Nogales E (2016) Near‐atomic cryo‐EM structure of PRC1 bound to the microtubule. Proc Natl Acad Sci USA 113:9430–9439. [DOI] [PMC free article] [PubMed] [Google Scholar]
- 35. Jiang J, Pentelute BL, Collier RJ, Zhou ZH (2015) Atomic structure of anthrax protective antigen pore elucidates toxin translocation. Nature 521:545–549. [DOI] [PMC free article] [PubMed] [Google Scholar]
- 36. Hite RK, Yuan P, Li Z, Hsuing Y, Walz T, MacKinnon R (2015) Cryo‐electron microscopy structure of the Slo2.2 Na(+)‐activated K(+) channel. Nature 527:198–203. [DOI] [PMC free article] [PubMed] [Google Scholar]
- 37. Yan Z, Bai XC, Yan C, Wu J, Li Z, Xie T, Peng W, Yin CC, Li X, Scheres SH, Shi Y, Yan N (2015) Structure of the rabbit ryanodine receptor RyR1 at near‐atomic resolution. Nature 517:50–55. [DOI] [PMC free article] [PubMed] [Google Scholar]
- 38. Zalk R, Clarke OB, des Georges A, Grassucci RA, Reiken S, Mancia F, Hendrickson WA, Frank J, Marks AR (2015) Structure of a mammalian ryanodine receptor. Nature 517:44–49. [DOI] [PMC free article] [PubMed] [Google Scholar]
- 39. Zhao J, Benlekbir S, Rubinstein JL (2015) Electron cryomicroscopy observation of rotational states in a eukaryotic V‐ATPase. Nature 521:241–245. [DOI] [PubMed] [Google Scholar]
- 40. Efremov RG, Leitner A, Aebersold R, Raunser S (2015) Architecture and conformational switch mechanism of the ryanodine receptor. Nature 517:39–43. [DOI] [PubMed] [Google Scholar]
- 41. Henderson R (2013) Avoiding the pitfalls of single particle cryo‐electron microscopy: Einstein from noise. Proc Natl Acad Sci USA 110:18037–18041. [DOI] [PMC free article] [PubMed] [Google Scholar]
- 42. van Heel M (2013) Finding trimeric HIV‐1 envelope glycoproteins in random noise. Proc Natl Acad Sci USA 110:E4175–E4177. [DOI] [PMC free article] [PubMed] [Google Scholar]
- 43. van Heel M, Harauz G, Orlova EV, Schmidt R, Schatz M (1996) A new generation of the IMAGIC image processing system. J Struct Biol 116:17–24. [DOI] [PubMed] [Google Scholar]
- 44. Grigorieff N (2007) FREALIGN: high‐resolution refinement of single particle structures. J Struct Biol 157:117–125. [DOI] [PubMed] [Google Scholar]
- 45. Hohn M, Tang G, Goodyear G, Baldwin PR, Huang Z, Penczek PA, Yang C, Glaeser RM, Adams PD, Ludtke SJ (2007) SPARX, a new environment for Cryo‐EM image processing. J Struct Biol 157:47–55. [DOI] [PubMed] [Google Scholar]
- 46. Tang G, Peng L, Baldwin PR, Mann DS, Jiang W, Rees I, Ludtke SJ (2007) EMAN2: an extensible image processing suite for electron microscopy. J Struct Biol 157:38–46. [DOI] [PubMed] [Google Scholar]
- 47. Shaikh TR, Gao H, Baxter WT, Asturias FJ, Boisset N, Leith A, Frank J (2008) SPIDER image processing for single‐particle reconstruction of biological macromolecules from electron micrographs. Nat Protoc 3:1941–1974. [DOI] [PMC free article] [PubMed] [Google Scholar]
- 48. de la Rosa‐Trevin JM, Oton J, Marabini R, Zaldivar A, Vargas J, Carazo JM, Sorzano CO (2013) Xmipp 3.0: an improved software suite for image processing in electron microscopy. J Struct Biol 184:321–328. [DOI] [PubMed] [Google Scholar]
- 49. Sigworth FJ (2016) Principles of cryo‐EM single‐particle image processing. Microscopy 65:57–67. [DOI] [PMC free article] [PubMed] [Google Scholar]
- 50. Cheng Y, Grigorieff N, Penczek PA, Walz T (2015) A primer to single‐particle cryo‐electron microscopy. Cell 161:438–449. [DOI] [PMC free article] [PubMed] [Google Scholar]
- 51. Henderson R (2015) Overview and future of single particle electron cryomicroscopy. Arch Biochem Biophys 581:19–24. [DOI] [PubMed] [Google Scholar]
- 52. Scheres SH (2016) Processing of structurally heterogeneous cryo‐EM data in RELION. Methods Enzymol 579:125–157. [DOI] [PubMed] [Google Scholar]
- 53. Glaeser RM, Taylor KA (1978) Radiation damage relative to transmission electron microscopy of biological specimens at low temperature: a review. J Microsc 112:127–138. [DOI] [PubMed] [Google Scholar]
- 54. Ohi M, Li Y, Cheng Y, Walz T (2004) Negative staining and image classification ‐ powerful tools in modern electron microscopy. Biol Proced Online 6:23–34. [DOI] [PMC free article] [PubMed] [Google Scholar]
- 55. Dubochet J, Adrian M, Chang JJ, Homo JC, Lepault J, McDowall AW, Schultz P (1988) Cryo‐electron microscopy of vitrified specimens. Q Rev Biophys 21:129–228. [DOI] [PubMed] [Google Scholar]
- 56. Westfield GH, Rasmussen SG, Su M, Dutta S, DeVree BT, Chung KY, Calinski D, Velez‐Ruiz G, Oleskie AN, Pardon E, Chae PS, Liu T, Li S, Woods VL, Jr , Steyaert J, Kobilka BK, Sunahara RK, Skiniotis G (2011) Structural flexibility of the G alpha s alpha‐helical domain in the beta2‐adrenoceptor Gs complex. Proc Natl Acad Sci USA 108:16086–16091. [DOI] [PMC free article] [PubMed] [Google Scholar]
- 57. Benefield DA, Dessain SK, Shine N, Ohi MD, Lacy DB (2013) Molecular assembly of botulinum neurotoxin progenitor complexes. Proc Natl Acad Sci USA 110:5630–5635. [DOI] [PMC free article] [PubMed] [Google Scholar]
- 58. Yokom AL, Morishima Y, Lau M, Su M, Glukhova A, Osawa Y, Southworth DR (2014) Architecture of the nitric‐oxide synthase holoenzyme reveals large conformational changes and a calmodulin‐driven release of the FMN domain. J Biol Chem 289:16855–16865. [DOI] [PMC free article] [PubMed] [Google Scholar]
- 59. Pyburn TM, Foegeding NJ, Gonzalez‐Rivera C, McDonald NA, Gould KL, Cover TL, Ohi MD (2016) Structural organization of membrane‐inserted hexamers formed by Helicobacter pylori VacA toxin. Mol Microbiol [VOL:PAGE #S: ]. [DOI] [PMC free article] [PubMed] [Google Scholar]
- 60. Elegheert J, Kakegawa W, Clay JE, Shanks NF, Behiels E, Matsuda K, Kohda K, Miura E, Rossmann M, Mitakidis N, Motohashi J, Chang VT, Siebold C, Greger IH, Nakagawa T, Yuzaki M, Aricescu AR (2016) Structural basis for integration of GluD receptors within synaptic organizer complexes. Science 353:295–299. [DOI] [PMC free article] [PubMed] [Google Scholar]
- 61. Radermacher M (1994) Three‐dimensional reconstruction from random projections: orientational alignment via Radon transforms. Ultramicroscopy 53:121–136. [DOI] [PubMed] [Google Scholar]
- 62. Leschziner AE, Nogales E (2006) The orthogonal tilt reconstruction method: an approach to generating single‐class volumes with no missing cone for ab initio reconstruction of asymmetric particles. J Struct Biol 153:284–299. [DOI] [PubMed] [Google Scholar]
- 63. Takagi J, Petre BM, Walz T, Springer TA (2002) Global conformational rearrangements in integrin extracellular domains in outside‐in and inside‐out signaling. Cell 110:599–611. [DOI] [PubMed] [Google Scholar]
- 64. Leschziner AE, Saha A, Wittmeyer J, Zhang Y, Bustamante C, Cairns BR, Nogales E (2007) Conformational flexibility in the chromatin remodeler RSC observed by electron microscopy and the orthogonal tilt reconstruction method. Proc Natl Acad Sci USA 104:4913–4918. [DOI] [PMC free article] [PubMed] [Google Scholar]
- 65. Yip CK, Berscheminski J, Walz T (2010) Molecular architecture of the TRAPPII complex and implications for vesicle tethering. Nat Struct Mol Biol 17:1298–1304. [DOI] [PMC free article] [PubMed] [Google Scholar]
- 66. Chambers MG, Pyburn TM, Gonzalez‐Rivera C, Collier SE, Eli I, Yip CK, Takizawa Y, Lacy DB, Cover TL, Ohi MD (2013) Structural analysis of the oligomeric states of Helicobacter pylori VacA toxin. J Mol Biol 425:524–535. [DOI] [PMC free article] [PubMed] [Google Scholar]
- 67. Peisley A, Skiniotis G (2015) 2D projection analysis of GPCR complexes by negative stain electron microscopy. Methods Mol Biol 1335:29–38. [DOI] [PubMed] [Google Scholar]
- 68. Pruitt RN, Chambers MG, Ng KK, Ohi MD, Lacy DB (2010) Structural organization of the functional domains of Clostridium difficile toxins A and B. Proc Natl Acad Sci USA 107:13467–13472. [DOI] [PMC free article] [PubMed] [Google Scholar]
- 69. Hons MT, Huis In 't Veld PJ, Kaesler J, Rombaut P, Schleiffer A, Herzog F, Stark H, Peters JM (2016) Topology and structure of an engineered human cohesin complex bound to Pds5B. Nat Commun 7:12523. [DOI] [PMC free article] [PubMed] [Google Scholar]
- 70. Ha JY, Chou HT, Ungar D, Yip CK, Walz T, Hughson FM (2016) Molecular architecture of the complete COG tethering complex. Nat Struct Mol Biol 23:758–760. [DOI] [PMC free article] [PubMed] [Google Scholar]
- 71. Zhao FQ, Craig R (2003) Capturing time‐resolved changes in molecular structure by negative staining. J Struct Biol 141:43–52. [DOI] [PubMed] [Google Scholar]
- 72. Passmore LA, Russo CJ (2016) Specimen preparation for high‐resolution cryo‐EM. Methods Enzymol 579:51–86. [DOI] [PMC free article] [PubMed] [Google Scholar]
- 73. Ohi MD, Ren L, Wall JS, Gould KL, Walz T (2007) Structural characterization of the fission yeast U5.U2/U6 spliceosome complex. Proc Natl Acad Sci USA 104:3195–3200. [DOI] [PMC free article] [PubMed] [Google Scholar]
- 74. Kastner B, Fischer N, Golas MM, Sander B, Dube P, Boehringer D, Hartmuth K, Deckert J, Hauer F, Wolf E, Uchtenhagen H, Urlaub H, Herzog F, Peters JM, Poerschke D, Luhrmann R, Stark H (2008) GraFix: sample preparation for single‐particle electron cryomicroscopy. Nat Methods 5:53–55. [DOI] [PubMed] [Google Scholar]
- 75. Bammes BE, Jakana J, Schmid MF, Chiu W (2010) Radiation damage effects at four specimen temperatures from 4 to 100 K. J Struct Biol 169:331–341. [DOI] [PMC free article] [PubMed] [Google Scholar]
- 76. Bai XC, McMullan G, Scheres SH (2015) How cryo‐EM is revolutionizing structural biology. Trends Biochem Sci 40:49–57. [DOI] [PubMed] [Google Scholar]
- 77. Cheng Y (2015) Single‐particle cryo‐EM at crystallographic resolution. Cell 161:450–457. [DOI] [PMC free article] [PubMed] [Google Scholar]
- 78. Liao M, Cao E, Julius D, Cheng Y (2013) Structure of the TRPV1 ion channel determined by electron cryo‐microscopy. Nature 504:107–112. [DOI] [PMC free article] [PubMed] [Google Scholar]
- 79. Allegretti M, Mills DJ, McMullan G, Kuhlbrandt W, Vonck J (2014) Atomic model of the F420‐reducing [NiFe] hydrogenase by electron cryo‐microscopy using a direct electron detector. Elife 3:e01963. [DOI] [PMC free article] [PubMed] [Google Scholar]
- 80. Bartesaghi A, Merk A, Banerjee S, Matthies D, Wu X, Milne JL, Subramaniam S (2015) 2 A resolution cryo‐EM structure of beta‐galactosidase in complex with a cell‐permeant inhibitor. Science 348:1147–1151. [DOI] [PMC free article] [PubMed] [Google Scholar]
- 81. von der Ecken J, Muller M, Lehman W, Manstein DJ, Penczek PA, Raunser S (2015) Structure of the F‐actin‐tropomyosin complex. Nature 519:114–117. [DOI] [PMC free article] [PubMed] [Google Scholar]
- 82. Fischer N, Neumann P, Konevega AL, Bock LV, Ficner R, Rodnina MV, Stark H (2015) Structure of the E. coli ribosome‐EF‐Tu complex at <3 A resolution by Cs‐corrected cryo‐EM. Nature 520:567–570. [DOI] [PubMed] [Google Scholar]
- 83. Campbell MG, Veesler D, Cheng A, Potter CS, Carragher B (2015) 2.8 A resolution reconstruction of the Thermoplasma acidophilum 20S proteasome using cryo‐electron microscopy. Elife 4:[PAGE #S]. [DOI] [PMC free article] [PubMed] [Google Scholar]
- 84. Banerjee S, Bartesaghi A, Merk A, Rao P, Bulfer SL, Yan Y, Green N, Mroczkowski B, Neitz RJ, Wipf P, Falconieri V, Deshaies RJ, Milne JL, Huryn D, Arkin M, Subramaniam S (2016) 3 A resolution cryo‐EM structure of human p97 and mechanism of allosteric inhibition. Science 351:871–875. [DOI] [PMC free article] [PubMed] [Google Scholar]
- 85. Borgnia MJ, Banerjee S, Merk A, Matthies D, Bartesaghi A, Rao P, Pierson J, Earl LA, Falconieri V, Subramaniam S, Milne JL (2016) Using cryo‐EM to map small ligands on dynamic metabolic enzymes: studies with glutamate dehydrogenase. Mol Pharmacol 89:645–651. [DOI] [PMC free article] [PubMed] [Google Scholar]
- 86. Huang X, Luan B, Wu J, Shi Y (2016) An atomic structure of the human 26S proteasome. Nat Struct Mol Biol [VOL:PAGE #S]. [DOI] [PubMed] [Google Scholar]
- 87. Shalev‐Benami M, Zhang Y, Matzov D, Halfon Y, Zackay A, Rozenberg H, Zimmerman E, Bashan A, Jaffe CL, Yonath A, Skiniotis G (2016) 8‐A cryo‐EM structure of the large ribosomal subunit from the eukaryotic parasite Leishmania. Cell Rep 16:288–294. [DOI] [PMC free article] [PubMed] [Google Scholar]
- 88. Galej WP, Wilkinson ME, Fica SM, Oubridge C, Newman AJ, Nagai K (2016) Cryo‐EM structure of the spliceosome immediately after branching. Nature [VOL:PAGE #S]. [DOI] [PMC free article] [PubMed] [Google Scholar]
- 89. Penczek PA, Kimmel M, Spahn CM (2011) Identifying conformational states of macromolecules by eigen‐analysis of resampled cryo‐EM images. Structure 19:1582–1590. [DOI] [PMC free article] [PubMed] [Google Scholar]
- 90. Yang Z, Fang J, Chittuluru J, Asturias FJ, Penczek PA (2012) Iterative stable alignment and clustering of 2D transmission electron microscope images. Structure 20:237–247. [DOI] [PMC free article] [PubMed] [Google Scholar]
- 91. Wang Q, Matsui T, Domitrovic T, Zheng Y, Doerschuk PC, Johnson JE (2013) Dynamics in cryo EM reconstructions visualized with maximum‐likelihood derived variance maps. J Struct Biol 181:195–206. [DOI] [PMC free article] [PubMed] [Google Scholar]
- 92. Elmlund D, Elmlund H (2012) SIMPLE: software for ab initio reconstruction of heterogeneous single‐particles. J Struct Biol 180:420–427. [DOI] [PubMed] [Google Scholar]
- 93. Tagare HD, Kucukelbir A, Sigworth FJ, Wang H, Rao M (2015) Directly reconstructing principal components of heterogeneous particles from cryo‐EM images. J Struct Biol 191:245–262. [DOI] [PMC free article] [PubMed] [Google Scholar]
- 94. Frank J, Ourmazd A (2016) Continuous changes in structure mapped by manifold embedding of single‐particle data in cryo‐EM. Methods 100:61–67. [DOI] [PMC free article] [PubMed] [Google Scholar]
- 95. Stark H, Chari A (2016) Sample preparation of biological macromolecular assemblies for the determination of high‐resolution structures by cryo‐electron microscopy. Microscopy 65:23–34. [DOI] [PubMed] [Google Scholar]
- 96. Takagi J, Strokovich K, Springer TA, Walz T (2003) Structure of integrin alpha5beta1 in complex with fibronectin. Embo J 22:4607–4615. [DOI] [PMC free article] [PubMed] [Google Scholar]
- 97. Chari A, Haselbach D, Kirves JM, Ohmer J, Paknia E, Fischer N, Ganichkin O, Moller V, Frye JJ, Petzold G, Jarvis M, Tietzel M, Grimm C, Peters JM, Schulman BA, Tittmann K, Markl J, Fischer U, Stark H (2015) ProteoPlex: stability optimization of macromolecular complexes by sparse‐matrix screening of chemical space. Nat Methods 12:859–865. [DOI] [PMC free article] [PubMed] [Google Scholar]
- 98. Louder RK, He Y, Lopez‐Blanco JR, Fang J, Chacon P, Nogales E (2016) Structure of promoter‐bound TFIID and model of human pre‐initiation complex assembly. Nature 531:604–609. [DOI] [PMC free article] [PubMed] [Google Scholar]
- 99. Baskaran S, Carlson LA, Stjepanovic G, Young LN, Kim DJ, Grob P, Stanley RE, Nogales E, Hurley JH (2014) Architecture and dynamics of the autophagic phosphatidylinositol 3‐kinase complex. Elife 3:[PAGE #S]. [DOI] [PMC free article] [PubMed] [Google Scholar]
- 100. Ciferri C, Lander GC, Maiolica A, Herzog F, Aebersold R, Nogales E (2012) Molecular architecture of human polycomb repressive complex 2. Elife 1:e00005. [DOI] [PMC free article] [PubMed] [Google Scholar]
- 101. Lander GC, Estrin E, Matyskiela ME, Bashore C, Nogales E, Martin A (2012) Complete subunit architecture of the proteasome regulatory particle. Nature 482:186–191. [DOI] [PMC free article] [PubMed] [Google Scholar]
- 102. Birungi M, Folea M, Battchikova N, Xu M, Mi H, Ogawa T, Aro EM, Boekema EJ (2010) Possibilities of subunit localization with fluorescent protein tags and electron microscopy examplified by a cyanobacterial NDH‐1 study. Biochim Biophys Acta 1797:1681–1686. [DOI] [PubMed] [Google Scholar]
- 103. Ciferri C, Lander GC, Nogales E (2015) Protein domain mapping by internal labeling and single particle electron microscopy. J Struct Biol 192:159–162. [DOI] [PMC free article] [PubMed] [Google Scholar]
- 104. Choy RM, Kollman JM, Zelter A, Davis TN, Agard DA (2009) Localization and orientation of the gamma‐tubulin small complex components using protein tags as labels for single particle EM. J Struct Biol 168:571–574. [DOI] [PMC free article] [PubMed] [Google Scholar]
- 105. Lau PW, Potter CS, Carragher B, MacRae IJ (2012) DOLORS: versatile strategy for internal labeling and domain localization in electron microscopy. Structure 20:1995–2002. [DOI] [PMC free article] [PubMed] [Google Scholar]
- 106. Flemming D, Thierbach K, Stelter P, Bottcher B, Hurt E (2010) Precise mapping of subunits in multiprotein complexes by a versatile electron microscopy label. Nat Struct Mol Biol 17:775–778. [DOI] [PubMed] [Google Scholar]
- 107. Stroupe ME, Xu C, Goode BL, Grigorieff N (2009) Actin filament labels for localizing protein components in large complexes viewed by electron microscopy. rna 15:244–248. [DOI] [PMC free article] [PubMed] [Google Scholar]
- 108. Hainfeld JF, Liu W, Halsey CM, Freimuth P, Powell RD (1999) Ni‐NTA‐gold clusters target His‐tagged proteins. J Struct Biol 127:185–198. [DOI] [PubMed] [Google Scholar]
- 109. Frye SA, Assalkhou R, Collins RF, Ford RC, Petersson C, Derrick JP, Tonjum T (2006) Topology of the outer‐membrane secretin PilQ from Neisseria meningitidis. Microbiology 152:3751–3764. [DOI] [PubMed] [Google Scholar]
- 110. Passmore LA, Booth CR, Venien‐Bryan C, Ludtke SJ, Fioretto C, Johnson LN, Chiu W, Barford D (2005) Structural analysis of the anaphase‐promoting complex reveals multiple active sites and insights into polyubiquitylation. Mol Cell 20:855–866. [DOI] [PubMed] [Google Scholar]
- 111. Schraidt O, Lefebre MD, Brunner MJ, Schmied WH, Schmidt A, Radics J, Mechtler K, Galan JE, Marlovits TC (2010) Topology and organization of the Salmonella typhimurium type III secretion needle complex components. PLoS Pathog 6:e1000824. [DOI] [PMC free article] [PubMed] [Google Scholar]
- 112. Zhang L, Aleksandrov LA, Riordan JR, Ford RC (2011) Domain location within the cystic fibrosis transmembrane conductance regulator protein investigated by electron microscopy and gold labelling. Biochim Biophys Acta 1808:399–404. [DOI] [PubMed] [Google Scholar]
- 113. Jensen GJ, Kornberg RD (1998) Single‐particle selection and alignment with heavy atom cluster‐antibody conjugates. Proc Natl Acad Sci USA 95:9262–9267. [DOI] [PMC free article] [PubMed] [Google Scholar]
- 114. Jiang QX, Wang DN, MacKinnon R (2004) Electron microscopic analysis of KvAP voltage‐dependent K+ channels in an open conformation. Nature 430:806–810. [DOI] [PubMed] [Google Scholar]
- 115. Nakagawa T, Cheng Y, Ramm E, Sheng M, Walz T (2005) Structure and different conformational states of native AMPA receptor complexes. Nature 433:545–549. [DOI] [PubMed] [Google Scholar]
- 116. Ohi MD, Feoktistova A, Ren L, Yip C, Cheng Y, Chen JS, Yoon HJ, Wall JS, Huang Z, Penczek PA, Gould KL, Walz T (2007) Structural organization of the anaphase‐promoting complex bound to the mitotic activator slp1. Mol Cell 28:871–885. [DOI] [PMC free article] [PubMed] [Google Scholar]
- 117. Bertin A, McMurray MA, Grob P, Park SS, Garcia G, 3rd , Patanwala I, Ng HL, Alber T, Thorner J, Nogales E (2008) Saccharomyces cerevisiae septins: supramolecular organization of heterooligomers and the mechanism of filament assembly. Proc Natl Acad Sci USA 105:8274–8279. [DOI] [PMC free article] [PubMed] [Google Scholar]
- 118. Wolf E, Kastner B, Deckert J, Merz C, Stark H, Luhrmann R (2009) Exon, intron and splice site locations in the spliceosomal B complex. embo J 28:2283–2292. [DOI] [PMC free article] [PubMed] [Google Scholar]
- 119. Chittuluru JR, Chaban Y, Monnet‐Saksouk J, Carrozza MJ, Sapountzi V, Selleck W, Huang J, Utley RT, Cramet M, Allard S, Cai G, Workman JL, Fried MG, Tan S, Cote J, Asturias FJ (2011) Structure and nucleosome interaction of the yeast NuA4 and Piccolo‐NuA4 histone acetyltransferase complexes. Nat Struct Mol Biol 18:1196–1203. [DOI] [PMC free article] [PubMed] [Google Scholar]
- 120. Peralvarez‐Marin A, Tae H, Board PG, Casarotto MG, Dulhunty AF, Samso M (2011) 3D Mapping of the SPRY2 domain of ryanodine receptor 1 by single‐particle cryo‐EM. PLoS One 6:e25813. [DOI] [PMC free article] [PubMed] [Google Scholar]
- 121. Hutchins JR, Toyoda Y, Hegemann B, Poser I, Heriche JK, Sykora MM, Augsburg M, Hudecz O, Buschhorn BA, Bulkescher J, Conrad C, Comartin D, Schleiffer A, Sarov M, Pozniakovsky A, Slabicki MM, Schloissnig S, Steinmacher I, Leuschner M, Ssykor A, Lawo S, Pelletier L, Stark H, Nasmyth K, Ellenberg J, Durbin R, Buchholz F, Mechtler K, Hyman AA, Peters JM (2010) Systematic analysis of human protein complexes identifies chromosome segregation proteins. Science 328:593–599. [DOI] [PMC free article] [PubMed] [Google Scholar]
- 122. Rigo N, Sun C, Fabrizio P, Kastner B, Luhrmann R (2015) Protein localisation by electron microscopy reveals the architecture of the yeast spliceosomal B complex. embo J 34:3059–3073. [DOI] [PMC free article] [PubMed] [Google Scholar]
- 123. Wolf E, Kastner B, Luhrmann R (2012) Antisense‐targeted immuno‐EM localization of the pre‐mRNA path in the spliceosomal C complex. rna 18:1347–1357. [DOI] [PMC free article] [PubMed] [Google Scholar]
- 124. Alcid EA, Jurica MS (2008) A protein‐based EM label for RNA identifies the location of exons in spliceosomes. Nat Struct Mol Biol 15:213–215. [DOI] [PMC free article] [PubMed] [Google Scholar]
- 125. Gonzalez‐Rivera C, Campbell AM, Rutherford SA, Pyburn TM, Foegeding NJ, Barke TL, Spiller BW, McClain MS, Ohi MD, Lacy DB, Cover TL (2016) A nonoligomerizing mutant form of Helicobacter pylori VacA allows structural analysis of the p33 domain. Infect Immun 84:2662–2670. [DOI] [PMC free article] [PubMed] [Google Scholar]