Abstract
Background:
The metabolic syndrome (MS) (syndrome X, insulin resistance syndrome) is a constellation of metabolic abnormalities and a complex predisease state that predicts future development of type 2 diabetes mellitus and cardiovascular disease. Menopausal transition and postmenopausal state are considered as a vulnerable period for developing MS, and this increased risk has been attributed to decreasing estrogen levels with an increasing risk of insulin resistance following menopause.
Aims and Objectives:
This study aimed to determine the prevalence of MS and its components in pre- and post-menopausal women from North India.
Methodology:
This is a cross-sectional study of 350 women in the age group of 45–55 years attending gynecology clinic in a tertiary center of North India. Details of sociodemographic data, menopausal history, reproductive, and medical profile were obtained. Then, waist circumference, body mass index (BMI), and blood pressure were recorded. A venous blood sample was collected for fasting blood glucose, triglycerides, total cholesterol, low-density lipoprotein cholesterol, and high-density lipoprotein cholesterol. MS was defined according to the modified National Cholesterol Education Program Adult Treatment Panel III criteria.
Results:
The mean age was 49.09 ± 2.2 years in premenopausal and 49.54 ± 2.8 years in postmenopausal women. The prevalence of MS in the study group was 62.6%. Occurrence of MS was higher in older and obese women. Abnormal waist circumference was the most prevalent component (87%) of MS and in terms of odd ratio, correlation was highest for BMI followed by total cholesterol and waist-hip ratio.
Conclusion:
We should target obesity and deranged lipid profile by bringing out changes in lifestyle and dietary habits to decrease the higher prevalence of MS and the risk of cardiovascular diseases.
Key Words: Menopause, metabolic syndrome, postmenopausal women, premenopausal women
INTRODUCTION
The metabolic syndrome (MS) (syndrome X, insulin resistance syndrome) is a constellation of metabolic abnormalities and a complex predisease state that predicts future development of type 2 diabetes mellitus and cardiovascular disease.[1] The prevalence of MS is influenced by genetic background, age, sex, diet, and levels of physical activity.[2] There is observed increase in the prevalence of MS in India, and other South Asian countries and the main drivers to this are lifestyle and socioeconomic transitions consequent to increased affluence, urbanization, and mechanization and rural to urban migration. Recent studies of MS in Indian menopausal women show a prevalence ranging from 19.2% in premenopausal to 32.4% in postmenopausal women.[3] There is sizeable evidence that MS can be reversed.[4]
Menopausal transition and postmenopausal state are considered as a vulnerable period for developing MS, and this increased risk has been attributed to decreasing estrogen levels with an increasing risk of insulin resistance following menopause.[5,6] The MS in postmenopausal women, in particular, needs to be given adequate attention as early as possible followed by an aggressive approach toward prevention and management. There is high prevalence of abdominal obesity, hypertension, diabetes, lipid abnormalities, and MS in Punjabi community that is significantly greater than reported studies elsewhere in India.[7] Obesity correlates strongly with multiple coronary risk factors, of which it is an important determinant.
As there is a paucity of data regarding the prevalence of MS in the Indian postmenopausal women and no study is available from Northern area; hence, we designed current study to find the prevalence of MS and its various components in Northern part of India.
METHODOLOGY
This study was conducted in the Department of Obstetrics and Gynaecology in the Apex Institute of North India. A total of 350 women (175 premenopausal and 175 postmenopausal) in the age group of 45–55 years were recruited for this study after assessing their eligibility according to the selection criteria. A woman on hormone replacement therapy, with secondary hypertension and history of smoking and alcoholism were excluded from the study. After inclusion criteria were fulfilled, written informed consent was taken from all women before recruitment for this study. A detailed history with regard to age, race, and socioeconomic status, occupation, and smoking, and drug intake, reproductive, and personal profile were elicited. Socioeconomic status was recorded as per Kuppuswamy's socioeconomic scale.[8]
Physical examination included the following parameters:
Body mass index (BMI) was calculated as weight in kilograms divided by height in meters squared. Those with BMI of 23.0–24.9 kg/m2 were classified as overweight, while those with BMI ≥25 kg/m2 were defined as obese[9]
Waist circumference was measured at the point halfway between the lower border of ribs and the iliac crest in a horizontal plane[10] and hip circumference was measured at the widest level over the greater trochanters
Systolic blood pressure (SBP) and diastolic blood pressure (DBP) were measured twice after 15 min of resting in sitting position in the right arm. Repeat measurements would be done at 5 min interval and average of 2 measurements was taken.
A venous blood sample was collected from all the subjects who came after 8–12 h overnight fast and was sent for fasting blood glucose, triglycerides, total cholesterol, low-density lipoprotein cholesterol, and high-density lipoprotein (HDL) cholesterol.
Postmenopausal women were considered to have MS if they had any three or more of the following (modified National Cholesterol Education Program Adult Treatment Panel III [NCEP ATP III criteria]).[11]
Central obesity: Waist circumference ≥80 cm
Hypertriglyceridemia: Serum triglycerides level ≥150 mg/dl
Low HDL cholesterol <50 mg/dl
High blood pressure: SBP ≥130 mmHg and/or DBP ≥85 mmHg or on treatment for hypertension
High fasting glucose: Serum glucose level ≥100 mg/dl or on treatment for diabetes (Type II).
After finding the prevalence, the association of MS with different factors was seen taking care of the confounders.
Statistical analysis
Quantitative data were presented as mean ± standard deviation or median and interquartile range as appropriate. Normality of data was checked by measures of Kolmogorov–Smirnov tests of normality. For normally distributed data, means were compared using unpaired t-test for two groups. For skewed data, Mann–Whitney test was applied. Chi-square test or Fisher's exact test was applied for categorical data. Logistic regression analysis was applied to assess the independent contribution of different factors to the presence of MS. P < 0.05 was considered to indicate statistical significance. All calculations were two-sided and were performed using SPSS version 15 (Statistical Packages for the Social Sciences, Chicago, IL, USA).
Approval by the Research and Ethics Committee
The protocol was approved by Institute's Ethical Committee and guidelines set up by ICMR (1994), and Helsinki Declaration (modified 2000) was adhered in all patients enrolled in the study.
RESULTS
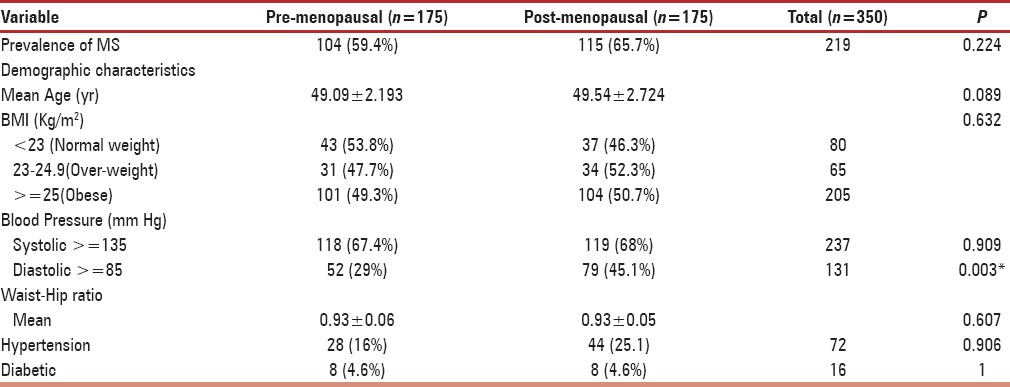
In this prospective cross-sectional analysis of 350 women (175 premenopausal and 175 postmenopausal), the prevalence of MS in the study, cohort was found to be 62.6% (219 women) according to the modified NCEP ATP III criteria. Table 1 represents the prevalence of MS and demographic characteristics of the study subjects. The two groups were matched in terms of age (P = 0.089), and the prevalence of MS in the premenopausal group (59.4%) was not significantly different from that of postmenopausal women (65.7%). The number of women who were known hypertensive or diabetic (Type II) were proportionally similar. The two groups did not differ significantly (P = 0.632) in BMI values, but the proportion of postmenopausal women who had higher diastolic pressure was significantly more (P = 0.003).
Table 1.
Prevalence of Metabolic syndrome & demographic characteristics of study groups
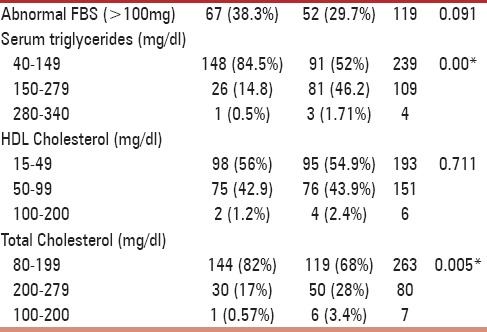
Biochemical analysis [Table 2] point to a significant higher level of serum triglycerides and total cholesterol (P < 0.05) among postmenopausal participants as compared to the premenopausal subjects; however, the levels of abnormal fasting glucose and HDL cholesterol were proportionally similar in both groups (P > 0.005).
Table 2.
Biochemical characteristics of study group
The prevalence of MS, distributed according to age, BMI, and duration of menopause is shown in Table 3. With respect to age, it was observed that the occurrence of MS (70%) was highest in the old age group (P = 0.05). There was a statistically significant correlation between the prevalence of MS and obesity (P = 0.000). It was also observed that longer was the duration of menopause, more was the proportion of women (75%) with MS.
Table 3.
The prevalence of MS according to age, BMI and duration of menopause
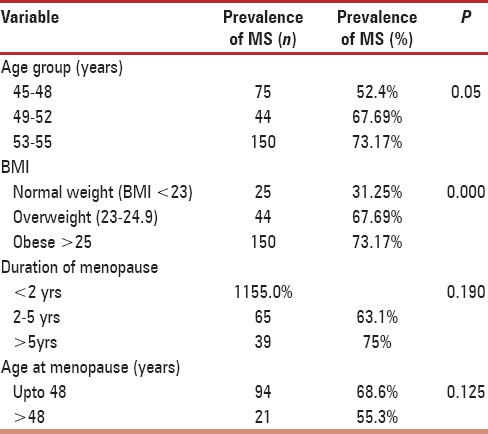
With respect to occupation, it was found that MS was significantly prevalent in housewives (P = 0.05) and similar trend was observed in the upper-class women (P = 0.049). Correlation of MS with age at menopause, educational status, parity, and family history was found statistically insignificant.
When the components of MS were examined separately, abnormal waist circumference was prevalent among 83% (289) of women followed by systemic hypertension in 71% (249), abnormal HDL in 55% (193), hypertriglyceridemia in 40% (140), and hyperglycemia in 36% (125) as depicted in Figure 1.
Figure 1.
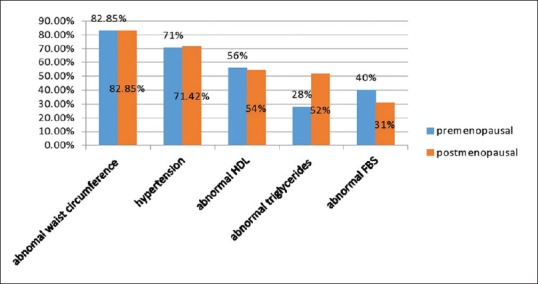
The prevalence of individual variables of metabolic syndrome in both groups
With respect to the correlation of various components with the prevalence of MS in terms of odd ratio, it was found to be highest for BMI followed by total cholesterol and waist-hip ratio [Figure 2].
Figure 2.
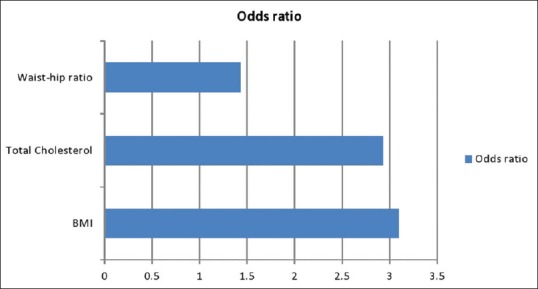
Correlation of other components with metabolic syndrome
DISCUSSION
The index study from North India assessed the prevalence of MS; it's prime components in pre- and post-menopausal women and in this endeavor to find a relation if at all present between postmenopausal status and MS. In various studies quoted, the prevalence of MS has varied from 31% to 60% in the different parts of the world.[12] In our study, the prevalence of MS was found to be higher in entire cohort (62.6%) as well as in pre- and post-menopausal group. The prevalence of MS was 45% in premenopausal and 55% in postmenopausal women according to a study done in Mumbai on urban women in the age group of 35–66 years.[13] Similarly, a cross-sectional study by Figueiredo Neto et al.[14] done in Brazil on 323 women between 40 and 65 years of age showed the prevalence to be 44.4% in postmenopausal women and 24% in premenopausal women by NCEP criteria and 61.5% and 37%, respectively by IDF criteria. The study carried out by Gupta et al.[7] in Punjabi Bhatia community found relatively lower prevalence of MS in both women (36.2%) and men (47.8%). The higher prevalence in our study (59.4% in premenopausal group and 65.7% in postmenopausal cohort) then above-mentioned studies could partly be explained by the fact that in the study by Pandey et al.,[13] all the known hypertensives and known diabetics were excluded unlike our study, in which we included both and because of the fact that prevalence is more in the Asians.[15,16] The higher prevalence in comparison to the study of Gupta et al.[7] can be explained by the fact the subjects included in our study were the women who visited the outpatient department of apex institute of North India, so had a greater chance of carrying the risk factors for MS, and may not be a true representative of the general population.
There was no significant difference in the prevalence of MS between premenopausal and postmenopausal women which was supported by the previous Indian study.[13] Higher prevalence reported in postmenopausal women in comparison to premenopausal group in few studies[17] can be explained by the fact that they had taken a wider age range in comparison to our study group (45–55 years).
The prevalence of MS increases from 6.7% in the third decade to 43.5% in the seventh decade.[13,14,18,19] We also observed a significant effect of age on the prevalence of MS. This is well in line with the observations made by other authors.[13,19] Strongest correlation of BMI with MS and significant effect of menopause on total cholesterol levels and serum triglyceride levels was also observed in our series. MS was more prevalent in housewives and upper socioeconomic group, so to conclude we can say that it is less frequently found in physically active people.
The component of MS which was most prevalent among the subjects having MS was abnormal waist circumference (94%) followed by hypertension (71.14%), low HDL (55.14), abnormal triglyceride (40%), and diabetes (35.71%) which is partly in agreement with the study by Marjani and Moghasemi[20] which found the highest prevalence for low HDL followed by waist circumference, hypertension, triglyceride, and diabetes. In a study done by Sawant et al.,[21] in which abdominal obesity was found to be most prevalent factor followed by total cholesterol levels, fasting blood glucose, high triglyceride levels, and low HDL levels in the descending order. Our study was partly in contrast to the study of Gupta et al.,[7] in which they found the maximum prevalent component to be hypertension (51%), followed by waist circumference (34%), triglycerides (33%), and diabetes (17%). The overall higher prevalence of different components of MS in the current study can be explained by a possible significant effect of age group (45–55 years) and the place of study (tertiary health-care center) we have chosen.
We tried to find the correlation between the different components of MS with the prevalence of MS. Maximum correlation of MS was found with HDL (odds ratio - 12.9) followed by waist circumference (odds ratio - 9.16), triglyceride (odds ratio - 6.2), hypertension (6.08), and least correlation was found with diabetes (odds ratio - 5.11). Jesmin et al.[17] found highest correlation between abnormal HDL levels and prevalence of MS, while study carried out by Afzal and Bashir[22] observed maximum correlation between hypertension and MS followed by obesity. Among other parameters, highest correlation of Ms was found with BMI and is in agreement to the observation made by Gupta et al.[7]
CONCLUSION
The prevalence of MS is very high in this part of India, and this can be attributed to the higher prevalence of obesity in the people in North India. Our study did not find effect of duration of menopause on the prevalence of MS probably because the age group selected had a narrow range of 45–55 years and women with duration of menopause >5 years were very less. The prevalence, however, is less in physically active people. Apart from obesity, the other major contributing factor was deranged lipid profile. We should target obesity and deranged lipid profile by bringing out changes in lifestyle and dietary habits to decrease the higher prevalence of MS and the risk of cardiovascular diseases.
Financial support and sponsorship
Nil.
Conflicts of interest
There are no conflicts of interest.
REFERENCES
- 1.Longo DL, Kasper DL, Jameson JL, Fauci AS, Hauser SL, Loscalzo J. Harrison's Principles of Internal Medicine. 18th ed. New York: The McGraw-Hill Companies; 2012. [Google Scholar]
- 2.de Ferranti SD. Recovery from metabolic syndrome is both possible and beneficial. Clin Chem. 2010;56:1053–5. doi: 10.1373/clinchem.2010.146647. [DOI] [PubMed] [Google Scholar]
- 3.Shah D. The annual conference of the British menopause society – June 2010. J Midlife Health. 2010;1:48–50. doi: 10.4103/0976-7800.66983. [DOI] [PMC free article] [PubMed] [Google Scholar]
- 4.Cameron AJ, Shaw JE, Zimmet PZ. The metabolic syndrome: Prevalence in worldwide populations. Endocrinol Metab Clin North Am. 2004;33:351–75. doi: 10.1016/j.ecl.2004.03.005. [DOI] [PubMed] [Google Scholar]
- 5.Rajewska J, Rybakowski JK. Depression in premenopausal women: Gonadal hormones and serotonergic system assessed by D-fenfluramine challenge test. Prog Neuropsychopharmacol Biol Psychiatry. 2003;27:705–9. doi: 10.1016/S0278-5846(03)00085-X. [DOI] [PubMed] [Google Scholar]
- 6.Carrasco GA, Van de Kar LD. Neuroendocrine pharmacology of stress. Eur J Pharmacol. 2003;463:235–72. doi: 10.1016/s0014-2999(03)01285-8. [DOI] [PubMed] [Google Scholar]
- 7.Gupta R, Sarna M, Thanvi J, Rastogi P, Kaul V, Gupta VP. High prevalence of multiple coronary risk factors in Punjabi Bhatia community: Jaipur Heart Watch-3. Indian Heart J. 2004;56:646–52. [PubMed] [Google Scholar]
- 8.Kumar N, Gupta N, Kishore J. Kuppuswamy's socioeconomic scale: Updating income ranges for the year 2012. Indian J Public Health. 2012;56:103–4. doi: 10.4103/0019-557X.96988. [DOI] [PubMed] [Google Scholar]
- 9.Grundy SM, Brewer HB, Jr, Cleeman JI, Smith SC, Jr, Lenfant C, et al. American Heart Association; National Heart, Lung. Definition of metabolic syndrome: Report of the National Heart, Lung, and Blood Institute/American Heart Association conference on scientific issues related to definition. Circulation. 2004;109:433–8. doi: 10.1161/01.CIR.0000111245.75752.C6. [DOI] [PubMed] [Google Scholar]
- 10.Dalton M, Cameron AJ, Zimmet PZ, Shaw JE, Jolley D, Dunstan DW, et al. Waist circumference, waist-hip ratio and body mass index and their correlation with cardiovascular disease risk factors in Australian adults. J Intern Med. 2003;254:555–63. doi: 10.1111/j.1365-2796.2003.01229.x. [DOI] [PubMed] [Google Scholar]
- 11.Grundy SM, Cleeman JI, Daniels SR, Donato KA, Eckel RH, Franklin BA, et al. Diagnosis and management of the metabolic syndrome: An American Heart Association/National Heart, Lung, and Blood Institute Scientific Statement. Circulation. 2005;112:2735–52. doi: 10.1161/CIRCULATIONAHA.105.169404. [DOI] [PubMed] [Google Scholar]
- 12.Leslie B. Metabolic Syndrome: Historical perspectives. The American Journal of the Medical Sciences. 2005;330:264–8. doi: 10.1097/00000441-200512000-00002. [DOI] [PubMed] [Google Scholar]
- 13.Pandey S, Srinivas M, Agashe S, Joshi J, Galvankar P, Prakasam CP, et al. Menopause and metabolic syndrome: A study of 498 urban women from western India. J Midlife Health. 2010;1:63–9. doi: 10.4103/0976-7800.76214. [DOI] [PMC free article] [PubMed] [Google Scholar]
- 14.Figueiredo Neto JA, Figuerêdo ED, Barbosa JB, Barbosa Fde F, Costa GR, Nina VJ, et al. Metabolic syndrome and menopause: Cross-sectional study in gynecology clinic. Arq Bras Cardiol. 2010;95:339–45. doi: 10.1590/s0066-782x2010005000094. [DOI] [PubMed] [Google Scholar]
- 15.Gupa R, Misra A. Type 2 diabetes in India: Regional disparities. Br J Diab Vasc Dis. 2007;7:12–6. [Google Scholar]
- 16.Misra A, Misra R. Asian Indians and insulin resistance syndrome: Global perspective. Metab Syndr Relat Disord. 2003;1:277–83. doi: 10.1089/1540419031361390. [DOI] [PubMed] [Google Scholar]
- 17.Jesmin S, Islam AM, Akter S, Islam MM, Sultana SN, Yamaguchi N, et al. Metabolic syndrome among pre- and post-menopausal rural women in Bangladesh: Result from a population-based study. BMC Res Notes. 2013;6:157. doi: 10.1186/1756-0500-6-157. [DOI] [PMC free article] [PubMed] [Google Scholar]
- 18.Ford ES, Giles WH, Dietz WH. Prevalence of the metabolic syndrome among US adults: Findings from the third National Health and Nutrition Examination Survey. JAMA. 2002;287:356–9. doi: 10.1001/jama.287.3.356. [DOI] [PubMed] [Google Scholar]
- 19.Ruan X, Jin J, Hua L, Liu Y, Wang J, Liu S. The prevalence of metabolic syndrome in Chinese postmenopausal women and the optimum body composition indices to predict it. Menopause. 2010;17:566–70. doi: 10.1097/gme.0b013e3181c8f4e1. [DOI] [PubMed] [Google Scholar]
- 20.Marjani A, Moghasemi S. The metabolic syndrome among postmenopausal women in Gorgan. Int J Endocrinol. 2012;2012:953627. doi: 10.1155/2012/953627. [DOI] [PMC free article] [PubMed] [Google Scholar]
- 21.Sawant A, Mankeshwar R, Shah S, Raghavan R, Dhongde G, Raje H, et al. Prevalence of metabolic syndrome in urban India. Cholesterol. 2011;2011:920983. doi: 10.1155/2011/920983. [DOI] [PMC free article] [PubMed] [Google Scholar]
- 22.Afzal S, Bashir MN. Prevalence of metabolic syndrome in pre and postmenopausal diabetics. Biomedica. 2008:24. [Google Scholar]


