

Abstract
Emerging T‐helper type 2 (Th2) cytokine‐based asthma therapies, such as tralokinumab, lebrikizumab (anti‐interleukin (IL)‐13), and mepolizumab (anti‐IL‐5), have shown differences in their blood eosinophil (EOS) response. To better understand these effects, we developed a mathematical model of EOS dynamics. For the anti‐IL‐13 therapies, lebrikizumab and tralokinumab, the model predicted an increase of 30% and 10% in total and activated EOS in the blood, respectively, and a decrease in the total and activated EOS in the airways. The model predicted a rapid decrease in total and activated EOS levels in blood and airways for the anti‐IL‐5 therapy mepolizumab. All model‐based predictions were consistent with published clinical observations. The modeling approach provided insights into EOS response after treatment with Th2‐targeted therapies, and supports the hypothesis that an increase in blood EOS after anti‐IL‐13 therapy is part of the pharmacological action of these therapies.
Study Highlights.
WHAT IS THE CURRENT KNOWLEDGE ON THE TOPIC?
☑ Historically, high blood EOS count has been associated with more severe asthma symptoms. Emerging anti‐inflammatory therapies, such as tralokinumab and lebrikizumab, have shown efficacy in improving lung function, but show an increase in blood EOSs. On the contrary, benralizumab and mepolizumab also show efficacy in reducing asthma exacerbations, but cause a reduction in blood EOS.
WHAT QUESTION DOES THIS STUDY ADDRESS?
☑ The question that this study aims to address is whether mechanistic understanding of changes in blood EOS could provide insights into the pharmacology profile of targeted anti‐Th2 therapies. Animal models are not useful in this setting due to fundamental differences in their immune systems.
WHAT THIS STUDY ADDS TO OUR KNOWLEDGE
☑ Our novel, model‐based approach provides a quantitative explanation for biomarker changes linked to the mechanism of action, while providing synthetic evidence supporting their therapeutic benefit (i.e., reduction in lung EOS that is difficult to gather in a clinical setting). This study also supports the value of systems modeling in evaluating biomarker hypotheses for patient selection.
HOW MIGHT THIS CHANGE DRUG DISCOVERY, DEVELOPMENT, AND/OR THERAPEUTICS?
☑ Our model contributes to our understanding of the clinical pharmacology of these compounds by providing a link between observable blood biomarker changes and unobservable site‐of‐action biomarker changes and providing a framework for evaluating biomarker hypotheses using systems modeling.
Eosinophilic (EOS) airway infiltration is a key feature of the airway inflammatory process in asthma. Precision targeted therapy using monoclonal antibodies against EOS‐related, interleukin (IL)‐5 and IL‐4/IL‐13 pathways are under development for managing severe uncontrolled asthma.1 Those currently in development include mepolizumab and reslizumab (anti‐IL‐5), benralizumab (an anti‐IL‐5 receptor antibody with antibody‐dependent cytotoxicity), lebrikizumab (anti‐IL‐13), tralokinumab (anti‐IL‐13), and dupilumab (anti‐IL‐4/IL‐13).2, 3, 4, 5, 6, 7, 8 Phase II and III clinical trials have demonstrated that these antibodies reduce asthma exacerbations and lung function improvements (forced expiratory volume in 1 second).2, 3, 4, 5, 6, 7, 8 One important difference among these therapies is their effect on blood EOS; benralizumab, mepolizumab, and reslizumab profoundly decrease EOS in both the blood and airways, whereas tralokinumab, lebrikizumab, and dupilumab increase blood EOS.6, 7, 8
It has been speculated that anti‐IL‐13 therapies increase blood EOS by interfering with the role of IL‐13 in EOS trafficking from the blood to the airways.9, 10 However, this hypothesis does not consider the impact of other processes governing blood EOS levels, such as the direct effect of IL‐13 blockade on EOS survival and activation, as well as indirect effects through other cytokines on EOS maturation/release, activation, and survival. Furthermore, a more quantitative understanding of these processes is required to gain a more insightful understanding of the underlying pharmacology and better understand the in vivo effects of these therapies; for instance, the possible existence of a T‐helper type 2 (Th2)‐high subpopulation that is more responsive to these therapies.10 We have utilized a mathematical modeling approach to analyze why anti‐IL‐5 and anti‐IL‐13 monoclonal antibodies have different effects on blood EOS.
Previously, there have been a few attempts to mathematically describe the inflammatory processes in asthma. Vogel et al.11 and Kim et al.12 developed models to study interactions between T‐helper type 1 and Th2 cell populations and to understand mechanisms of abnormal proliferation of CD4+ cells into Th2 cells. Walsh et al.13 proposed a model that reproduced the accumulation of immune cells and cytokines in murine lungs during allergic airway response. Blood and lung eosinophilia have also been described in the model previously developed by Demin et al.14 to understand the impact of anti‐leukotriene treatment on EOS and forced expiratory volume in 1 second; however, these models have not explicitly addressed the impact of anti‐Th2 cytokine treatment on EOS dynamics in humans.
The development of this new, EOS‐focused model allowed us to analyze the effect of anti‐IL‐5/IL‐13 monoclonal antibodies on each factor controlling blood EOS levels. We also used this model to assess baseline periostin as a marker of the Th2 pathway, and its response to anti‐IL‐13 therapy compared to blood EOS. The model was calibrated and verified using separate sets of published clinical data.
METHODS
The main processes considered in the model are depicted in Figures 1 a and 1b. The model takes into account the following aspects of immune cells/cytokine/chemokine homeostasis in bone marrow, blood plasma, and airways:
Figure 1.
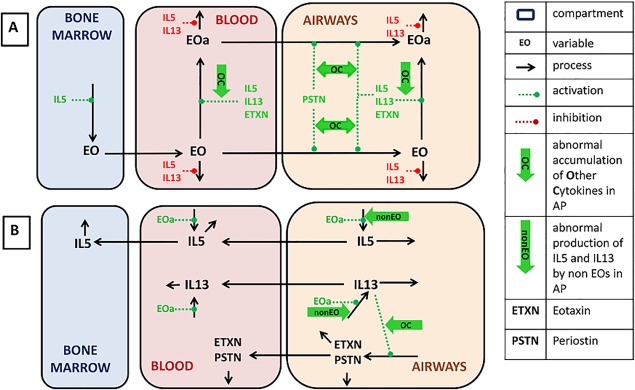
Schematic representation of key processes considered in the model. (a) Eosinophil (EOS) dynamics and regulations. (b) Cytokine dynamics and regulations. Black arrows denote model reactions. Positive and negative influences are marked by dashed green and red arrows, correspondingly. Abnormal processes switched on in asthmatics (sensitization of model processes and regulations by other cytokines and interleukin (IL)‐5/IL‐13 production by non‐EOS) are marked by thick green arrows.
Dynamics of EOS, including maturation, migration, activation, death, and IL‐5/IL‐13 production.
IL‐13‐induced production of eotaxin and periostin by lung epithelial cells.
Production of IL‐5 and IL‐13 by cells other than EOS.
Distribution between airways and blood, and elimination of IL‐5, IL‐13, eotaxin, and periostin.
Regulatory influences of IL‐5, IL‐13, eotaxin, and periostin on EOS dynamics.
Ability of cytokines other than IL‐5, IL‐13, eotaxin, and periostin to sensitize effect of IL‐5, IL‐13, eotaxin, and periostin on EOS dynamics.
The EOS levels in the blood and lungs depend on EOS maturation in bone marrow, distribution between bone marrow, blood, and airways, and apoptosis (Figure 1 a). EOS maturation takes place in bone marrow and is stimulated by IL‐5.15 Mature EOS, released into the blood, can migrate to the airways. EOS trafficking from blood to airways is regulated strongly by eotaxin and periostin, whose production is stimulated (see Figure 1 b) by IL‐13.16 In plasma and airways, EOS undergoes reversible activation accompanied by their degranulation and IL‐5/IL‐13 production.17 The total EOS pool in the model represents the sum of activated EOS and inactive EOS. IL‐5 is the most powerful activator among those produced by cells presented as model variables of EOS, whereas IL‐13 and eotaxin are less potent activators.18, 19, 20 Activated EOS produce cytokines, such as IL‐521 and IL‐13.22 EOS apoptosis is inhibited mainly by IL‐523 and with less potency by IL‐13.
The dynamics of cytokines IL‐5, IL‐13, eotaxin, and periostin are depicted in Figure 1 b. IL‐5 and IL‐13 are produced by activated EOS in the airways and blood. Eotaxin and periostin are produced only in the airways, where they stimulate EOS migration from blood to the airways. Figure 1 shows that IL‐5, IL‐13, eotaxin, and periostin are distributed between airways and blood, and can be eliminated from both compartments. Other cells (e.g., Th2, mast cells, etc.) that also produce IL‐5/IL‐13 are not explicitly accounted for in the model, but their contribution is taken into account in the overall levels of production of these cytokines. Contributions of these cells are considered invariant during the timescale described by this model. Similarly, other inflammatory mediators, such as tumor necrosis factor alpha and leukotrienes, can also contribute to the stimulation of eotaxin/periostin production by IL‐13, stimulation of EOS migration by eotaxin/periostin, and EOS activation by IL‐5/IL‐13 in airways;19, 24, 25 these mediators are combined in this model. Although the levels of these cytokines are not explicitly accounted for in the model, their impact on sensitization of inflammatory processes is taken into account. The strategy of model parameter identification is presented in Table 1 and Supplementary Information, Section 2.
Table 1.
Data types used for model calibration (see Supplementary Information for details and references)
| Step | Description | Type of data used in the step | Parameters identified |
|---|---|---|---|
| 1 | Evaluation of individual effects of IL‐5, IL‐13, eotaxin, and periostin on EOS dynamics and IL‐13 influence on eotaxin and periostin production (Supplementary Information, Section 2) | (1) In vitro data characterizing influence of cytokines on EOS activation, trafficking, apoptosis, and proliferation, eotaxin, and periostin production measured in human cell cultures; (2) KO mice data describing periostin influence on EOS chemotaxis | Regression parameters, EC50s and Fmax in Eqs. S18, S28, S31, S33 in Supplementary Information, Section 1 |
| 2 | Calibration of the model against in vivo data (Supplementary Information, Section 2) | Human data: steady‐state levels of EOS and cytokines in lungs and blood of healthy subjects and subjects with asthma | Rate constants in Eqs. S15–S26, S29, S32 in Supplementary Information, Section 1 |
| 3 | Identification of mAb pharmacokinetic and pharmacodynamic parameters (Supplementary Information, Section 3) | (1) Drug level in plasma measured in humans; (2) in vitro data characterizing mAb affinity to IL‐5 and IL‐13 | Rate constants in Eqs. S45, S51 in Supplementary Information, Section 3 |
EOS, eosinophil; IL, interleukin; KO, knockout; mAb, monoclonal antibody.
The model allows reproduction of immune cell/cytokine homeostasis in healthy subjects and subjects with asthma and their response to anti‐IL‐5/IL‐13 therapies, but it does not consider the transition between healthy subjects and subjects with asthma. The processes governing EOS dynamics are all essentially the same in the model between healthy subjects and subjects with asthma, except for two differences: (1) In the healthy state, there is some residual synthesis of IL‐5/IL‐13 by EOS, but no synthesis by non‐EOS (e.g., Th2 and mast cells); in the asthmatic state, the latter is switched on. This non‐zero value of IL‐5/IL‐13 production by non‐EOS in the asthmatic version of the model is justified by abnormal accumulation of Th2 and mast cells in airways and Th2‐associated cytokine production.25 The non‐zero synthesis rate is identified on the basis of steady‐state cell and chemokine data measured in subjects with asthma (Figure 2). (2) The sensitivity of eotaxin/periostin production and EOS migration and activation to IL‐5, IL‐13, eotaxin, and periostin is greater in subjects with asthma. This greater sensitivity in subjects with asthma is justified by accumulation of proinflammatory cytokines other than IL‐5, IL‐13, eotaxin, and periostin (e.g., immunoglobulin E), which are able to affect EOS cell dynamics.
Figure 2.
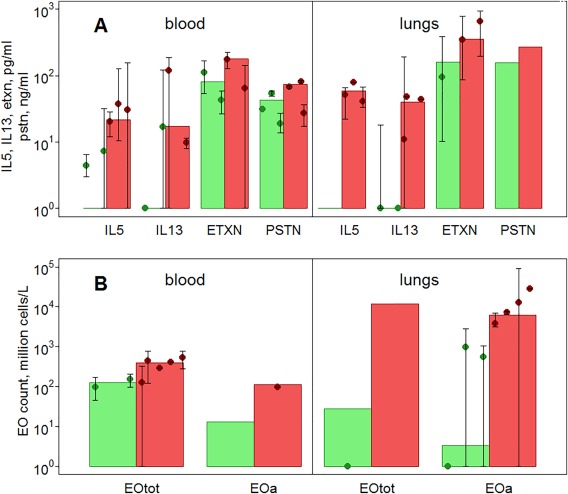
Reproduction of cytokine and eosinophil (EOS) base levels in healthy subjects and pooled subjects with mild/moderate/severe asthma in the model. (a) Cytokines. (b) EOS. Sources of data are given in Supplementary Table S8. Green/red bars represent model predictions for healthy subjects/subjects with asthma, dots with error bars represent experimental data taken from the literature.
Regulatory feedback within this model (e.g., the influence of cytokines and chemokines on EOS maturation, activation, chemotaxis, and survival, and the influence of IL‐13 on eotaxin and periostin production) is described by empirical equations (either linear or Michaelis–Menten‐type equations). Parameters of these equations were estimated from appropriate in vitro data obtained from published literature.
Pharmacokinetics of tralokinumab and mepolizumab were described by two‐ and one‐compartment models, respectively (Supplementary Information, Section 3). Pharmacokinetic and cytokine binding affinity (Kd) data were obtained from published literature.2 Pharmacokinetic parameters and Kd were used in the standard binding equation to predict cytokine suppression.
For all simulations, anticytokine antibodies were assumed to be delivered at time zero and the variables of the model were tracked continuously. Change of IL‐5, IL‐13, eotaxin, and periostin in response to anti‐IL treatment is automatically calculated; the impact of anti‐IL‐5/IL‐13 therapy on reductions in cytokine synthesis and dampening of the sensitivity to cytokine mediated inflammatory processes (reversal of steps 1 and 2 in the section above) were implemented based on data from the literature (see Supplementary Information, Section 3, for detailed description). Changes in other metabolites26 and activated cells in lungs27 were not observed in response to mepolizumab administration, whereas ∼15% decrease of CCL17 and CCL13 was observed after administration of the anti‐IL‐13 antibody lebrikizumab.10 Accordingly, IL‐5/IL‐13 production by non‐EOS was not changed for mepolizumab simulations and was reduced by 15% after treatment was started for tralokinumab simulations.
Confidence intervals for model predictions were obtained using Monte‐Carlo sampling from parameter distribution. The covariance matrix of parameter distribution was calculated from the Hessian matrix of residual sum of squares function using DBSolve software.28
For the simulation of Th2‐high vs. ‐low subpopulations, a sensitivity analysis was performed to identify the main determinants of serum periostin levels. The four most sensitive parameters (see Supplementary Information, Section 4) were chosen and multiple values simulated assuming log‐normal distribution of the parameters.29 Steady‐state levels of cytokines and cells in patients with asthma were calculated for 1,200 sets of parameters using the system of equations and parameters described earlier.
RESULTS
Model adequately describes cytokine and EOS levels in healthy subjects and subjects with asthma
Figure 2 shows a comparison of the predicted and observed steady‐state levels of key variables in healthy subjects (green) and subjects with asthma (red). Figure 2 a shows that there is very little, or no, IL‐5 and IL‐13 in the blood and airways of healthy subjects,30, 31 justifying the model assumption of negligible basal production of these cytokines. There is significant variability in reported cytokine steady‐state concentrations, but a 5–10‐fold increase of cytokine levels in the airways and blood compared with concentrations in healthy subjects has been reported. This increase was associated with up to twofold increase in eotaxin and periostin in subjects with asthma.32, 33
Figure 2 b demonstrates the large variability in the EOS levels (both total and active) that has been reported in the literature, presumably because of differences in disease state and etiology. Some information could not be found in the literature (e.g., active EOS levels in the blood of healthy subjects and airway periostin levels in both populations); therefore, these predictions were not verifiable.
Model adequately reproduces EOS and chemokine change in subjects with asthma in response to anti‐IL‐13 and anti‐IL‐5 treatment
Predicted and observed active and total EOS changes in the blood and airways in response to mepolizumab and tralokinumab treatment are presented in Figure 3. More details, including data on lebrikizumab and dupilumab, are presented in Supplementary Information, Section 3.
Figure 3.
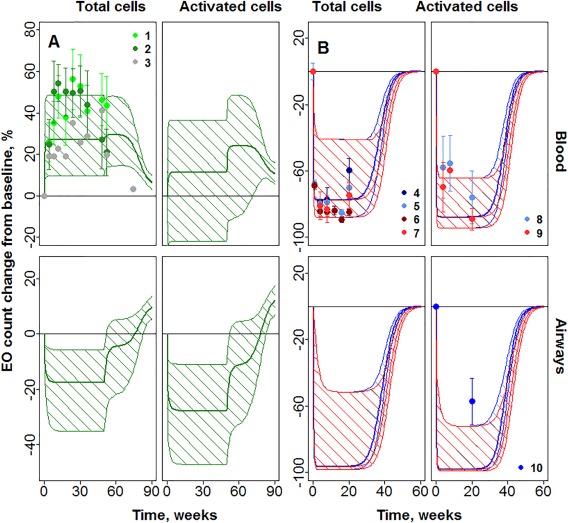
Prediction of mepolizumab and tralokinumab influence on eosinophils (EOS). (a) Change of total EOS in blood, activated EOS in blood, total EOS in lungs, and activated EOS in lungs in response to tralokinumab treatment. (b) Change of total EOS in blood, activated EOS in blood, total EOS in lungs, and activated EOS in lungs in response to mepolizumab treatment. Dots with numbers denote experimental data, error bars denote SE. Thick lines denote median for model predictions; thin lines denote 95% confidence intervals. Predictions for mepolizumab 250 mg (blue) and 750 mg (red), for tralokinumab 300 mg (green). 1 = Mean data for 300 mg Q2W (MedImmune, data on file); 2 = mean data for 300 mg Q2/4W (MedImmune, data on file); 3 = median data for 300 mg Q2W; 4 = 250 mg34; 5 = 250 mg35; 6 = 750 mg34; 7 = 750 mg35; 8 = 250 mg35; 9 = 750 mg35; and 10 = 750 mg.27
An overall decrease in blood EOS (total and active) is predicted for mepolizumab and an increase in blood EOS (total and active) is predicted for tralokinumab, similar to clinical observations34, 35 and MedImmune data on file, respectively. Near maximal reduction in blood EOS is predicted for mepolizumab in the dose range 250–750 mg, similar to previous reports.34, 35 On cessation of dosing, the EOS counts return to baseline levels 30–40 weeks after the final dose (Figure 3). Contrary to blood EOS, both tralokinumab and mepolizumab are predicted to decrease the number of total and active EOS in airways (Figure 3). This may provide an explanation for the efficacy of both these compounds in reducing asthma exacerbations in spite of their differing effects on blood EOS. Available data for mepolizumab27, 34 indicates about 55–85% reduction in airway EOS, whereas near‐complete reduction in airway EOS is predicted in the model.
The model‐predicted decrease of periostin during tralokinumab treatment was ∼40%, almost twofold greater than observed (Figure 4 a; MedImmune, data on file). A fast decline of eotaxin by 50% is observed after initiation of dupilumab, according to model predictions and experimental data (Figure 4 b 7; see also Supplementary Information, Section 3).
Figure 4.
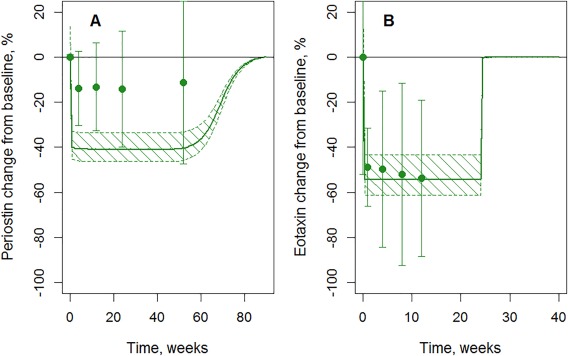
Validation and prediction of dupilumab and tralokinumab influence on blood cytokines. (a) Periostin change during tralokinumab 300 mg Q2W administration (MedImmune, data on file). (b) Eotaxin change during dupilumab 300 mg Q4W administration (data from Wenzel et al.,7 Supplementary Figure S7). Dots denote experimental data, error bars denote SD, solid lines denote model predictions, and dashed areas denote 95% confidence bands for model predictions.
Model‐predicted mechanisms of blood EOS response
To explore the underlying mechanisms governing blood EOS response, we simulated treatment influence on EOS dynamics for mepolizumab and tralokinumab at week 30 of treatment when the maximum drug effect on EOS is observed (Figure 5). After tralokinumab administration, the model predicts an approximate reduction of 50% in the EOS trafficking rate from blood to lungs, primarily due to blockade of the production of the most potent chemokine, eotaxin. As a consequence, EOSs are isolated in the blood and do not migrate to the airways. Predicted direct impact on other processes (e.g., apoptosis, activation, and proliferation) is negligible. In contrast, the primary reason for the decrease in EOS numbers in the blood and lungs for mepolizumab is a large increase in the predicted apoptosis rate, due to the substantial decline of free IL‐5. An approximate 50% reduction in the release rate from bone marrow further contributes to lower EOS levels. There is predicted to be little impact on the EOS chemotaxis rate into the airways for mepolizumab; however, the model predicts an overall drop of activated EOS in airways for both mepolizumab and tralokinumab, resulting from reduction of activation of EOS in the blood and airways (Supplementary Figure S16).
Figure 5.
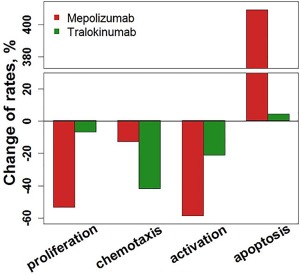
Model‐predicted change from the start of therapy of eosinophil proliferation, apoptosis, chemotaxis, and activation rates in blood at Week 30 of mepolizumab or tralokinumab treatment. Bars denote model predictions.
Model‐based simulation of periostin‐high vs. ‐low subpopulations
The virtual population generated using the model showed a weak correlation between serum periostin and lung eosinophilia status (Figure 6), when separated into two equal‐sized groups based on those above and below the median periostin level. Simulations also indicated a greater magnitude of EOS change in the blood and airways after treatment in the periostin‐high group compared with the periostin‐low group (Supplementary Information, Section 4).
Figure 6.
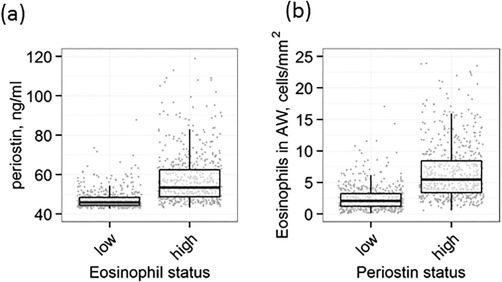
Correlation between periostin and tissue eosinophil (EOS) obtained by simulation of virtual subjects (a) dependence of periostin on tissue eosinophils; (b) predictive ability of periostin value for tissue eosinophilia.
DISCUSSION
We have used a mathematical modeling approach to provide insights into the pharmacological process that is driving clinically reported changes in blood EOS after treatment with tralokinumab and mepolizumab.34 This model adequately describes cytokine and EOS levels in healthy subjects and subjects with asthma, reproduces EOS and chemokine changes in subjects with asthma in response to anti‐IL‐5 and anti‐IL‐13 treatment, and provides insights into the role of periostin as a marker of response to treatment, thus providing an overall insight into the mechanism of action of these targeted agents.
The model provides an adequate description of the calibration data in healthy subjects and subjects with asthma, considering the high variability in data reported in the literature (Figure 2). An interesting estimate from the model is that between healthy and asthmatic states, the production of IL‐5/IL‐13 increases by ∼15‐fold, whereas eotaxin and periostin production increases only 1.5–2‐fold. One reason for this may be the presence of redundant mechanisms of chemokine production (e.g., IL‐4‐mediated synthesis).16
The model predicts an increase in blood EOS and a decrease in lung EOS for anti‐IL‐13 therapy and a decrease in both blood and lung EOS for anti‐IL‐5 treatment (Figure 3). As previously suggested by Hanania et al.9 and Corren et al.,10 the largest direct impact of tralokinumab on EOS dynamics is predicted by the model on prevention of EOS airway chemotaxis through reduced levels of eotaxin and periostin. However, IL‐13 treatment has other effects, including reduced EOS survival, and prevention of EOS maturation and release through suppression of IL‐5; both of these effects serve to decrease blood EOS. Increase in EOS levels due to sequestration in blood counters the other effects, thus resulting in a net increase in blood and reduction in lung EOS levels. Although human studies have not confirmed the effect of IL‐13 treatment on lung EOS levels, the predicted magnitude of changes is in line with that reported in animal models by May et al.,2 after tralokinumab treatment. An ongoing study, based on this model's predictions, is currently being performed to assess airway and blood EOS changes after tralokinumab treatment.
A greater than threefold increase in the apoptosis rate coupled with a twofold reduction in the proliferation/release rate from the bone marrow is the main reason for the reduction in blood EOS after anti‐IL‐5 therapy with mepolizumab. The role of mepolizumab on proliferation and release is known,36 but its role on reduced EOS survival may not be fully appreciated, although neutralization of IL‐5 was shown to reverse prolonged EOS survival in nasal polyps.37 Our model predicts that the survival effect may be responsible for the rapid decline in EOS levels – near maximal reduction in blood EOS levels is seen within 2 weeks after the start of mepolizumab treatment.38 A similar effect is also seen on EOS apoptosis in the lungs (Supplementary Information, Section 4), resulting in a prediction of rapid, near‐complete depletion of EOS in the lungs. These predictions are similar to observations by Büttner et al.,35 who saw sustained reduction in EOS number and activation after mepolizumab treatment. The model predicts near‐complete EOS depletion in the lungs after mepolizumab treatment, but data from sputum samples in humans with asthma27, 34 indicate a mean reduction of ∼55–85%. There are several possible explanations for this discrepancy – incomplete neutralization of IL‐5 in the tissues,39 activation by other proinflammatory cytokines, including IL‐1326 and eotaxin39 not considered in the proposed model, and experimental variability. In contrast to mepolizumab, benralizumab administration results in near‐complete reduction in sputum EOS,40 which may be due to the direct action of this compound in binding EOS and recruiting natural‐killer cells.
Periostin production in airway epithelial cells is stimulated by IL‐13; therefore, periostin is considered a biomarker of the Th2 pathway. The observed change in serum periostin levels after IL‐13 treatment with lebrikizumab or tralokinumab was twofold lower than predicted by the model. Steady‐state serum periostin concentrations are 60% greater in subjects with asthma compared with healthy subjects in the model (Figure 2 a) and, as expected, the model predicts the reduction of periostin levels to those seen in healthy subjects in response to tralokinumab treatment (Figure 4 a). One explanation for this discrepancy could be lack of information in the model on the relative contribution of various cytokines that stimulate periostin production. Large variability between steady‐state level data used to characterize the periostin synthesis rate33, 41, 42 in the model could also have caused this difference. The model provided a good description of the eotaxin data after dupilumab administration (Figure 4 b); furthermore, data obtained for cynomolgus monkeys after allergen challenge indicate eotaxin reduction to baseline levels (before sensitization) in response to IL‐13 blockade,43 which is in accordance with model predictions. The narrow range of change after treatment in these two markers and the high variability limit their utility as easy‐to‐measure markers of drug‐dose response – an important requirement in this therapeutic area.
A virtual population simulated with the model had similar characteristics to observations, including a positive correlation between periostin and blood EOS. With anti‐IL‐13 treatment, there is dissociation between changes in blood EOS and serum periostin levels, the former increasing and the latter decreasing. This is a clinically relevant observation because it suggests that changes in serum periostin with tralokinumab treatment will be more reflective of changes in airway EOS than changes in blood EOS, thus lending support to the use of periostin as a possible marker of response.10, 44 A more detailed analysis, including the correct correlation between the variables influencing periostin levels and their true population variability, is required to make more realistic predictions on population response to these therapies and, hence, the value of periostin as a predictive biomarker. However, this is the first report highlighting the utility of systems modeling in identifying biomarker hypotheses in a severe asthma setting.
As is often the case for these types of models, simplifications of the biological system have been made during model development to ensure that the model was “fit‐for‐purpose” and not unnecessarily complex. In our model, only the effect of IL‐5 and IL‐13 are explicitly considered on the various processes. However, it is well known that other factors, such as platelet‐activating factor and cys‐leukotrienes are also involved in the maturation, release, and airway trafficking of EOS.45, 46 Similarly, other cells, including mast cells and T cells, also produce IL‐5/IL‐13.47, 48 By “lumping” other inflammatory cells in the model and, similarly, all other cytokines/chemokines other than IL‐5/IL‐13, eotaxin, and periostin, any difference in response among these cytokines/chemokines and the differential impact on EOS is not captured by the model. We also assumed that the general anti‐inflammatory impact of anti‐IL‐13 treatment resulted in a 15% reduction in “other cytokines” participating in EOS dynamics. This was based on data from Corren et al.,10 who reported an ∼15% change in CCL‐13, CCL‐17, and immunoglobulin E after lebrikizumab treatment. We did not include the effect of anti‐IL‐5 treatment on other cytokines in our model, because neither a change in levels of other inflammatory mediators (IL‐4, interferon gamma, etc.26; Supplementary Information, Section 3) nor activated cells (other than eosinophils) in the lungs27 was observed in response to mepolizumab administration; however, some data indicate increased production of eotaxin.39 Thus, neglecting the mepolizumab effect on cytokines may provide a reason for an overestimate of the impact of anti‐IL‐5 treatment on EOS levels in the lungs. Furthermore, the model does not account for different asthma phenotypes (e.g., Th2‐driven or neutrophilic asthma); a more detailed understanding of the different asthma pathophysiological processes would be required for such an analysis. In addition, the effect of inhaled corticosteroids treatment is not explicitly modeled. This effect is implicitly considered by calibration of the model against baseline data in subjects with asthma who are already receiving inhaled corticosteroids (Figure 2). The model cannot be used to evaluate the impact of anti‐Th2 cytokine therapy on factors such as potential reduction in inhaled corticosteroids dose. In light of these assumptions, predictions by the model should be considered a hypothesis‐generating semiquantitative attempt providing a convenient starting point for the exploration of the dynamics of the Th2 inflammation pathway.
In conclusion, a mathematical model of cytokine/chemokine‐mediated EOS dynamics has been built and verified. The model indicates that different processes are impacted by anti‐IL‐5 and anti‐IL‐13 treatment causing differences in the changes in blood EOS. Inhibition of trafficking because of tralokinumab treatment is the primary cause of the net increase in blood EOS. This increase is associated with an expected reduction in lung EOS, both active and total. Baseline variability in the inflammatory markers could serve to explain existence of Th2‐high vs. ‐low populations, which respond differently to anti‐IL‐13 therapy. The role of tralokinumab on EOS trafficking in the periphery, blood, and lungs, as well as understanding possible biomarkers, such as DPP‐4,44 are areas for further investigation.
Supporting information
Supporting Information
Acknowledgments
The authors are grateful to the AstraZeneca tralokinumab global project team members for their input and review of this manuscript. We thank Dr Jo Oswald, from QXV Communications, an Ashfield business, part of UDG Healthcare PLC, Macclesfield, UK, who provided editing support funded by MedImmune/AstraZeneca. This study was funded by MedImmune.
Conflict of Interest
T.K., V.V., and O.D. are external consultants who were paid to do this research. B.M.A. is an employee of MedImmune. G.C. is an employee of AstraZeneca.
Author Contributions
T.K., V.V., O.D., G.C., and B.M.A. wrote the article. T.K., V.V., O.D., and B.M.A. designed the research. T.K. and V.V. performed the research. T.K. and V.V. analyzed the data. T.K. and V.V. contributed equally to this work.
References
- 1. Mitchell, J. , Dimov, V. & Townley, R.G. IL‐13 and the IL‐13 receptor as therapeutic targets for asthma and allergic disease. Curr. Opin. Investig. Drugs 11, 527–534 (2010). [PubMed] [Google Scholar]
- 2. May, R.D. et al Preclinical development of CAT‐354, an IL‐13 neutralizing antibody, for the treatment of severe uncontrolled asthma. Br. J. Pharmacol. 166, 177–193 (2012). [DOI] [PMC free article] [PubMed] [Google Scholar]
- 3. Murray, L.A. et al Targeting interleukin‐13 with tralokinumab attenuates lung fibrosis and epithelial damage in a humanized SCID idiopathic pulmonary fibrosis model. Am. J. Respir. Cell Mol. Biol. 50, 985–994 (2014). [DOI] [PMC free article] [PubMed] [Google Scholar]
- 4. Piper, E. et al A phase II placebo‐controlled study of tralokinumab in moderate‐to‐severe asthma. Eur. Respir. J. 41, 330–338 (2013). [DOI] [PMC free article] [PubMed] [Google Scholar]
- 5. Brightling, C.E. et al Benralizumab for chronic obstructive pulmonary disease and sputum eosinophilia: a randomised, double‐blind, placebo‐controlled, phase 2a study. Lancet Respir. Med. 2, 891–901 (2014). [DOI] [PMC free article] [PubMed] [Google Scholar]
- 6. Castro, M. et al Reslizumab for poorly controlled, eosinophilic asthma: a randomized, placebo‐controlled study. Am. J. Respir. Crit. Care Med. 184, 1125–1132 (2011). [DOI] [PubMed] [Google Scholar]
- 7. Wenzel, S. et al Dupilumab in persistent asthma with elevated eosinophil levels. N. Engl. J. Med. 368, 2455–2466 (2013). [DOI] [PubMed] [Google Scholar]
- 8. Noonan, M. et al Dose‐ranging study of lebrikizumab in asthmatic patients not receiving inhaled steroids. J. Allergy Clin. Immunol. 132, 567–574 (2013). [DOI] [PubMed] [Google Scholar]
- 9. Hanania, N.A. et al Lebrikizumab in moderate‐to‐severe asthma: pooled data from two randomised placebo‐controlled studies. Thorax 70, 748–756 (2015). [DOI] [PMC free article] [PubMed] [Google Scholar]
- 10. Corren, J. et al Lebrikizumab treatment in adults with asthma. N. Engl. J. Med. 365, 1088–1098 (2011). [DOI] [PubMed] [Google Scholar]
- 11. Vogel, R. et al Modeling and simulation in science, engineering and technology pp 144–155 (eds. Deutsch A. et al) Mathematical Modeling of Biological Systems, Volume II (Springer, New York, NY, 2008). [Google Scholar]
- 12. Kim, Y. et al Regulation of Th1/Th2 cells in asthma development: a mathematical model. Math. Biosci. Eng. 10, 1095–1133 (2013). [DOI] [PubMed] [Google Scholar]
- 13. Walsh, E.R. , Thakar, J. , Stokes, K. , Huang, F. , Albert, R. & August, A. Computational and experimental analysis reveals a requirement for eosinophil‐derived IL‐13 for the development of allergic airway responses in C57BL/6 mice. J. Immunol. 186, 2936–2949 (2011). [DOI] [PubMed] [Google Scholar]
- 14. Demin, O. et al Systems pharmacology models can be used to understand complex pharmacokinetic‐pharmacodynamic behavior: an example using 5‐lipoxygenase inhibitors. CPT Pharmacometrics Syst. Pharmacol. 2, e74 (2013). [DOI] [PMC free article] [PubMed] [Google Scholar]
- 15. Clutterbuck, E.J. , Hirst, E.M. & Sanderson, C.J. Human interleukin‐5 (IL‐5) regulates the production of eosinophils in human bone marrow cultures: comparison and interaction with IL‐1, IL‐3, IL‐6, and GMCSF. Blood 73, 1504–1512 (1989). [PubMed] [Google Scholar]
- 16. Moore, P.E. , Church, T.L. , Chism, D.D. , Panettieri, R.A. Jr & Shore, S.A. IL‐13 and IL‐4 cause eotaxin release in human airway smooth muscle cells: a role for ERK. Am. J. Physiol. Lung Cell Mol. Physiol. 282, L847–L853 (2002). [DOI] [PubMed] [Google Scholar]
- 17. Dubucquoi, S. et al Interleukin 5 synthesis by eosinophils: association with granules and immunoglobulin‐dependent secretion. J. Exp. Med. 179, 703–708 (1994). [DOI] [PMC free article] [PubMed] [Google Scholar]
- 18. Cherry, W.B. , Yoon, J. , Bartemes, K.R. , Iijima, K. & Kita, H. A novel IL‐1 family cytokine, IL‐33, potently activates human eosinophils. J. Allergy Clin. Immunol. 121, 1484–1490 (2008). [DOI] [PMC free article] [PubMed] [Google Scholar]
- 19. Luttmann, W. , Matthiesen, T. , Matthys, H. & Virchow J.C. Jr. Synergistic effects of interleukin‐4 or interleukin‐13 and tumor necrosis factor‐alpha on eosinophil activation in vitro. Am. J. Respir. Cell Mol. Biol. 20, 474–480 (1999). [DOI] [PubMed] [Google Scholar]
- 20. Fujisawa, T. et al Chemokines induce eosinophil degranulation through CCR‐3. J. Allergy Clin. Immunol. 106, 507–513 (2000). [DOI] [PubMed] [Google Scholar]
- 21. Huang, C.D. et al Eosinophils from asthmatics release IL‐5 in an autocrine fashion to prevent apoptosis through upregulation of Bcl‐2 expression. J. Asthma 42, 395–403 (2005). [DOI] [PubMed] [Google Scholar]
- 22. Schmid‐Grendelmeier, P. et al Eosinophils express functional IL‐13 in eosinophilic inflammatory diseases. J. Immunol. 169, 1021–1027 (2002). [DOI] [PubMed] [Google Scholar]
- 23. Farahi, N. et al Effects of the cyclin‐dependent kinase inhibitor R‐roscovitine on eosinophil survival and clearance. Clin. Exp. Allergy 41, 673–687 (2011). [DOI] [PubMed] [Google Scholar]
- 24. Kumagai, N. , Fukuda, K. , Ishimura, Y. & Nishida, T. Synergistic induction of eotaxin expression in human keratocytes by TNF‐alpha and IL‐4 or IL‐13. Invest. Ophthalmol. Vis. Sci. 41, 1448–1453 (2000). [PubMed] [Google Scholar]
- 25. Fregonese, L. , Silvestri, M. , Sabatini, F. & Rossi, G.A. Cysteinyl leukotrienes induce human eosinophil locomotion and adhesion molecule expression via a CysLT1 receptor‐mediated mechanism. Clin. Exp. Allergy 32, 745–750 (2002). [DOI] [PubMed] [Google Scholar]
- 26. Stein, M.L. et al Anti‐IL‐5 (mepolizumab) therapy reduces eosinophil activation ex vivo and increases IL‐5 and IL‐5 receptor levels. J. Allergy Clin. Immunol. 121, 1473–1483 (2008). [DOI] [PMC free article] [PubMed] [Google Scholar]
- 27. Flood‐Page, P.T. , Menzies‐Gow, A.N. , Kay, A.B. & Robinson, D.S. Eosinophil's role remains uncertain as anti‐interleukin‐5 only partially depletes numbers in asthmatic airway. Am. J. Respir. Crit. Care Med. 167, 199–204 (2003). [DOI] [PubMed] [Google Scholar]
- 28. Gizzatkulov, N.M. , Goryanin, I.I. , Metelkin, E.A. , Mogilevskaya, E.A. , Peskov, K.V. & Demin, O.V. DBSolve Optimum: a software package for kinetic modeling which allows dynamic visualization of simulation results. BMC Syst. Biol. 4, 109 (2010). [DOI] [PMC free article] [PubMed] [Google Scholar]
- 29. Grootendorst, D.C. et al Comparison of inflammatory cell counts in asthma: induced sputum vs bronchoalveolar lavage and bronchial biopsies. Clin. Exp. Allergy 27, 769–779 (1997). [PubMed] [Google Scholar]
- 30. Bogic, M. et al Clinical significance of measurement of interleukin 4 and interleukin 5 serum concentrations in bronchial asthma. Jugoslov. Med. Biohem. 23, 51–54 (2004). [Google Scholar]
- 31. Wiesemann, E. , Klatt, J. , Wenzel, C. , Heidenreich, F. & Windhagen, A. Correlation of serum IL‐13 and IL‐5 levels with clinical response to Glatiramer acetate in patients with multiple sclerosis. Clin. Exp. Immunol. 133, 454–460 (2003). [DOI] [PMC free article] [PubMed] [Google Scholar]
- 32. Jahnz‐Róyk, K. , Plusa, T. & Mierzejewska, J. Eotaxin in serum of patients with asthma or chronic obstructive pulmonary disease: relationship with eosinophil cationic protein and lung function. Mediators Inflamm. 9, 175–179 (2000). [DOI] [PMC free article] [PubMed] [Google Scholar]
- 33. Kabata, H. et al Relationship between serum periostin levels and severity/phenotype of asthma. Respir. Crit. Care Med American Thoracic Society International Conference Abstracts. (2013).
- 34. Flood‐Page, P. et al A study to evaluate safety and efficacy of mepolizumab in patients with moderate persistent asthma. Am. J. Respir. Crit. Care Med. 176, 1062–1071 (2007). [DOI] [PubMed] [Google Scholar]
- 35. Büttner, C. , Lun, A. , Splettstoesser, T. , Kunkel, G. & Renz, H. Monoclonal anti‐interleukin‐5 treatment suppresses eosinophil but not T‐cell functions. Eur. Respir. J. 21, 799–803 (2003). [DOI] [PubMed] [Google Scholar]
- 36. Walsh, G.M. Mepolizumab and eosinophil‐mediated disease. Curr. Med. Chem. 16, 4774–4778 (2009). [DOI] [PubMed] [Google Scholar]
- 37. Simon, H.U. , Yousefi, S. , Schranz, C. , Schapowal, A. , Bachert, C. & Blaser, K. Direct demonstration of delayed eosinophil apoptosis as a mechanism causing tissue eosinophilia. J. Immunol. 158, 3902–3908 (1997). [PubMed] [Google Scholar]
- 38. Haldar, P. et al Mepolizumab and exacerbations of refractory eosinophilic asthma. N. Engl. J. Med. 360, 973–984 (2009). [DOI] [PMC free article] [PubMed] [Google Scholar]
- 39. Straumann, A. et al Anti‐interleukin‐5 antibody treatment (mepolizumab) in active eosinophilic oesophagitis: a randomised, placebo‐controlled, double‐blind trial. Gut 59, 21–30 (2010). [DOI] [PubMed] [Google Scholar]
- 40. Laviolette, M. et al Effects of benralizumab on airway eosinophils in asthmatic patients with sputum eosinophilia. J. Allergy Clin. Immunol. 132, 1086–1096 (2013). [DOI] [PMC free article] [PubMed] [Google Scholar]
- 41. Yamaguchi, Y. et al Serum periostin levels are correlated with progressive skin sclerosis in patients with systemic sclerosis. Br. J. Dermatol. 168, 717–725 (2013). [DOI] [PubMed] [Google Scholar]
- 42. Jia, G. et al Periostin is a systemic biomarker of eosinophilic airway inflammation in asthmatic patients. J. Allergy Clin. Immunol. 130, 647–654 (2012). [DOI] [PMC free article] [PubMed] [Google Scholar]
- 43. Bree, A. et al IL‐13 blockade reduces lung inflammation after Ascaris suum challenge in cynomolgus monkeys. J. Allergy Clin. Immunol. 119, 1251–1257 (2007). [DOI] [PubMed] [Google Scholar]
- 44. Brightling, C.E. et al Efficacy and safety of tralokinumab in patients with severe uncontrolled asthma: a randomised, double‐blind, placebo‐controlled, phase 2b trial. Lancet Respir. Med. 3, 692–701 (2015). [DOI] [PubMed] [Google Scholar]
- 45. Ohshima, N. et al A functional study on CysLT(1) receptors in human eosinophils. Int. Arch. Allergy Immunol. 129, 67–75 (2002). [DOI] [PubMed] [Google Scholar]
- 46. Sehmi, R. , Wardlaw, A.J. , Cromwell, O. , Kurihara, K. , Waltmann, P. & Kay, A.B . Interleukin‐5 selectively enhances the chemotactic response of eosinophils obtained from normal but not eosinophilic subjects. Blood 79, 2952–2959 (1992). [PubMed] [Google Scholar]
- 47. Till, S. et al Secretion of the eosinophil‐active cytokines interleukin‐5, granulocyte/macrophage colony‐stimulating factor and interleukin‐3 by bronchoalveolar lavage CD4+ and CD8+ T cell lines in atopic asthmatics, and atopic and non‐atopic controls. Eur. J. Immunol. 25, 2727–2731 (1995). [DOI] [PubMed] [Google Scholar]
- 48. Ochi, H. , De Jesus, N.H. , Hsieh, F.H. , Austen, K.F. & Boyce, J.A. IL‐4 and −5 prime human mast cells for different profiles of IgE‐dependent cytokine production. Proc. Natl. Acad. Sci. USA 97, 10509–10513 (2000). [DOI] [PMC free article] [PubMed] [Google Scholar]
Associated Data
This section collects any data citations, data availability statements, or supplementary materials included in this article.
Supplementary Materials
Supporting Information