Abstract
Purpose
To identify the origin and significance of discordance between blue-light autofluorescence (BL-AF; 488nm) and near-infrared autofluorescence (NI-AF; 787nm) in patients with age-related macular degeneration (AMD).
Methods
A total of 86 eyes of 59 patients with a diagnosis of AMD were included in this cross-sectional study conducted between March 9, 2015 and May 1, 2015. A masked observer examined the BL-AF, NI-AF, and spectral-domain optical coherence tomography (OCT) images. Areas with discordance of autofluorescence patterns between NI-AF and BL-AF images were correlated with structural findings at the corresponding location in OCT scans.
Results
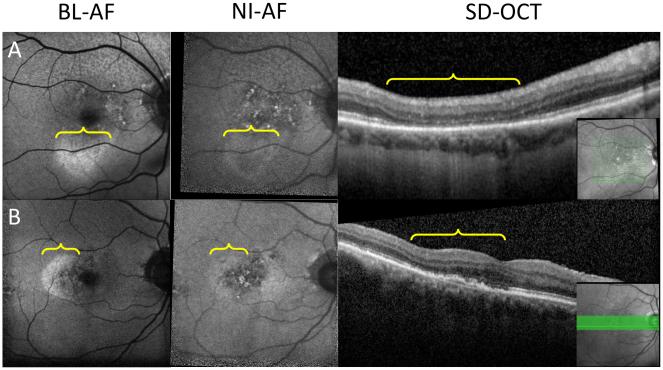
79 eyes had discordance between BL-AF and NI-AF. The most common OCT finding accounting for these discrepancies was pigment migration accounting for 35 lesions in 21 eyes. The most clinically relevant finding was geographic atrophy missed on BL-AF in seven eyes.
Conclusions
Our findings indicate that variations in the distribution of lipofuscin, melanin and melanolipofuscin account for the majority of discordance between BL-AF and NI-AF. Given our finding of missed geographic atrophy lesions on BL-AF in 24% of eyes with geographic atrophy (7/29 eyes), clinicians should consider multimodal imaging, including NI-AF and OCT, especially in clinical trials of geographic atrophy.
Keywords: Age-related macular degeneration, blue-light autofluorescence, near-infrared autofluorescence, spectral-domain optical coherence tomography, geographic atrophy, pigment migration, calcific drusen
Introduction
Age-related macular degeneration (AMD) is a multifactorial disease with both genetic and environmental factors contributing to a slow and progressive loss of central vision. This loss of vision leads to difficulty performing daily tasks, such as reading and driving, which can lead to loss of independence and poor quality of life.1 Despite intense study of this debilitating disease, the exact pathogenesis of the AMD process remains largely unknown.
Advanced retinal imaging technologies have been utilized by researchers to gain a better understanding of AMD pathology. Of those imaging modalities, fundus autofluorescence using blue light (BL-AF) excitation has been increasingly utilized both clinically and as a study end-point in AMD therapeutic clinical trials. This approach uses blue light (488 nm) to excite fluorophores in the retina and images the light emitted by these molecules using specialized filters. Early studies done by Delori et al. demonstrated that the molecules visualized by BL-AF are primarily lipofuscin.2 Lipofuscin is a marker of aging composed of heterogeneous granules containing lipids and proteins.3 N-retinylidene-N-retinylethanolamine (A2E) is a well-characterized component of lipofuscin that was previously thought to be the dominant fluorophore accounting for BL-AF signal changes.4 However, more recent studies put the significance of A2E into question indicating that other related fluorophores may be equally important as lipofuscin.5 The lipofuscin in retinal pigment epithelial (RPE) cells is primarily an oxidized product of photoreceptor outer segment phagocytosis.6 Increased accumulation of lipofuscin has been associated with increasing age as well as AMD.7 This relationship is one of the main arguments for oxidative stress playing a central role in the pathogenesis of AMD.8 With lipofuscin being a biomarker for RPE function, there has been an expanding role of BL-AF in the care of patients with AMD.9
A less frequently used autofluorescence approach is near-infrared autofluorescence (NI-AF) which uses near-infrared light (787 nm) excitation instead of blue light for excitation. The fluorophores visualized by NI-AF are primarily melanin and melanolipofuscin.10 Melanin is a naturally occurring pigment present in many parts of the eye including the uveal melanocytes and RPE cells.11 Melanolipofuscin is a granule containing both melanin and lipofuscin with an autofluorescent signal that is intermediate between the two substances.12 While there are many functions of melanin, the most widely studied is photoprotection.13 Melanin has also been hypothesized to protect the eye from AMD through its antioxidant properties.14 Among these antioxidant properties is the ability of melanin to delay the accumulation of lipofuscin in the retina and choroid.15 Therefore, BL-AF and NI-AF are complementary imaging approaches when used together to study the relationship between lipofuscin and melanin, and their role in the pathogenesis of AMD.
Previous studies have compared the findings on BL-AF and NI-AF in AMD. The first, by Kellner et al., examined the patterns on BL-AF and NI-AF as well as categorized the images based on the relative intensities of these two modalities in patients with all types of AMD.16 Querques et al. correlated BL-AF and NI-AF with microperimetry in patients with non-exudative AMD.17 Pilotto et al. used BL-AF and NI-AF to track progressing geographic atrophy secondary to AMD.18, 19 These studies indicated that there are differences between BL-AF and NI-AF images and suggest that complementary information can be gleaned when these two modalities are used in combination.
While both NI-AF and BL-AF examine autofluorescence from RPE fluorophores, we wanted to explore whether there were AMD lesions that lead to significant signal discordance between the two approaches. Further, none of the previous studies used OCT to examine the structural origins of signature discordance between these technologies. In order to better understand the pathologic significance of these technologies, we designed the present study to identify the prevalence of lesions with signal discordance between the techniques and to explore the structural correlates of these signatures using OCT in patients with AMD.
Methods
Study Design
This was a cross-sectional study designed to evaluate the discrepancy between BL-AF and NI-AF in patients with AMD. An observer (MJH), masked from patient identifiers and diagnosis, identified areas with dissimilar autofluorescence signature on BL-AF and NI-AF, while the second observer (AAF) independently assessed a random subset of images to validate accuracy. In cases of disagreement between the two graders, open adjudication and correlation with relevant findings on fundus photography and infrared reflectance were used to reconcile the disagreement. The structural correlates of all areas of autofluorescence discrepancy were then explored on registered OCT.
Study Sample
We identified a consecutive series of patients with a diagnosis of early, intermediate and late stage AMD between March 2015 and May 2015 at the Department of Ophthalmology of the Northwestern University Feinberg School of Medicine who underwent imaging with NI-AF and BL-AF. This retrospective study protocol was approved by the Institutional Review Board of Northwestern University. This research followed the tenets of the Declaration of Helsinki. Inclusion criteria consisted of patients with a diagnosis of AMD and a complete ophthalmologic examination, including color fundus photos (Topcon Medical Systems Inc., Oakland, NJ, USA), infrared reflectance, BL-AF, NI-AF, and the Spectralis HRA+OCT (Heidelberg Engineering Inc, Dossenheim, Germany). Patients with confounding disease such as retinal disease other than AMD or ocular media opacification were not included in the study.
Image Acquisition
Color fundus photographs were obtained using a Topcon retinal camera (Topcon Medical Systems Inc., Oakland, NJ, USA). Infrared reflectance, BL-AF and NI-AF 30×30 degree images centered on the macula were obtained using the Heidelberg Spectralis HRA + OCT confocal scanning laser ophthalmoscope and the SD-OCT device (Heidelberg Engineering Inc.). For BL-AF images, blue laser light at 488 nm was used for excitation and an emission filter at 500 nm was used to limit captured light to autofluorescent structures, these images were averaged 16 times. For NI-AF images, near-infrared laser light at 787 nm was used for excitation and an emission filter at 800 nm was used to limit captured light to autofluorescent structures, using an average of 100 images. Spectralis SD-OCT images centered on the fovea were obtained using two protocols: a larger volume cube of 25 × 30 degrees, 22 lines (average × 16) and smaller cube 30 × 5 degrees, 49 lines, 30 microns apart (average × 9).
Image Analysis and Lesion Definitions
A masked investigator (MJH) used the manual registration feature of TurboReg,20 a plugin for ImageJ software (NIH, Bethesda, MD), to register the BL-AF and NI-AF images from the same eye. Hypo- and hyper-autofluorescent lesions were noted on each BL-AF image as well as the autofluorescence (hypo-, hyper-, or iso-autofluorescence, all relative to the mean autofluorescence of the image) of the same area on the NI-AF image from the same eye. An autofluorescence “lesion” was defined as well demarcated area of hypo- or hyper-autofluorescence of at least 25 microns in size.
We used the OCT as “ground truth” to define geographic atrophy as well demarcated areas of RPE loss, visualized on OCT with underlying choroidal illumination and increased signal transmission into the choroid. On OCT, calcific drusen were defined as drusenoid lesions with intense hyper-reflective appearance on OCT. For further confirmation, these lesions were also verified on fundus photographs as well-defined brightly reflective and refractile yellow as well as brightly hyper-reflective focal lesions on infrared reflectance. All lesions with discrepancies between BL-AF and NI-AF fluorescence were scrutinized on OCT and the relevant abnormalities were noted.
Results
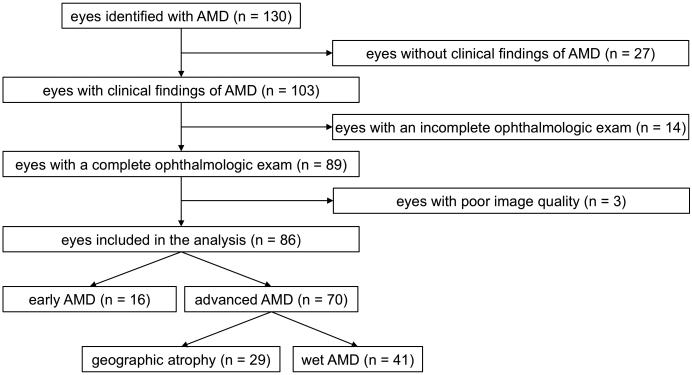
Fifty-nine patients with AMD underwent NI-AF and BL-AF at Northwestern University between March 2015 to May 2015. Of these patients, 27 had one eye without clinical findings of AMD and were excluded. Of the remaining 103 eyes with findings of AMD, 14 eyes had incomplete ophthalmologic exams, and/or were missing BL-AF, NI-AF or OCT images at the time of analysis. Three eyes had BL-AF or NI-AF images that were of insufficient quality. The remaining 86 eyes of 59 patients had good quality imaging and were included in the present study. Of the 86 eyes, 70 had advanced AMD: 29 eyes with geographic atrophy and 41 with wet AMD, the remaining 16 eyes had early AMD (Figure 1).
Figure 1.
Flowchart showing study cohort selection.
AMD: age-related macular degeneration
Discrepancies between BL-AF and NI-AF
Overall, 79/86 eyes had some degree of difference between BL-AF and NI-AF images leaving seven eyes without any difference. Most eyes had a variety of discrepancies between the two imaging modalities, and were classified based on the discrepancy with the largest surface area. For the entire dataset, the most common discrepancy was normal BL-AF and hyper NI-AF, which was the largest discrepancy (by area) in 26 eyes. The second most common was hyper BL-AF and normal NI-AF, which was the largest discrepancy in 25 eyes. Hypo BL-AF and normal NI-AF was seen in 11 eyes, while hypo BL-AF and hyper NI-AF was prominent in seven eyes. All the AF discrepancies were analyzed on the registered OCT and the findings are presented below, grouped according to the OCT lesion patterns in these eyes (Figure 2). Findings included normal BL-AF and hypo NI-AF in cases of missed geographic atrophy, normal BL-AF and hyper NI-AF in both pigment migration and calcific drusen, hyper BL-AF and normal NI-AF in photoreceptor loss with intact RPE and heterogenous discrepancies in SHRM.
Figure 2.
Distribution of samples based on discrepancy.
Samples grouped based on largest surface area of autofluorescent discrepancy on BL-AF compared to NI-AF.
Missed geographic atrophy on BL-AF (n=7)
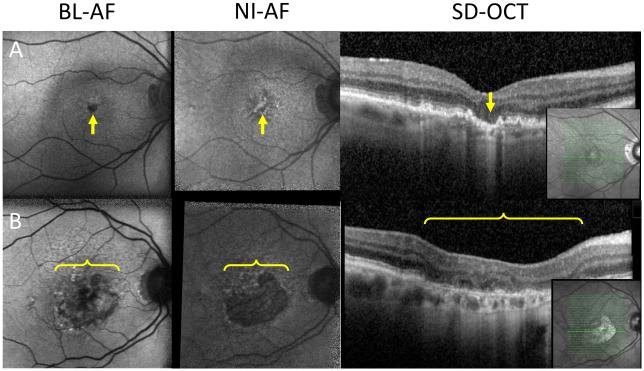
Geographic atrophy was primarily seen as well-demarcated homogenous hypo-autofluorescence on both BL-AF and NI-AF as previously described.21, 22 Hypo NI-AF limited to the fovea in three eyes was not detected on BL-AF because of the normally hypo-autofluorescent fovea on BL-AF images (Figure 3A).23 The hypo NI-AF in these three eyes was verified to be geographic atrophy on OCT. The other four eyes had hypo NI-AF in the face of heterogeneous BL-AF (containing heterogenous iso- and hypo BL-AF). These heterogeneous areas were confirmed to be geographic atrophy on OCT (Figure 3B and 5B) in 7/29 (24%) of eyes with geographic atrophy in this study. Given that geographic atrophy usually appears as a homogenous hypo-autofluorescent lesion, these heterogeneous areas have the potential to be missed on BL-AF, if such lesions are not verified on NI-AF or OCT.
Figure 3.
Geographic atrophy missed on BL-AF.
A: Left column: geographic atrophy isolated to the fovea (arrow), which normally appears as hypo BL-AF in healthy patients. Middle column: geographic atrophy visualized on NI-AF as a hypo NI-AF lesion (arrow). Right column: OCT showing area of increased signal backscattering into the choroid indicating the absence of RPE and the presence of geographic atrophy (arrow). B: Left column: heterogeneous area of hypo BL-AF and normal BL-AF (bracket). Middle column: homogenous well demarcated area of hypo NI-AF indicating geographic atrophy (bracket). Right column: OCT indicating the presence of geographic atrophy (bracket). Inset: location of OCT section.
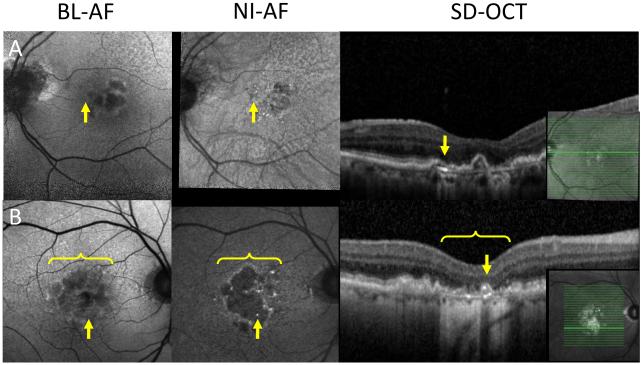
Figure 5.
Calcific drusen on autofluorescence.
A&B: Two subjects with hyper-NIA lesions (middle column, arrow) that do not appear on FAF (left column, arrow). These normal FAF hyper-NIA lesions appear as calcific drusen on SD-OCT (right column, arrow). Panel B also shows a heterogeneous area of hypo BL-AF and normal BL-AF (left column, bracket) with a homogenous well demarcated area of hypo NI-AF indicating geographic atrophy (middle column, bracket) confirmed on OCT (right column, bracket) Inset: location of OCT slab. Inset: location of SD-OCT slab.
Pigment migration (n=35) and calcific drusen (n=6)
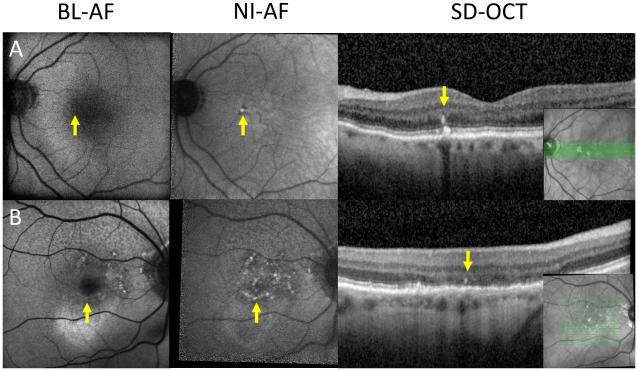
Pigment migration on OCT was associated with different autofluorescent signatures on BL-AF and NI-AF in 35 lesions of 21 eyes. The most common signature was normal BL-AF and hyper NI-AF seen in 25 lesions (Figure 4). Pigment migration appeared as hypo BL-AF and hyper NI-AF in ten lesions. Calcific drusen on OCT had different appearances on BL-AF and NI-AF in six lesions of five eyes. The most common discrepancy associated with calcific drusen was normal BL-AF and hyper NI-AF seen in five lesions (Figure 5). There was one lesion found to be calcific drusen appearing as hypo BL-AF and hyper NI-AF.
Figure 4.
Pigment migration on autofluorescence.
A&B: Two subjects with hyper NI-AF lesions (middle column, arrow) that do not appear on BL-AF (left column, arrow). These normal BL-AF hyper NI-AF lesions appear as pigment migration on OCT (right column, arrow).
Photoreceptor loss with intact RPE (n=16)
Loss of the photoreceptor layer with intact RPE on OCT caused different signatures on BL-AF and NI-AF in 16 eyes. In 14 eyes, these lesions appeared as hyper BL-AF, with ten of those having normal NI-AF and the other four having hypo NI-AF. Two similar lesions on OCT had normal BL-AF and hyper NI-AF (Figure 6).
Figure 6.
Photoreceptor loss with intact RPE.
A&B: Two subjects with hyper BL-AF (left column, bracket) that do not appear on NI-AF (middle column, bracket). These hyper BL-AF normal NI-AF areas have photoreceptor loss with intact RPE on OCT (bracket). Inset: location of OCT slab.
Subretinal hyper-reflective material (SHRM; n=16)
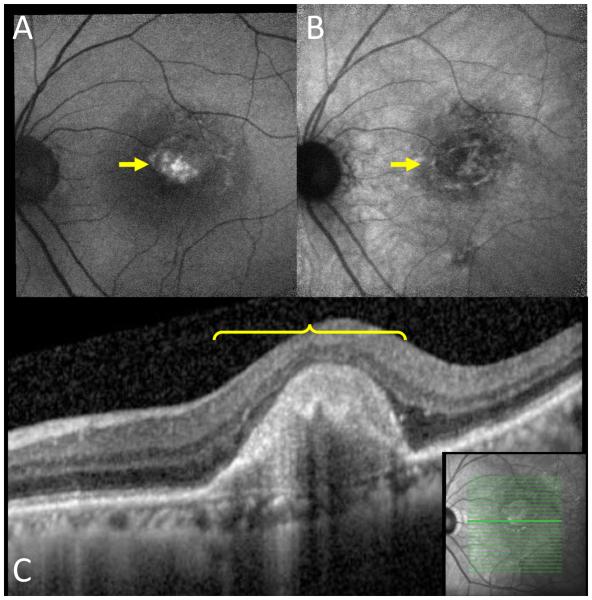
SHRM was visualized on OCT in areas with discrepancies between BL-AF and NI-AF in 16 eyes. Four lesions appeared as hyper BL-AF with three of those having normal NI-AF and the other having hypo NI-AF (Figure 7). Eleven SHRM lesions had normal BL-AF and hyper NI-AF while the remaining lesion had hypo BL-AF and hyper NI-AF.
Figure 7.
Subretinal hyper-reflective material.
A: Hyper BL-AF area (arrow). B: The same area on NI-AF with normal autofluorescence (arrow). C: This hyper BL-AF normal NI-AF area appears as subretinal hyper-reflective material on OCT (bracket). Inset: location of OCT slab.
Discussion
In the present study, a comparison of BL-AF and NI-AF images in patients diagnosed with AMD revealed a high proportion (92%) of eyes with some discordance between these two imaging modalities. Point-by-point evaluation of OCT structural changes associated with these discrepancies demonstrated general groupings of the causative lesions, related to pigment migration, calcific drusen, photoreceptor loss with intact RPE, SHRM and missed geographic atrophy.
Pigment migration appeared as hyper NI-AF, which is expected since NI-AF visualizes melanin, but was either missed or appeared as a hypo-autofluorescent lesion on BL-AF (Figure 4). These discrepancies suggest that there may be a range of underlying RPE changes in areas of pigment migration that can be detected on BL-AF, including RPE atrophy (hypo BL-AF), or relatively intact RPE (iso- BL-AF). Calcific drusen similarly explained multiple hyper-autofluorescent lesions on NI-AF that were missed or appeared hypo-autofluorescent on BL-AF (Figure 5). Previous studies have described the varied BL-AF findings of calcific drusen including hypo BL-AF that extends beyond the area of the calcific drusen and hyper BL-AF when located in the perifovea.24 Our findings of calcific drusen appearing as hyper NI-AF may be explained by localized pigment changes or the aggregation of RPE cells underlying the calcific drusen. Alternatively, inflammatory changes near the calcific drusen may lead to release of reactive oxygen species and oxidation of melanin, with secondary photoactivation of existing melanin.25
Loss of photoreceptors on OCT with intact underlying RPE appeared as hyper BL-AF with normal or hypo-autofluorescence on NI-AF (Figure 6). One possible explanation is the loss of photoreceptor outer segments leading to loss of photoreceptor pigment that normally filters the BL-AF excitation blue light. Loss of photoreceptor pigments would then lead to hyper BL-AF compared to adjacent areas of the retina with intact photoreceptors.26 Alternatively, the degenerating photoreceptors that remain in these areas may produce increase amounts of lipofuscin and debris that would appear as hyper BL-AF.27 However, since the photoreceptor loss (mainly absent outer segments and IZ) could be visualized on OCT in the majority of these lesions, our findings favor the former explanation (Figure 6).
Another OCT finding in areas with hyper BL-AF and normal NI-AF was SHRM, which had the greatest variability in appearance on BL-AF and NI-AF (Figure 7). The variability seen on autofluorescence is consistent with the hypothesized heterogeneity of this OCT finding.28 SHRM is an OCT characteristic that denotes hyper-reflective material visualized in the subretinal space.29 SHRM is a negative prognostic biomarker in AMD and has been used as an endpoint for clinical trials.30 The potential source of material contributing to SHRM includes fibrovascular scars, blood, exudate, cholesterol, and other AMD components including undigested outer segment debris.31-34 Differences in appearance of this material on BL-AF and NI-AF may represent variations in pigmentary changes and lipofuscin content. In the present study, SHRM was the finding with the greatest variability in appearance on BL-AF and NI-AF. This likely represents the variety of components that make up SHRM and the relative contribution of these lesions to autofluorescence.
Geographic atrophy confirmed on OCT and missed on BL-AF was the most clinically relevant discrepancy that we encountered in 7 of 29 eyes (24%) with geographic atrophy. Some cases of geographic atrophy were well identified on NI-AF, but had a heterogeneous appearance on BL-AF (Figure 3B and 5B). Another cause of geographic atrophy missed on BL-AF were lesions located in the fovea where BL-AF images are naturally hypo-autofluorescent due to absorption of the blue excitation light by the macular xanthophyll pigments.35 This is in line with findings by Pillotto et al., who found that areas of geographic atrophy adjacent to the fovea are estimated to be larger on BL-AF compared to NI-AF given the similarity between the appearance of geographic atrophy and the healthy fovea on BL-AF.18 Conversely, the fovea on NI-AF appears brighter than the parafoveal region due to the higher content of melanin in this region and the lack of near-infrared light filtering by xanthophylls.10, 36 The brighter fovea on NI-AF provides greater contrast for geographic atrophy in the fovea and therefore more accurate measurement of its surface area.22 These findings have important clinical implications, especially in geographic atrophy research and diagnosis, particularly when clinicians use BL-AF as the only modality to identify and follow geographic atrophy.37
In geographic atrophy, other studies have similarly reported that NI-AF has the potential to detect these changes earlier than BL-AF. For example, Pilotto et al. found areas of hypo NI-AF that appeared normal on BL-AF in patients with geographic atrophy.18 They went on to quantify the area of geographic atrophy using NI-AF instead of BL-AF and compared these areas to changes on microperimetry. Geographic atrophy boundaries that were hyper NI-AF were found to more accurately correlate with functionally compromised microperimetry when compared to BL-AF. These authors speculated that hyper NI-AF indicates melanogenesis and melanolipofuscin formation, which may correlate with increased photoreceptor degeneration.
While ours is the first study to correlate the structural OCT findings to better understand discordance between BL-AF and NI-AF, other groups have previously explored BL-AF and NI-AF findings in AMD as well as in other retinal diseases.16-19, 36, 38-40 Kellner et al. studied patients with AMD, geographic atrophy, and neovascular AMD using fluorescein angiography, BL-AF, and NI-AF.16 They found that RPE lesions were detected in both BL-AF and NI-AF and the size of the lesions were similar in a majority (81.8%) of patients. The most common discrepancy they found was hyper BL-AF with hypo NI-AF, while in our study the most common finding was hyper BL-AF with normal NI-AF.
Limitations
Our study has important limitations. We did not quantify the intensity of BL-AF and NI-AF signal changes. While this technique has the potential to more accurately describe and compare lesions of interest, the current imaging process precludes accurate quantitative measurements that can be used for inter-subject comparison. Signal transmission through varying media opacities as well as subtle changes in camera positioning between individuals can lead to differences in quantitative autofluorescent measurements.41 Therefore, BL-AF and NI-AF are best at examining lesions within individual images, but pose a challenge when comparing two image sets from different eyes.42 One potential solution to this limitation is quantitative autofluorescence.43 Quantitative autofluorescence uses a standard fluorescence source and normalizes the experimental image to that standard. This technique can obtain reproducible measurements by compensating for factors that vary between eyes and sessions, but remains a subject of research.44 However, to the best of our knowledge, quantitative autofluorescence is only available for BL-AF. Another limitation arises from the exclusion of patients based on image quality, which introduces potential selection bias. However, the improved lesion identification with a minimum image quality standard outweighs this potential for bias. Finally, lesions that fell in between OCT scans or outside the scanned region were not evaluated in this study. The inability to visualize all lesions on OCT further contributes to potential selection bias. However, we used two protocols to minimize this bias with a larger volume cube of 22 B-scans over 25 × 30 degrees, and a smaller cube with 49 B-scans (30 microns apart) covering 30 × 5 degrees, focused on the central fovea.
Conclusions
In the present study, we demonstrate a variety of lesions on structural OCT that explained discordance between BL-AF and NI-AF in AMD. Other groups have previously described the discordance between BL-AF and NI-AF findings in AMD.16-19 However, ours is the first study to correlate the structural OCT findings to better understand this discordance. The most clinically relevant finding was geographic atrophy that was missed on BL-AF in 24% of eyes with geographic atrophy, which has the potential to influence clinical trials and clinical decisions that are based on BL-AF without NI-AF. Based on this evidence, we believe that BL-AF and NI-AF imaging provide important and complementary information in the diagnosis and management of AMD, and should be used in combination, in addition to OCT, especially when evaluating for geographic atrophy.
Brief summary statement.
Lesions causing discordance between blue-light autofluorescence and near-infrared autofluorescence in age-related macular degeneration include pigment migration, calcific drusen, photoreceptor loss with intact retinal pigment epithelium and missed geographic atrophy.
Acknowledgments
Funding: This work was funded by Research to Prevent Blindness, NY (Department of Ophthalmology, Northwestern University) and R01EY021470 (AAF). The sponsor or funding organizations had no role in the design or conduct of this research.
Footnotes
Proprietary interest: The authors have declared that they have no proprietary interest in the subject of this manuscript.
Work Cited
- 1.Coleman AL, et al. Impact of age-related macular degeneration on vision-specific quality of life: Follow-up from the 10-year and 15-year visits of the Study of Osteoporotic Fractures. Am J Ophthalmol. 2010;150:683–691. doi: 10.1016/j.ajo.2010.05.030. [DOI] [PMC free article] [PubMed] [Google Scholar]
- 2.Delori FC, et al. In vivo fluorescence of the ocular fundus exhibits retinal pigment epithelium lipofuscin characteristics. Invest Ophthalmol Vis Sci. 1995;36:718–729. [PubMed] [Google Scholar]
- 3.Brunk UT, Terman A. Lipofuscin: mechanisms of age-related accumulation and influence on cell function. Free Radic Biol Med. 2002;33:611–619. doi: 10.1016/s0891-5849(02)00959-0. [DOI] [PubMed] [Google Scholar]
- 4.Delori FC, Goger DG, Dorey CK. Age-related accumulation and spatial distribution of lipofuscin in RPE of normal subjects. Invest Ophthalmol Vis Sci. 2001;42:1855–1866. [PubMed] [Google Scholar]
- 5.Ablonczy Z, et al. Lack of correlation between the spatial distribution of A2E and lipofuscin fluorescence in the human retinal pigment epithelium. Invest Ophthalmol Vis Sci. 2013;54:5535–5542. doi: 10.1167/iovs.13-12250. [DOI] [PMC free article] [PubMed] [Google Scholar]
- 6.Kennedy CJ, Rakoczy PE, Constable IJ. Lipofuscin of the retinal pigment epithelium: a review. Eye (Lond) 1995;9:763–771. doi: 10.1038/eye.1995.192. ( Pt 6) [DOI] [PubMed] [Google Scholar]
- 7.Dorey CK, et al. Cell loss in the aging retina. Relationship to lipofuscin accumulation and macular degeneration. Invest Ophthalmol Vis Sci. 1989;30:1691–1699. [PubMed] [Google Scholar]
- 8.Beatty S, et al. The role of oxidative stress in the pathogenesis of age-related macular degeneration. Surv Ophthalmol. 2000;45:115–134. doi: 10.1016/s0039-6257(00)00140-5. [DOI] [PubMed] [Google Scholar]
- 9.Schmitz-Valckenberg S, et al. Fundus autofluorescence and progression of age-related macular degeneration. Surv Ophthalmol. 2009;54:96–117. doi: 10.1016/j.survophthal.2008.10.004. [DOI] [PubMed] [Google Scholar]
- 10.Keilhauer CN, Delori FC. Near-infrared autofluorescence imaging of the fundus: visualization of ocular melanin. Invest Ophthalmol Vis Sci. 2006;47:3556–3564. doi: 10.1167/iovs.06-0122. [DOI] [PubMed] [Google Scholar]
- 11.Sarna T. Properties and function of the ocular melanin--a photobiophysical view. J Photochem Photobiol B. 1992;12:215–258. doi: 10.1016/1011-1344(92)85027-r. [DOI] [PubMed] [Google Scholar]
- 12.Feeney L. Lipofuscin and melanin of human retinal pigment epithelium. Fluorescence, enzyme cytochemical, and ultrastructural studies. Invest Ophthalmol Vis Sci. 1978;17:583–600. [PubMed] [Google Scholar]
- 13.Hu DN, Simon JD, Sarna T. Role of ocular melanin in ophthalmic physiology and pathology. Photochem Photobiol. 2008;84:639–644. doi: 10.1111/j.1751-1097.2008.00316.x. [DOI] [PubMed] [Google Scholar]
- 14.Sarna T, et al. Loss of melanin from human RPE with aging: possible role of melanin photooxidation. Exp Eye Res. 2003;76:89–98. doi: 10.1016/s0014-4835(02)00247-6. [DOI] [PubMed] [Google Scholar]
- 15.Weiter JJ, et al. Retinal pigment epithelial lipofuscin and melanin and choroidal melanin in human eyes. Invest Ophthalmol Vis Sci. 1986;27:145–152. [PubMed] [Google Scholar]
- 16.Kellner U, Kellner S, Weinitz S. Fundus autofluorescence (488 NM) and near-infrared autofluorescence (787 NM) visualize different retinal pigment epithelium alterations in patients with age-related macular degeneration. Retina. 2010;30:6–15. doi: 10.1097/iae.0b013e3181b8348b. [DOI] [PubMed] [Google Scholar]
- 17.Querques L, et al. Microperimetric correlations of autofluorescence and optical coherence tomography imaging in dry age-related macular degeneration. Am J Ophthalmol. 2012;153:1110–1115. doi: 10.1016/j.ajo.2011.11.002. [DOI] [PubMed] [Google Scholar]
- 18.Pilotto E, et al. Short wavelength fundus autofluorescence versus near-infrared fundus autofluorescence, with microperimetric correspondence, in patients with geographic atrophy due to age-related macular degeneration. Br J Ophthalmol. 2011;95:1140–1144. doi: 10.1136/bjo.2010.187344. [DOI] [PubMed] [Google Scholar]
- 19.Pilotto E, et al. Fundus autofluorescence and microperimetry in progressing geographic atrophy secondary to age-related macular degeneration. Br J Ophthalmol. 2013;97:622–626. doi: 10.1136/bjophthalmol-2012-302633. [DOI] [PubMed] [Google Scholar]
- 20.Thevenaz P, Ruttimann UE, Unser M. A pyramid approach to subpixel registration based on intensity. IEEE Trans Image Process. 1998;7:27–41. doi: 10.1109/83.650848. [DOI] [PubMed] [Google Scholar]
- 21.Holz FG, et al. Fundus autofluorescence and development of geographic atrophy in age-related macular degeneration. Invest Ophthalmol Vis Sci. 2001;42:1051–1056. [PubMed] [Google Scholar]
- 22.Chen FK, Khoo YJ, Tang I. Near-Infrared Autofluorescence Imaging in Geographic Atrophy Using Spectralis Single and Combined Wavelength Modes. Asia Pac J Ophthalmol (Phila) 2015 doi: 10.1097/APO.0000000000000142. [DOI] [PubMed] [Google Scholar]
- 23.Sepah YJ, et al. Fundus autofluorescence imaging: Fundamentals and clinical relevance. Saudi J Ophthalmol. 2014;28:111–116. doi: 10.1016/j.sjopt.2014.03.008. [DOI] [PMC free article] [PubMed] [Google Scholar]
- 24.Suzuki M, et al. REFRACTILE DRUSEN: Clinical Imaging and Candidate Histology. Retina. 2015;35:859–865. doi: 10.1097/IAE.0000000000000503. [DOI] [PubMed] [Google Scholar]
- 25.Kayatz P, et al. Oxidation causes melanin fluorescence. Invest Ophthalmol Vis Sci. 2001;42:241–246. [PubMed] [Google Scholar]
- 26.Freund KB, et al. Increased fundus autofluorescence related to outer retinal disruption. JAMA Ophthalmol. 2013;131:1645–1649. doi: 10.1001/jamaophthalmol.2013.5030. [DOI] [PubMed] [Google Scholar]
- 27.Sparrow JR, et al. Interpretations of fundus autofluorescence from studies of the bisretinoids of the retina. Invest Ophthalmol Vis Sci. 2010;51:4351–4357. doi: 10.1167/iovs.10-5852. [DOI] [PMC free article] [PubMed] [Google Scholar]
- 28.Keane PA, et al. Evaluation of age-related macular degeneration with optical coherence tomography. Surv Ophthalmol. 2012;57:389–414. doi: 10.1016/j.survophthal.2012.01.006. [DOI] [PubMed] [Google Scholar]
- 29.Joeres S, et al. Reproducibility of quantitative optical coherence tomography subanalysis in neovascular age-related macular degeneration. Invest Ophthalmol Vis Sci. 2007;48:4300–4307. doi: 10.1167/iovs.07-0179. [DOI] [PubMed] [Google Scholar]
- 30.Willoughby AS, et al. Subretinal Hyperreflective Material in the Comparison of Age-Related Macular Degeneration Treatments Trials. Ophthalmology. 2015;122:1846–1853. doi: 10.1016/j.ophtha.2015.05.042. e1845. [DOI] [PMC free article] [PubMed] [Google Scholar]
- 31.Shah VP, et al. Subretinal hyperreflective exudation associated with neovascular age-related macular degeneration. Retina. 2014;34:1281–1288. doi: 10.1097/IAE.0000000000000166. [DOI] [PubMed] [Google Scholar]
- 32.Sarks JP, Sarks SH, Killingsworth MC. Evolution of geographic atrophy of the retinal pigment epithelium. Eye (Lond) 1988;2:552–577. doi: 10.1038/eye.1988.106. ( Pt 5) [DOI] [PubMed] [Google Scholar]
- 33.Mukkamala SK, et al. Optical coherence tomographic imaging of sub-retinal pigment epithelium lipid. Arch Ophthalmol. 2012;130:1547–1553. doi: 10.1001/archophthalmol.2012.2491. [DOI] [PubMed] [Google Scholar]
- 34.Pang CE, et al. The Onion Sign in Neovascular Age-Related Macular Degeneration Represents Cholesterol Crystals. Ophthalmology. 2015 doi: 10.1016/j.ophtha.2015.07.008. [DOI] [PMC free article] [PubMed] [Google Scholar]
- 35.Wolf-Schnurrbusch UE, et al. Blue-light versus green-light autofluorescence: lesion size of areas of geographic atrophy. Invest Ophthalmol Vis Sci. 2011;52:9497–9502. doi: 10.1167/iovs.11-8346. [DOI] [PubMed] [Google Scholar]
- 36.Weinberger AW, et al. Fundus near infrared fluorescence correlates with fundus near infrared reflectance. Invest Ophthalmol Vis Sci. 2006;47:3098–3108. doi: 10.1167/iovs.05-1104. [DOI] [PubMed] [Google Scholar]
- 37.Lujan BJ, et al. Spectral domain optical coherence tomographic imaging of geographic atrophy. Ophthalmic Surg Lasers Imaging. 2009;40:96–101. doi: 10.3928/15428877-20090301-16. [DOI] [PubMed] [Google Scholar]
- 38.Kellner S, et al. Lipofuscin- and melanin-related fundus autofluorescence in patients with ABCA4-associated retinal dystrophies. Am J Ophthalmol. 2009;147:895–902. doi: 10.1016/j.ajo.2008.12.023. 902 e891. [DOI] [PubMed] [Google Scholar]
- 39.Ueda-Arakawa N, et al. Sensitivity and specificity of detecting reticular pseudodrusen in multimodal imaging in Japanese patients. Retina. 2013;33:490–497. doi: 10.1097/IAE.0b013e318276e0ae. [DOI] [PubMed] [Google Scholar]
- 40.Sparrow JR, et al. Flecks in Recessive Stargardt Disease: Short-Wavelength Autofluorescence, Near-Infrared Autofluorescence, and Optical Coherence Tomography. Invest Ophthalmol Vis Sci. 2015;56:5029–5039. doi: 10.1167/iovs.15-16763. [DOI] [PMC free article] [PubMed] [Google Scholar]
- 41.Bellmann C, et al. Fundus autofluorescence imaging compared with different confocal scanning laser ophthalmoscopes. Br J Ophthalmol. 2003;87:1381–1386. doi: 10.1136/bjo.87.11.1381. [DOI] [PMC free article] [PubMed] [Google Scholar]
- 42.Cideciyan AV, Swider M, Jacobson SG. Autofluorescence imaging with near-infrared excitation:normalization by reflectance to reduce signal from choroidal fluorophores. Invest Ophthalmol Vis Sci. 2015;56:3393–3406. doi: 10.1167/iovs.15-16726. [DOI] [PMC free article] [PubMed] [Google Scholar]
- 43.Delori F, et al. Quantitative measurements of autofluorescence with the scanning laser ophthalmoscope. Invest Ophthalmol Vis Sci. 2011;52:9379–9390. doi: 10.1167/iovs.11-8319. [DOI] [PMC free article] [PubMed] [Google Scholar]
- 44.Greenberg JP, et al. Quantitative fundus autofluorescence in healthy eyes. Invest Ophthalmol Vis Sci. 2013;54:5684–5693. doi: 10.1167/iovs.13-12445. [DOI] [PMC free article] [PubMed] [Google Scholar]


