

Structured Abstract
PURPOSE
To develop a robust, sensitive, and fully automatic algorithm to quantify diabetes related capillary dropout using optical coherence tomography (OCT) angiography (OCTA).
METHODS
A 1050 nm wavelength, 400 kHz A-scan rate swept-source OCT prototype was used to perform volumetric OCTA imaging over 3 mm × 3 mm fields in normal controls (n = 5), patients with diabetes without diabetic retinopathy (DR) (n = 7), patients with non-proliferative diabetic retinopathy (NPDR) (n = 9), and patients with proliferative diabetic retinopathy (PDR) (n = 5); for each patient, one eye was imaged. A fully automatic algorithm to quantify intercapillary areas was developed.
RESULTS
Of the 26 evaluated eyes, the segmentation was successful in 22 eyes (85%). The mean values of the 10 and 20 largest intercapillary areas, either including or excluding the foveal avascular zone, showed a consistent trend of increasing size from normal control eyes, to eyes with diabetic retinopathy but without DR, to NPDR eyes, and finally, to PDR eyes.
CONCLUSIONS
OCTA based screening and monitoring of DR patients is critically dependent on automated vessel analysis. The presented algorithm was able to automatically extract an intercapillary area based metric in patients having various stages of DR. Intercapillary area based approaches are likely more sensitive to early stage capillary dropout than vascular density based methods.
Keywords: Diabetic retinopathy (DR), intercapillary area, capillary dropout, optical coherence tomography (OCT), optical coherence tomography angiography (OCTA)
Introduction
Diabetic retinopathy (DR), a complication of diabetes mellitus (DM), is a leading cause of blindness worldwide. Non-proliferative diabetic retinopathy (NPDR), which is the earlier disease stage, is characterized by multiple vascular abnormalities, including the formation of microaneurysms, vessel dilation and tortuosity, foveal avascular zone (FAZ) enlargement, and capillary dropout.1–3 Proliferative diabetic retinopathy (PDR), which is a more advanced form of the disease, is characterized by retinal and/or optic nerve neovascularization.4 Since early stage DR is usually asymptomatic, and since DR prevention and treatment options are most effective at preventing vision loss, rather than restoring it, there is an acute need for early disease detection and monitoring. Because sequelae of DR are due to microvascular pathology, imaging methods capable of visualizing the ocular vasculature are likely the most effective techniques for detecting the early changes that occur in DR. Unfortunately, due to their invasiveness, cost, and dependence on skilled photographers and interpreters, dye-based methods such as fluorescein angiography (FA) and indocyanine green angiography (ICGA), which are the standard clinical techniques for visualizing the retinal vasculatures, are not routinely performed in patients with early stage DR.
Optical coherence tomography (OCT) has been an important tool for imaging the retinal structural alterations caused by DR; however, standard cross-sectional OCT is limited in that it provides poor visualization of vasculature. Optical coherence tomography angiography (OCTA), an extension of OCT, is a recently pioneered technique that uses the motion-contrast generated by flowing erythrocytes to enable dye-free, non-invasive, and volumetric visualization of the retinal vasculature at micron-scale resolutions. OCTA works on the basis of a repeated B-scan acquisition whereby multiple OCT B-scans are acquired in rapid succession at each location on the retina. The underlying principle of OCTA is that repeated OCT B-scans of static tissue will be identical, but repeated OCT B-scans of tissues containing flowing erythrocytes will exhibit a time varying intensity. Through a series of signal processing steps, OCTA extracts this intensity variation to form volumetric maps of the retinal vasculature.
The ability of OCTA to non-invasively visualize retinal vasculature makes it an ideal modality for disease detection and monitoring of DM and DR patients. OCTA analysis of retinal capillary dropout is amongst the more promising potential markers of early stage DR and, consequentially, has been examined in several prior studies. Ishibazawa et al.3 used OCTA to investigate the non-perfused areas in the superficial and deep plexuses in DR subjects. Their analysis involved manually tracing the border around areas where no, or few, abnormal capillaries were present, and revealed a difference between the extents of non-perfused areas in these plexuses. In another study, Jia et al.5 used an automatic threshold-based approach to identify areas of macular ischemia in DR and quantify them by measuring the total non-perfused area. Later, Hwang et al.6 employed the same approach to show that the total non-perfused area is significantly higher in DR subjects compared to a control cohort. Moreover they computed the vessel density, also based on thresholding, and demonstrated a decreased vessel density in the parafoveal and perifoveal regions in the DR group. In another vessel density based approach, Agemy et al.7 evaluated skeletonized OCTA images to generate a retinal vascular perfusion density map for different retinal layers and showed that for progressing DR status the capillary perfusion density values decrease for most layers. Finally, a recent study by Salz et al.8, showed that the perifoveal intercapillary area increased, on average, from normal controls, to DM patients without DR, to NPDR patients, and, finally, to PDR patients.
When evaluated as tools for early detection and monitoring of DM and DR, each of the previously mentioned techniques has significant limitations. The methods by Ishibazawa et al. and Salz et al. require manual segmentation, which is time intensive, significantly reducing their clinical utility. The method used in Jia et al., and Hwang et al., was based on thresholding, which has significant drawbacks when applied to images with low signal-to-noise ratios, or intra-image variation of signal strength—both of which are characteristic of OCTA images. In particular, as the signal and noise level become closer, choosing a thresholding value that separates the signal from the noise becomes increasingly prone to error. Finally, the approach by Agemy et al., while automatic and more robust than simple thresholding analysis, is a vessel density based approach and therefore is fundamentally less sensitive to capillary dropout than intercapillary area based methods; this point is further detailed in the Discussion. Noting these limitations, the aim of this study is to improve upon the previously published approaches and develop an automatic, robust, and highly sensitive algorithm for quantifying intercapillary dropout in DM and DR patients.
Methods
Patient Selection
This study protocol was approved by the Institutional Review Boards at the Massachusetts Institute of Technology (MIT) and Tufts Medical Center. All participants were imaged in the ophthalmology clinic at the New England Eye Center (NEEC), and written informed consent was obtained prior to imaging. The research adhered to the Declaration of Helsinki and the Health Insurance Portability and Accountability Act. All subjects underwent a complete ophthalmic examination including a detailed history, refraction, intraocular pressure measurement, anterior segment examination and a dilated fundus examination by an ophthalmologist at the NEEC. Diabetic patients received color fundus photography and FA, as clinically indicated. Normal (control) subjects were defined as having a normal ophthalmic examination except for age-appropriate cataracts, normal visual fields, refraction less than or equal to 6D, and no history of diabetes. Patients with Type 1 or Type 2 diabetes without any retinopathy documented on a detailed dilated ophthalmic exam by a retinal specialist were classified as diabetic patients without retinopathy. Diabetic patients with retinopathy were classified, based on the Early Treatment of Diabetic Retinopathy Study (ETDRS), as having NPDR or PDR.
SS-OCT and SS-OCTA Imaging
Swept-source (SS)-OCT and SS-OCTA imaging was performed using a research prototype ultrahigh-speed SS-OCT system. As the system has been described in detail elsewhere,9 only an overview is provided herein. Briefly, the system uses a 400 kHz vertical cavity surface emitting laser (VCSEL) centered at 1050 nm. The imaging range was approximately 2.1 mm in tissue, and the axial and transverse resolutions in tissue were ~8–9 μm and ~15 μm, full-width-at-half-maximum (FWHM), respectively. The measured sensitivity was ~98 decibels using ~1.8 mW of incident power.
OCT and OCTA imaging was performed over 3 mm × 3 mm fields of view, with 5 repeated B-scans taken at 500 uniformly spaced locations centered on the fovea. Each B-scan consisted of 500 A-scans and the interscan time between repeated B-scans was ~1.5 ms, accounting for the mirror scanning duty cycle. The acquisition time for repeated B-scans was ~7.5 ms (~1.5 ms × 5) per retinal location. A total of 5 × 500 × 500 A-scans were acquired per OCTA volume for a total acquisition time of ~3.9 s. The volumetric scan pattern yields isotropic transverse sampling of the retina at 6 μm over the 3 mm × 3 mm field of view.
OCTA images were formed by computing a decorrelation signal on a pixel-by-pixel basis. Specifically, decorrelation of adjacent B-scans (i.e., 1↔2, 2↔3, 3↔4, and 4↔5) was used to generate OCTA data corresponding to a ~1.5 ms interscan time. Decorrelation signals were averaged to improve the signal-to-noise ratio.
Image Processing and Analysis
Processing was performed using custom software written in Matlab (MathWorks, MA, USA). Acquired SS-OCT and SS-OCTA data were flattened with respect to the Bruch’s membrane by automatically segmenting the Bruch’s membrane on OCT B-scans. En face OCTA projections were formed by computing the maximum projection of the OCTA signal, in the axial direction, through the depths spanned by the retinal vasculature. The en face OCTA projections were then automatically contrast adjusted, and motion artifacts, which cause high decorrelation, were automatically detected and removed from the image. Next, the vessel structures were enhanced using a vesselness filter10 (Fig. 1B). From the contrast enhanced vesselness filtered image, binarized vessel maps were constructed (Fig. 1C). Binarization was performed by starting at the border of the image and recursively visiting the neighboring pixels that had values above an empirically determined pre-defined threshold (set to 1/4 of the mean calculated over a 20 × 20 pixel neighborhood); the visited vessels form the binarized map. This approach exploits vascular continuity in that by initializing the algorithm on the image borders, every vessel can be visited. The binarized vessel map was then filtered using morphological operations to fill small gaps, improving connectivity. In the final step, the intercapillary areas were determined by finding the connected components of the inverted binary map.
Figure 1.
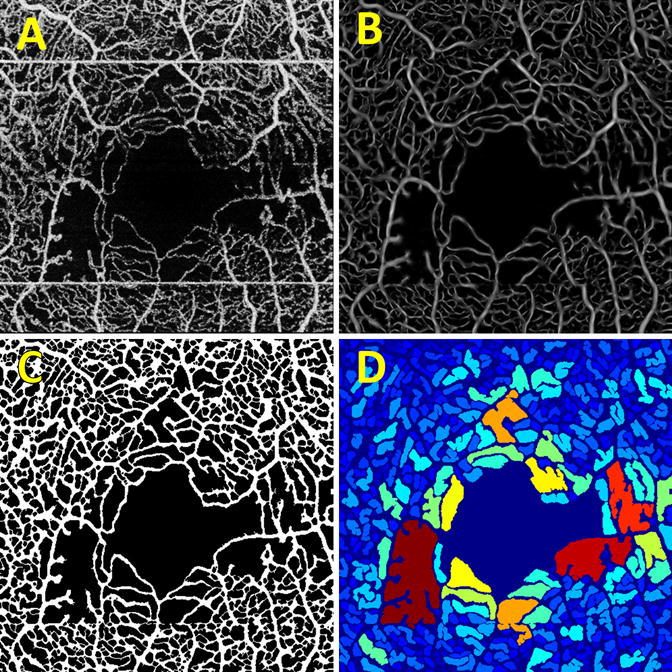
Intermediate stages of the processing pipeline. (A) The contrast enhanced input en face OCTA projection. Notice the horizontal white stripes, which correspond to patient motion; these are automatically removed by the algorithm. (B) The contrast enhanced image after vesselness filtering. (C) The binarized output image. (D) The intercapillary area map, where the connected components of the image are colored according to their size.
For purposes of visual analysis, a false color map was constructed in which the color of a given connected component was determined by its size, with blue indicating smaller areas, and red larger areas (Figure 1D). These color maps are analogous to those presented in Agemy et al., but use intercapillary area instead of vascular density. For better visualization, the FAZ, which is selected as the largest connected component, and the vessels, which separate the connected components, were colored dark blue. Finally, for the quantitative analysis of intercapillary area, the mean of the largest 10 and 20 areas, either including or excluding the FAZ, contained within a 0.75 mm radius centered on the FAZ, were computed.
Results
Retrospective data from eyes from normal controls, DM patients without DR, NPDR patients, and PDR patients, were analyzed using the described algorithm (Table 1). For each subject, only one eye was included in the study. Of the 26 eyes analyzed, the algorithm failed to properly segment the retinal vasculature in 4 eyes, and these eyes were excluded from the analysis; these failures are detailed in the Discussion. Example output images are shown in Figure 2, and the cohort statistics are summarized in Figure 3. The reproducibility coefficient of variation (CV) for the 5 eyes (1 normal, 2 NPDR, and 2 PDR) having two independent OCTA acquisitions was computed; for the other subjects, two independent acquisitions were not available. For the mean of the 20 largest intercapillary areas, including the FAZ, the CV ranged from 0.2%–6.7%; for the mean of the 20 largest intercapillary areas, excluding the FAZ, the CV ranged from 0.3%–11.0%; for the mean of the 10 largest intercapillary areas, including the FAZ, the CV ranged from 0.2%–8.8%; and for the mean of the 10 largest intercapillary areas, excluding the FAZ, the CV ranged from 0.2%–16.2%.
Table 1.
Subject characteristics.
| Normal | DM without DR | NPDR | PDR | |
|---|---|---|---|---|
| Mean Age (± std) | 36.0 ± 11.7 | 62.4 ± 5.9 | 59.0 ± 7.1 | 45.6 ± 15.8 |
| Patients Analyzed (Male : Female) | 5 (1 : 4) | 7 (3 : 4) | 9 (6 : 3) | 5 (2 : 3) |
Figure 2.
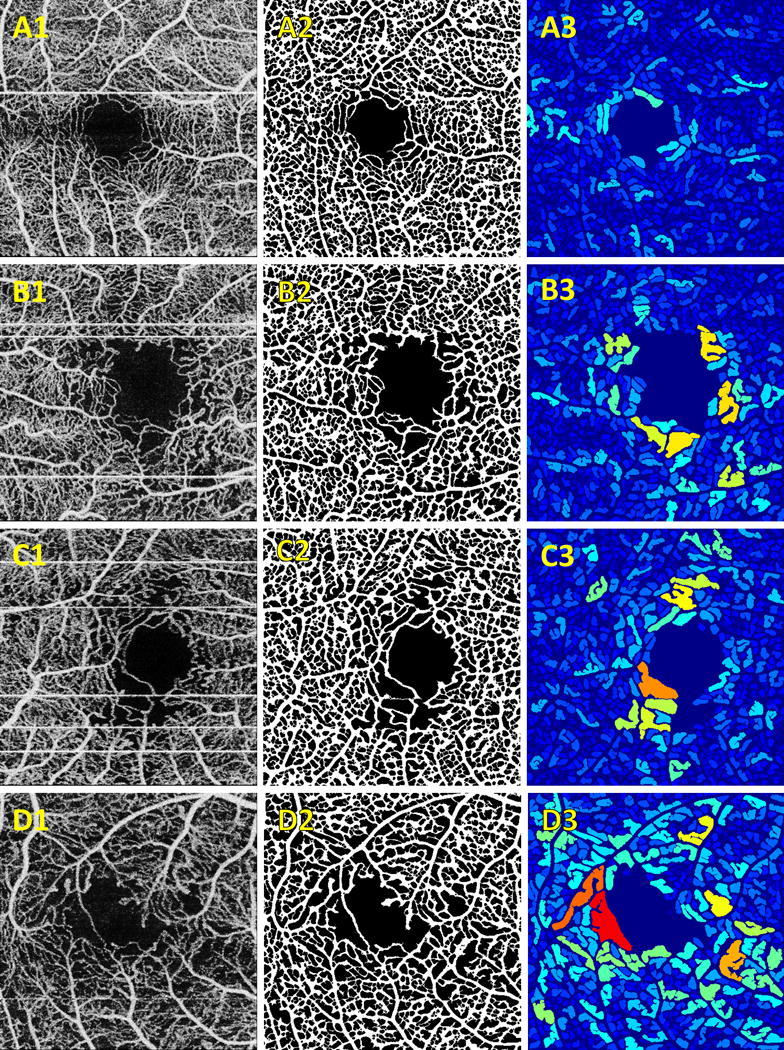
Representative examples of algorithm output. (A) normal control; (B) DM patient without DR; (C) NPDR patient; (D) PDR patient. (A–D).1 Contrast enhanced input en face OCTA projections. (A–D).2 Binarized vessel maps. (A–D).3 Intercapillary area maps.
Figure 3.
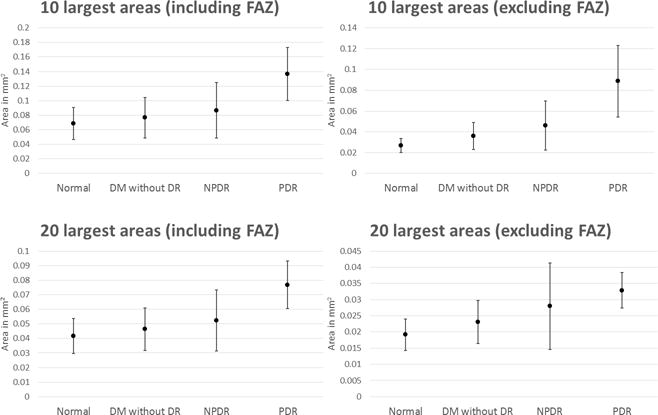
Intercapillary area statistics for each cohort. Points correspond to mean value and error bars correspond to standard deviations.
Discussion
The results summarized in Figure 3 show that the means of the 10 and 20 largest intercapillary areas, either including or excluding the FAZ, are useful metrics for characterizing disease status in patients with DM and DR. While each of these four measures show a separation, the mean of the 10 largest areas, excluding the FAZ, appears to best separate the different cohorts; this is likely attributable to at least two factors. First, larger areas are more robustly segmented than smaller areas—primarily because noise is less likely to produce continuous paths between the boundaries of larger intercapillary areas—meaning that the 10 largest areas are more likely to be correctly segmented than the 20 largest areas. Second, the FAZ has been shown to have a large variation,8 even amongst normal controls, and so inclusion of the FAZ, which is the largest intercapillary area, may obscure the variation that exists amongst the smaller intercapillary areas. It should also be noted that we did experiment with other values besides the 10 and 20 largest areas, though not in an exhaustive manner. In general we found that including a very large number of intercapillary areas (e.g., all of the areas), led to an increased rate of segmentation errors, somewhat obfuscating the true differences in area.
The algorithm successfully segmented 22 of the 26 eyes. We identified two major reasons for having to exclude images (Figure 4). Three of the 4 excluded scans, an example of which is shown in the first column of Figure 4, contained regions of low OCTA signal that do not correspond to capillary loss. Consequently there were no visible vessel structures in these regions that could be identified by the algorithm, leading to them being identified as large intercapillary areas. The remaining excluded case, which is shown in the second column of Figure 4, occurred because there was excessive noise in a region of image, for example the FAZ. In this case, the algorithm incorrectly identified the noise in the image as vasculature, greatly reducing the intercapillary area. Both types of exclusions are the result of lower quality OCTA images; we expect that their occurrence should become less frequent as OCTA imaging technology improves.
Figure 4.
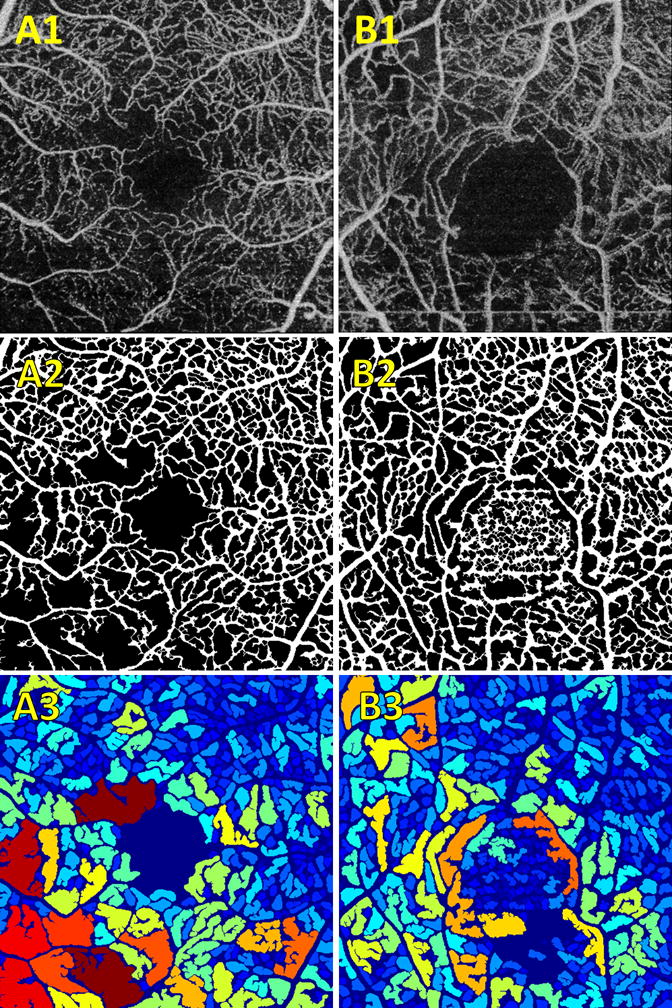
Examples of exclusions. (A–B).1 Contrast enhanced input en face OCTA projections. (A–B).2 Binarized vessel maps. (A–B).3 Intercapillary area maps. (A) Example wherein one region of the image, in this case the bottom left quadrant, has low OCTA signal. As we can see from the corresponding binarized vessel map, this algorithm treated this region as a large intercapillary area. (B) Illustrates segmentation failure wherein excessive noise in a region, in this case the FAZ, causes erroneous segmentation.
It is important to note that the presented method was used to analyze OCTA data collected over relatively small, 3 mm × 3 mm, fields of view. From initial analysis we found that OCTA collected over larger fields of view, namely 6 mm × 6 mm, with the same number of A-scans per B-scan, were not well suited to our algorithm. Specifically, the proportionally lower A-scan sampling density made individual vessels hard to resolve, complicating the segmentation step. With this in mind, it is plausible that our presented algorithm would work best if the retinal vasculature was separated into its various plexuses—projection of multiple plexuses increases the density of the vasculature. However, we opted to avoid this route because separation of the different vascular plexuses requires an extra automatic segmentation step, which can be difficult in cases of pathology, for example in eyes with edema. Another noteworthy point to consider is that we used OCTA data without any motion correction. Patient motion, typically appearing on OCTA as highly decorrelated horizontal or vertical stripes, can severely disrupt the appearance vasculature. To mitigate this issue we built into our algorithm an automatic motion-detection functionality that removes areas of patient motion. While this strategy eliminates the most serious effects of patient motion, it does not correct the distortions in the vascular network. Using data acquired with an eye-tracking system, or post-processed using motion correction software, has the potential to reduce the failure rate of our algorithm and improve its accuracy.
In the context of prior work, our algorithm is closest to the intercapillary analysis of the perifoveum presented by Salz et al., and our findings are similar to their reported results. Compared to their work, the significant advantage of our methodology is that it is fully automatic, which greatly increases its clinical applicability. When compared to the automatic quantification of non-perfusion presented Jia et al., and Hwang et al., our work represents significant advantages from an image processing viewpoint. In particular, thresholding techniques, like those used by Jia et al., and Hwang et al., are susceptible to local variations in signal levels, and are also heavily influenced by the signal-to-noise ratio. Furthermore, thresholding techniques operate on a pixel-by-pixel basis, and do not consider the spatial relationships between pixels. Comparatively, our algorithm binarizes the vascular network by exploiting the continuity of the vascular structure. When compared to the algorithm by Agemy et al., our algorithm is fundamentally more sensitive to capillary dropout, because our approach is based on the intercapillary area, rather than vascular density; this is explained Figure 5. That intercapillary area based approaches are more sensitive to small capillary changes is a double-edged sword, with small errors in segmentation potentially causing large errors in the measured intercapillary area (Figure 5C). However, we expect that as the quality of OCTA technology continues to improve, intercapillary based techniques will ultimately gain the advantage in the trade-off between sensitivity and robustness.
Figure 5.
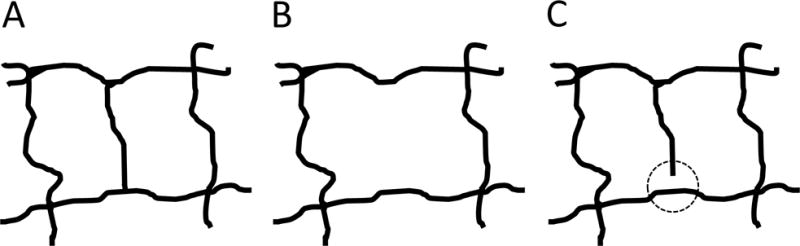
Pictorial explanation of the advantages of intercapillary area based techniques over vessel density based techniques. (A) Hypothetical healthy vascular structure. Here, there are two intercapillary areas, both of roughly equal size. (B) The center capillary is lost, creating a single intercapillary area of roughly double the size. Thus, the largest intercapillary area would double; however, the vessel density does not change by a commensurate amount. Herein lies the advantage of intercapillary area based techniques: relatively small changes in vessel density can cause much larger changes in intercapillary area. (C) The increased sensitivity comes at a cost: if there is an error in segmentation, seen here as a small discontinuity inside the dashed circle, the intercapillary area doubles, while the vessel density remains virtually unaffected. Thus, vessel density based techniques have a robustness advantage compared to intercapillary area techniques.
There are several limitations of this study. First our cohort sizes are small, and are not age-matched; in particular, our group of normal subjects is, on average, younger than the other groups (Table 1). Because of the small cohort sizes and lack of age-matching we did not perform statistical analysis, and it is not clear whether the trends observed in this paper will hold for larger, age-matched groups. Furthermore, because of our small cohort sizes, and because the data was retrospectively selected, reproducibility analysis was only performed on a small group. Finally, we have only evaluated our algorithm on data from a single prototype system; additional testing on data collected using other systems should be performed in the future.
OCTA has the potential to significantly improve the ability to screen and monitor DM and DR patients. However, critical to its widescale adoption is the development of image processing and analysis techniques to facilitate the interpretation of large OCTA data sets. In this paper we have shown that the means of the 10 largest and 20 largest intercapillary areas, either including or excluding the FAZ, are useful metrics for identifying disease status in patients with DM and DR.
Summary Statement.
We present an automatic, area based algorithm for quantifying diabetes related capillary dropout using OCT angiography.
Acknowledgments
Financial Support: This work was in part supported by a grant from the Macula Vision Research Foundation, New York, National Institute of Health (NIH R01-EY011289-29A, R44-EY022864, R01-CA075289-16, FA9550-15-1-0473 and FA9550-12-1-0499). EAN is a researcher supported by CAPES Foundation, Ministry of Education of Brazil, Brasilia, DF, Brazil.
Footnotes
Conflicts of Interest: Jay S. Duker is a consultant for and receives research support from Carl Zeiss Meditec and OptoVue. Nadia K. Waheed was a consultant for Iconic therapeutics, served the speaker’s bureau for Thrombogenics, and received research support from Carl Zeiss Meditec, Inc. Joachim Hornegger: Royalties from property owned by Massachusetts Institute of Technology and licensed to Optovue. James G. Fujimoto: Royalties from intellectual property owned by the Massachusetts Institute of Technology and licensed to Carl Zeiss Meditec Inc., Optovue Inc.; Stock options – Optovue Inc. There are no conflicting relationships for any other author.
References
- 1.Hwang TS, Jia Y, Gao SS, et al. Optical Coherence Tomography Angiography Features of Diabetic Retinopathy. Retina (Philadelphia, Pa) 2015;35:2371–6. doi: 10.1097/IAE.0000000000000716. [DOI] [PMC free article] [PubMed] [Google Scholar]
- 2.Couturier A, Mané V, Bonnin S, et al. CAPILLARY PLEXUS ANOMALIES IN DIABETIC RETINOPATHY ON OPTICAL COHERENCE TOMOGRAPHY ANGIOGRAPHY. RETINA. 2015;35:2384–91. doi: 10.1097/IAE.0000000000000859. [DOI] [PubMed] [Google Scholar]
- 3.Ishibazawa A, Nagaoka T, Takahashi A, et al. Optical coherence tomography angiography in diabetic retinopathy: A prospective pilot study. American Journal of Ophthalmology. 2015;160:35–44.e1. doi: 10.1016/j.ajo.2015.04.021. [DOI] [PubMed] [Google Scholar]
- 4.Cho H, Alwassia AA, Regiatieri CV, et al. Retinal Neovascularization Secondary to Proliferative Diabetic Retinopathy Characterized by Spectral Domain Optical Coherence Tomography. Retina (Philadelphia, Pa) 2013;33:542–7. doi: 10.1097/IAE.0b013e3182753b6f. [DOI] [PMC free article] [PubMed] [Google Scholar]
- 5.Jia Y, Bailey ST, Hwang TS, et al. Quantitative optical coherence tomography angiography of vascular abnormalities in the living human eye. Proceedings of the National Academy of Sciences. 2015;112:E2395–E402. doi: 10.1073/pnas.1500185112. [DOI] [PMC free article] [PubMed] [Google Scholar]
- 6.Hwang TS, Gao SS, Liu L, et al. Automated quantification of capillary nonperfusion using optical coherence tomography angiography in diabetic retinopathy. JAMA Ophthalmology. 2016;134:367–73. doi: 10.1001/jamaophthalmol.2015.5658. [DOI] [PMC free article] [PubMed] [Google Scholar]
- 7.Agemy SA, Scripsema NK, Shah CM, et al. RETINAL VASCULAR PERFUSION DENSITY MAPPING USING OPTICAL COHERENCE TOMOGRAPHY ANGIOGRAPHY IN NORMALS AND DIABETIC RETINOPATHY PATIENTS. RETINA. 2015;35:2353–63. doi: 10.1097/IAE.0000000000000862. [DOI] [PubMed] [Google Scholar]
- 8.Salz DA, de Carlo TE, Adhi M, et al. SElect features of diabetic retinopathy on swept-source optical coherence tomographic angiography compared with fluorescein angiography and normal eyes. JAMA Ophthalmology. 2016 doi: 10.1001/jamaophthalmol.2016.0600. [DOI] [PMC free article] [PubMed] [Google Scholar]
- 9.Choi W, Potsaid B, Jayaraman V, et al. Phase-sensitive swept-source optical coherence tomography imaging of the human retina with a vertical cavity surface-emitting laser light source. Optics Letters. 2013;38:338–40. doi: 10.1364/OL.38.000338. [DOI] [PMC free article] [PubMed] [Google Scholar]
- 10.Frangi AF, Niessen WJ, Vincken KL, et al. Multiscale vessel enhancement filtering. In: Wells WM, Colchester A, Delp S, editors. Medical Image Computing and Computer-Assisted Interventation — MICCAI’98: First International Conference Cambridge, MA, USA, October 11–13, 1998 Proceedings. Berlin, Heidelberg: Springer Berlin Heidelberg; 1998. pp. 130–7. [Google Scholar]